


Abstract
Methylation of histone H3 lysine 4 (H3K4) by Set1 complex/COMPASS is a hallmark of eukaryotic chromatin, but it remains poorly understood how this post-translational modification contributes to the regulation of biological processes like the cell cycle. Here, we report a H3K4 methylation-dependent pathway in Saccharomyces cerevisiae that governs toxicity toward benomyl, a microtubule destabilizing drug. Benomyl-sensitive growth of wild-type cells required mono- and dimethylation of H3K4 and Pho23, a PHD-containing subunit of the Rpd3L complex. Δset1 and Δpho23 deletions suppressed defects associated with ipl1-2 aurora kinase mutant, an integral component of the spindle assembly checkpoint during mitosis. Benomyl resistance of Δset1 strains was accompanied by deregulation of all four tubulin genes and the phenotype was suppressed by tub2-423 and Δtub3 mutations, establishing a genetic link between H3K4 methylation and microtubule function. Most interestingly, sine wave fitting and clustering of transcript abundance time series in synchronized cells revealed a requirement for Set1 for proper cell-cycle-dependent gene expression and Δset1 cells displayed delayed entry into S phase. Disruption of G1/S regulation in Δmbp1 and Δswi4 transcription factor mutants duplicated both benomyl resistance and suppression of ipl1-2 as was observed with Δset1. Taken together our results support a role for H3K4 methylation in the coordination of cell-cycle progression and proper assembly of the mitotic spindle during mitosis.
POST-TRANSLATIONAL modifications present on the amino-terminal tails of histone proteins are important regulators of gene expression and other chromatin-associated processes. Modifications include methylation, acetylation, phosphorylation, and ubiquitylation (Kouzarides 2007). H3K4 methylation is a hallmark of actively transcribed chromatin (Kouzarides 2007). While this modification itself does not have major consequences on chromatin structure per se, effector proteins carrying dedicated methyllysine binding domains like PhD fingers, chromo and tudor domains, as well as WD40 repeats, are thought to read and translate the presence of the mark (Taverna et al. 2007). Functional changes in chromatin structure are achieved through indirect recruitment of complexes that carry chromatin remodelling or modifying activities (Tessarz and Kouzarides 2014). In the yeast Saccharomyces cerevisiae, H3K4 is modified exclusively by the Set1C/COMPASS histone methyltransferase (Miller et al. 2001; Roguev et al. 2001; Nagy et al. 2002), which is composed of eight subunits: Set1, Swd1, Swd2, Swd3, Spp1, Bre2, Sdc1, and Shg1. The Set1 protein carries the catalytic SET domain and requires the presence of other complex components for activity (Dehe and Geli 2006). Set1C is physically linked to transcription via the C-terminal domain of RNA polymerase II (Ng et al. 2003b) and transcription units are characteristically marked with H3K4me3 at 5′-ends, whereas H3K4me2 and H3K4me1 prevail toward the 3′-ends (Pokholok et al. 2005). Several studies highlighted an overall repressive impact of H3K4 methylation on transcription. H3K4 dimethylation recruits deacetylase complexes to antagonize nucleosome acetylation and remodelling downstream of promoters (Kim and Buratowski 2009; Pinskaya et al. 2009). Repressive function frequently involves regulation of antisense transcription (Margaritis et al. 2012; Castelnuovo et al. 2014).
While much effort has been spent to elucidate how H3K4 methylation states correlate with gene expression patterns (Briggs et al. 2001; Bernstein et al. 2002; Santos-Rosa et al. 2002; Boa et al. 2003; Venkatasubrahmanyam et al. 2007; Guillemette et al. 2011), less is known about associated biological functions that are regulated via this chromatin modification. Possibly, this is due to the more frequent analyses of steady-state conditions, for which H3K4 methylation appears to have a rather limited impact on mRNA levels, compared to dynamic gene expression processes, which appear to be impacted more strongly (Margaritis et al. 2012; Weiner et al. 2012). A notable exception is the Set1-dependent expression of genes required for ergosterol synthesis, which provides cells with resistance to the antifungal compound Brefeldin A (South et al. 2013).
Approximately two hundred genes are expressed specifically during G1 phase in S. cerevisiae under control of two transcription factors: MBF and SBF (for recent review see Bertoli et al. 2013). Both factors are constituted by sequence-specific DNA binding proteins Mbp1 and Swi4, respectively, that function in association with Swi6. While SBF and MBF both act as transcriptional activators of G1 genes, MBF appears to also function as repressor (Bean et al. 2005) that represses G1 transcription outside of this cell-cycle phase (de Bruin et al. 2006); MBF target genes frequently contribute to DNA replication and repair. Interestingly, regulation of transcription at the G1/S boundary by MBF is controlled by DNA replication checkpoint kinases, which inactivate MBF via phosphorylation of its associated corepressor Nrm1 (de Bruin and Wittenberg 2009). This mechanism prevents cell-cycle entry until genotoxic stress has been resolved. The roles played by histone modifications in regulation of G1/S transcription remain to be clarified in yeast. In human cells it is well established that E2F transcription factors employ Set1 and MLL1 H3K4 methyltransferases during the G1/S transition (Tyagi et al. 2007).
Interestingly, the Set1C complex has been involved in the regulation of chromosome segregation during mitosis (Zhang et al. 2005). The kinetochore component Dam1 has been identified as nonhistone substrate for Set1C and its methylation was suggested to antagonize phosphorylation by Aurora kinase Ipl1 (Zhang et al. 2005). Aurora kinase activates the spindle assembly checkpoint (SAC), which ensures proper attachment of mitotic spindles to kinetochores at the onset of the metaphase–anaphase transition (Tanaka et al. 2002). Improper spindle attachment will be resolved through the activity of Ipl1 to allow spindle reattachment until all chromatids have achieved a proper bipolar link (Tanaka et al. 2002; Dewar et al. 2004). The absence of aurora kinase activity is thus contributing to missegregation of chromatids. Whether the activities of Set1C in methylation of H3K4 and of Dam1 functionally interact remains unclear. It was proposed, however, that both substrates are controlled by overlapping regulatory pathways involving the ubiquitination of histone H2B on lysine K123, consistent with the existence of a coordinated function (Latham et al. 2011).
Benomyl is a microtubule destabilizing drug, which contains the active compound methyl benzimidazol-2-yl-carbamate (MBC). MBC is known to cause the depolymerization of microtubules in vivo (Jacobs et al. 1988) and in vitro (Kilmartin 1981), most likely by directly binding to tubulin (Neff et al. 1983). Interestingly, MBC treatment of yeast cells results in metaphase arrest and chromosome nondisjunction due to defective mitotic spindles (Wood 1982).
Here, we report the identification of a benomyl toxicity pathway that implicates Set1C and methylation of H3K4. Absence of methylation, or of the H3K4 methyl binding protein Pho23, promotes resistance toward benomyl and the suppression of defects associated with a temperature-sensitive ipl1-2 allele. Our results implicate Set1C in proper transcriptional regulation during the cell cycle. G1 transcriptional regulators MBF and SBF recapitulate the requirement for benomyl-sensitive growth and suppression of ipl1-2. We suggest that Set1C and H3K4 methylation contribute to a functional cross-talk that coordinates cell-cycle progression with chromosome segregation during mitosis.
Materials and Methods
Growth and manipulation of yeast strains
Strains used in this study are listed in Supplemental Material, Table S1. Yeast were grown at 30° either in rich YPD medium (2% bactotryptone, 1% yeast extract, and 2 or 4% glucose), or in synthetic drop-out medium (0.67% yeast nitrogen base, 1× amino acids, and 2 or 4% glucose). For the benomyl spot assays, cultures were grown in YPD medium overnight at 25° in 96-well microtiter plates under vigorous shaking. The next day, 20-fold serial dilutions were spotted on agar plates that either lacked or contained benomyl in DMSO (0, 20, and 40 μg as indicated in the figures). Plates were photographed following incubation at 30° until colonies formed, usually 1–3 days; slow growing mutants or low temperatures required longer incubation times. Assays in liquid culture were performed accordingly; however, the total OD600 was maintained to <1.0 to ensure exponential growth.
For synchronization, wild-type (WT) and Δset1 cells lacking the Bar1 protease were grown to an OD600 of 0.3–0.4 and arrested in the presence of 5 µg/ml alpha-factor peptide for ∼2 hr; cells were checked under the microscope to ensure that at least 95% of cells were devoid of budding. Alpha-factor was removed by three consecutive washes in 10 mM Tris-HCl, pH 7.5, and the cell cycle was continued by resuspending the cells in prewarmed (30°) YPD medium. The 15-ml culture aliquots were collected in 15-min intervals.
To enable EdU incorporation SET1 was deleted in strain W303 (RAD5) URA3::GPD-TK5x AUR1c::ADH-hENT1 in the laboratory of Philippe Pasero [Institute of Human Genetics (IGH), Montpellier, France]. FACS and EdU-labeling experiments were performed as previously described (Talarek et al. 2015).
RNA extraction, RNA sequencing, and data analysis
Total RNA was extracted using the hot phenol method as described (Dichtl et al. 2004). For RNA-sequencing (RNA-seq) analysis, 1 μg of total RNA was processed for 3′-end focused RNA-seq by the poly(A) tail sequencing (PAT-seq) approach (Harrison et al. 2015). To identify genes differentially regulated between WT and ∆set1, the equivalent of paired samples t-test, with samples paired by time, was performed. The null hypothesis, being that expression varies over time, but at each time, is the same for both strains. The alternative hypothesis is that the expression level differs between strains, this difference being the same at each time point. If there was a difference between strains that changes over time, this was viewed as noise and reduced the significance of the result. Read counts were transformed and weighted using limma’s voom function, then they were tested using Fitnoise as described in Harrison et al. (2015). Like limma, Fitnoise uses an empirical Bayes method to moderate the estimate of residual variance for each gene based on residual variance observed in other genes, increasing the statistical power. The data can be viewed interactively here http://rnasystems.erc.monash.edu/publications/datasets/cell_cycle_Set1/. Raw RNA-seq data have been deposited in the Gene Expression Omnibus (GEO) repository with accession no. GSE83162.
Clustering was performed using mclust version 4 for R: (Frayley et al. 2012). Data were first filtered for genes with >10 reads in all samples. Remaining reads were transformed using the R package Varistan. This uses Anscombe’s variance stabilizing transformation for the negative binomial distribution to produce moderated log2-transformed reads per million (RPM), in which noise is independent of expression level, https://github.com/MonashBioinformaticsPlatform/varistran (Anscombe 1948). Time series were further modified to be centered around a mean of zero. Nine clusters were found, using the mclust model “EII,” in which dimensions are uncorrelated and have equal variance, and clusters are expected to be of equal size. The dimensions in this instance are the time points. For the purpose of clustering, the time series from the WT and Δset1 strains were treated as two separate points, so a gene may belong to one cluster in the WT and a different cluster in Δset1.
For data validation, the ePAT assay (Janicke et al. 2012) was adapted for multiplexing on the Illumina MiSeq instrument. We refer to this assay as mPAT for multiplexed ePAT. The approach is based on a nested PCR that sequentially incorporates the Illumina platform’s flow cell-specific terminal extensions onto ePAT PCR amplicons. First, ePAT complementary DNA (cDNA) was generated using the anchor primer mPAT reverse (see Table S2). Next, this primer and a pool of 43 gene-specific primers were used in five cycles of amplification. Each gene-specific primer had a universal 5′-extension (see Table S2) for sequential addition of the 5′ (P5) Illumina elements. These amplicons were then purified using NucleoSpin columns (Macherey-Nagel) and entered into second round amplification using the universal Illumina Rd1 sequencing Primer and TruSeq indexed reverse primers from Illumina. Second round amplification was for 14 cycles. Note, that each experimental condition was amplified separately in the first round with identical primers. In the second round, a different indexing primer was used for each experimental condition. All PCR reactions were pooled and run using the MiSeq Reagent kit v2 with 300 cycles (i.e., 300 bases of sequencing) according to the manufacturer’s specifications. A total of 25% of reads were allocated to Phi-X, ensuring that diversity is maintained along poly(A) homopolymers at the 3′-end. Data were analyzed as for PAT-seq except that normalization was to SRP68 rather than RPM. To determine the extent of replication between data analyzed by PAT-seq vs. mPAT, circular correlation coefficient described in Jammalamadaka and SenGupta (2001). This is analogous to the Pearson correlation coefficient, but for angular variables.
Protein analysis
Protein extracts for Western blotting were prepared from 15-ml cultures using zirconium-bead homogenization. Cell pellets and zirconium beads 50% (v/v) were vortexed four times for 30 sec in 300 μl total volume in lysis buffer (20 mM Tris-HCl pH 8.0, 150 mM KCl, 10% glycerol, 0.01% NP-40, 0.5 mM DTT, 0.5 mM PMSF, 1 μM leupeptin, 1 μM pepstatin, and 0.15 μM aprotinin). Crude extracts were cleared by three consecutive 30-min centrifugation steps at maximum speed in a table-top centrifuge at 4° and concentration of total protein was determined by Bradford analysis. For Figure 4B, 40–50 μg total protein were separated on two different NuPAGE 4–12% Bis-Tris mini gels, which were then transferred side by side onto a single PVDF membrane in a semidry blotting apparatus (Bio-Rad, Hercules, CA). Antibodies for detection of alpha-tubulin (Abcam ab6161) were used in a 1:1000 dilution. A slower migrating nonspecific band was used as reference (loading control) for quantification, which was done with Image Lab software.
Strains are available upon request. File S1 contains RNA-seq data derived from cell-cycle experiments. File S2 contains information about sine wave genes and cluster changing genes. Table S1 contains the list of strains used in this study. Table S2 contains sequences of oligonucleotides used. The data can also be viewed interactively at the following website: http://rnasystems.erc.monash.edu/publications/datasets/cell_cycle_Set1/.
Data availability
The authors state that all data necessary for confirming the conclusions presented in the article are represented fully within the article. Raw RNA-seq data have been deposited in the GEO repository with accession no. GSE83162.
Results
H3K4 methylation governs benomyl toxicity
To test for a potential role of H3K4 methylation in cell-cycle control, we performed drop-test assays on rich YPD media in the absence and presence of the microtubule destabilizing drug benomyl. We found that Δset1 strains displayed a distinct growth advantage compared to WT at 25° for 20 μg/ml benomyl, while 40 μg/ml gave the strongest differences at 32° (Figure 1A). In liquid YPD media containing 40 μg/ml benomyl, both WT and Δset1 strains underwent one doubling of the OD600, with growth severely reduced after 2 hr. However, after 6–7 hr (two to three doublings of the OD600), the curves diverged with Δset1 displaying a growth advantage over WT (Figure 1B).
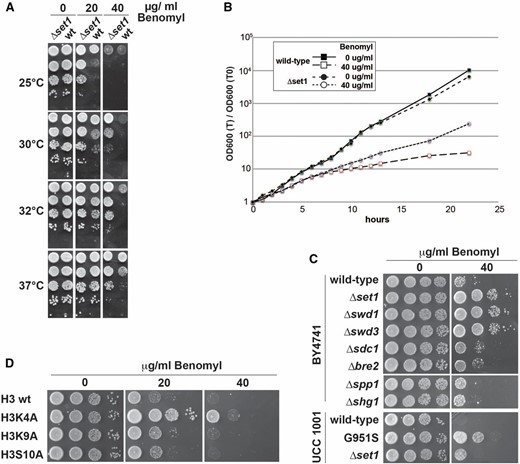
Defective H3K4 methylation confers benomyl resistance. (A) Growth of WT and Δset1 strains the presence of benomyl. Twenty-fold serial dilutions of yeast cultures were spotted on agar plates containing YPD medium and the indicated amounts of benomyl. Plates were incubated at the indicated temperatures and photographed after 1–3 days. (B) Growth curve of WT and Δset1 strains grown in benomyl liquid culture. Strains were grown in YPD medium at 30° to exponential phase and transferred to medium containing 40 μg/ml benomyl or carrier solution (DMSO) at time 0 hr. (C and D) Benomyl drop test as described in A above. Analyzed were the following mutant yeast strains: gene deletions of nonessential Set1C subunits and a G951S mutation that disrupts histone methyltransferase activity of Set1 (C); cis mutations in the amino terminus of histone H3 (D).
We asked whether the benomyl phenotype correlated with defects in H3K4 methylation status that we previously associated with Set1C mutants (Schneider et al. 2005; Dehe and Geli 2006; Margaritis et al. 2012). Δset1, Δswd1, and Δswd3 strains are deficient in formation of H3K4 me1, me2, and me3 and Δsdc1 and Δbre2 mutants are deficient in formation of me2 and me3, with less impact on me1; Δspp1 is mainly deficient in me3 but maintains robust levels of me1 and me2; Δshg1 is dispensable for methylation activity and even results in higher level of me2 and me3 (Dehe and Geli 2006; Margaritis et al. 2012). Figure 1C shows analyses of mutants derived from BY4741 background strains. Δset1, Δswd1, and Δswd3 displayed the most robust resistance toward benomyl, while Δsdc1 and Δbre2 showed a low level of resistance and Δspp1 and Δshg1 had similar sensitivity as WT. Moreover, a catalytically deficient Set1 G951S mutant (Nislow et al. 1997; Sollier et al. 2004) displayed robust resistance relative to isogenic WT, although lower than ∆set1. These results indicated that loss of H3K4 methylation and not the absence of any Set1C subunits caused benomyl resistance (Figure 1C). Consistent with this, a H3K4A cis mutation duplicated the growth advantage on benomyl; in contrast, H3K9A or H3S10A mutations behaved like WT (Figure 1D).
Dissection of benomyl-resistance pathways identifies Δpho23
To evaluate the significance of the benomyl phenotype associated with H3K4 methylation, we analyzed mutants affecting chromatin structure (Figure S1A). No benomyl-resistant growth was observed with Δset2, which is deficient in methylation of H3K36, Δdot1, which lacks methylated H3K79, and it was also not dependent on Jhd2, the H3K4 demethylase. Strains lacking the Bre1 ubiquitin ligase (E3) that monoubiquitylates H2BK123 to promote H3K4 me2 and me3 (Sun and Allis 2002) showed benomyl growth similar to Δset1, while the absence of the Rad6 ubiquitin-conjugating enzyme (E2) that functions in the same pathway had less effect. We also tested mutants of the Paf1 complex, which is known to promote H3K4 methylation (Krogan et al. 2003; Ng et al. 2003b). Interestingly, Δrtf1, but none of the other Paf1C mutants (Δpaf1, Δleo1, Δctr9, and Δcdc73) displayed a strong benomyl phenotype. Since Δrtf1 is associated with global loss of H3K4 me1 (Ng et al. 2003a; Dehe et al. 2005), it confirmed that benomyl resistance may be largely due to the loss of this modification. In contrast, the Not4 ubiquitin ligase (E3) that regulates levels of the Jhd2 demethylase (Mersman et al. 2009) did not impact on benomyl resistance, consistent with its requirement for H3K4 me3 (Laribee et al. 2007; Mulder et al. 2007); furthermore, no resistance was observed with Δccr4, which forms an alternative deadenylase complex with Not4 (Tucker et al. 2001).
PhD finger proteins Pho23, Set3, Bye1, and Cti6 have been implicated in recognition of methylated H3K4 (Shi et al. 2007). Among strains lacking any of those proteins, only Δpho23 duplicated resistant growth in the presence of 40 μg/ml benomyl (Figure S1B), which is consistent with the idea that Pho23 contributed to the H3K4 methylation-dependent benomyl phenotype. Interestingly, Pho23 is associated with the Rpd3L histone deacetylase complex (Loewith et al. 2001). We thus analyzed HAT and HDAC activities to further define benomyl resistance. HAT mutants Δhat1, Δgcn5, Δvps75, and Δrtt109 grew similarly to WT, while Δyaf9 displayed some hypersensitivity. Of the HDAC mutants analyzed here, we found that Δrpd3 displayed hypersensitivity, whereas Δhda1 and Δhda2 displayed resistance. Δhda3 and Δhos1, Δhos2, Δhos4, Δcpr1, Δsif2, Δsin3, and Δsnt1 components of HDACs Set3C, Rpd3S, and Rpd3L showed no clear growth phenotypes. Of all analyzed HAT and HDAC components, only Δpho23, Δhda1, and Δhda2 mutants showed increased resistance toward benomyl. While Pho23 has been shown to mediate Rpd3L activity on chromatin (Loewith et al. 2001), it seems possible that Δrpd3 mutants did not duplicate benomyl resistance (indeed it displayed hypersensitivity) perhaps because the protein is associated with multiple complexes that may have opposing effects (Carrozza et al. 2005; Keogh et al. 2005).
Benomyl-resistance mutations genetically interact with Aurora kinase Ipl1
Benomyl causes microtubule destabilization and interferes with proper formation of the mitotic spindle, resulting in chromosome missegregation (Wood 1982). Aurora kinase Ipl1 activates the spindle checkpoint in the absence of proper biorientation of microtubules on sister kinetochores and its activity is required to resolve aberrantly attached microtubules (Pinsky et al. 2006). We therefore tested whether mutations that elicit enhanced resistance toward benomyl, genetically interact with temperature-sensitive (ts) ipl1-2 mutations. When Δset1 and ipl1-2 were combined, we observed suppression of ts growth at intermediate temperatures, 32°, but not at 37° (Figure 2A), consistent with previous reports (Zhang et al. 2005). Interestingly, Δset1 also suppressed hypersensitive growth of ipl1-2 in the presence of benomyl. Genetic suppression of both ts and benomyl phenotypes of ipl1-2 strains by Δset1 suggests that both phenotypes resulted from the same underlying biochemical defect.
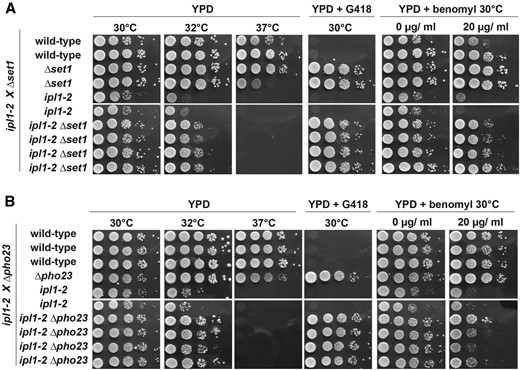
Genetic interaction of Δset1 and Δpho23 with aurora kinase ipl1-2. (A) A diploid strain containing the Δset1 and temperature-sensitive ipl1-2 mutations was sporulated and haploid ascospores with the genotypes indicated on the left were obtained. Drop tests were done as described in Figure 1A at indicated temperatures on YPD, YPD containing G418, and YPD containing 20 μg/ml benomyl. Deficient growth at 37° is due to ipl1-2 and growth on G418 marks the Δset1 allele. (B) A diploid strain containing the Δpho23 and temperature sensitive ipl1-2 mutations was sporulated and analyzed as described in A above. Deficient growth at 37° is due to ipl1-2 and growth on G418 marks the Δpho23 allele.
Next, we tested Δpho23 and observed suppression of ipl1-2 ts growth at intermediate temperatures (32°) but not at 37° (Figure 2B). In addition, Δpho23 conferred some suppression of the ipl1-2 hypersensitive growth on benomyl but appeared less potent in this capacity compared to Δset1. These observations link Pho23 to Aurora kinase. Since Pho23 contains a PHD domain, these results were consistent with the idea that methylation of H3K4 contributed to the regulation of chromosome segregation.
Transcriptional profiling of synchronized cells reveals defective gene transcription in Δset1 strains
In an attempt to identify gene expression changes that promoted enhanced benomyl resistance for Δset1 strains, we initially employed microarray analyses and RNA isolated from asynchronous WT and Δset1 cultures grown for 5 hr in the presence or absence of 40 mg/ml benomyl. However, gene expression associated with Δset1 under these conditions was highly similar to results obtained with strains grown in synthetic complete (SC) media (Margaritis et al. 2012) and did not enable us to identify gene expression changes, which could account for the benomyl-resistance phenotype (data not shown).
We reasoned that fluctuation of expression levels during the cell cycle may potentially escape detection in an asynchronous culture. Because of that, we synchronized WT and Δset1 strains through alpha-factor block and analyzed gene expression changes following release into the cell cycle using PAT-seq, a custom RNA-seq approach (Figure 3A; Harrison et al. 2015). This identified transcripts that deviated between both strains with high significance over the 2-hr duration of the experiment (P-value <0.05; File S1). A total of 448 “UP” genes had higher levels in Δset1 compared to WT, and 545 “DOWN” genes displayed lower levels (File S1). Gene ontology terms of UP genes revealed metabolic processes, consistent with an up-regulation of stress response genes as previously reported (Margaritis et al. 2012; O’Duibhir et al. 2014). The DOWN genes, in contrast, were enriched in terms related to conjugation, reproduction, and pheromone response, suggesting that H3K4 methylation contributed to these processes (File S1).
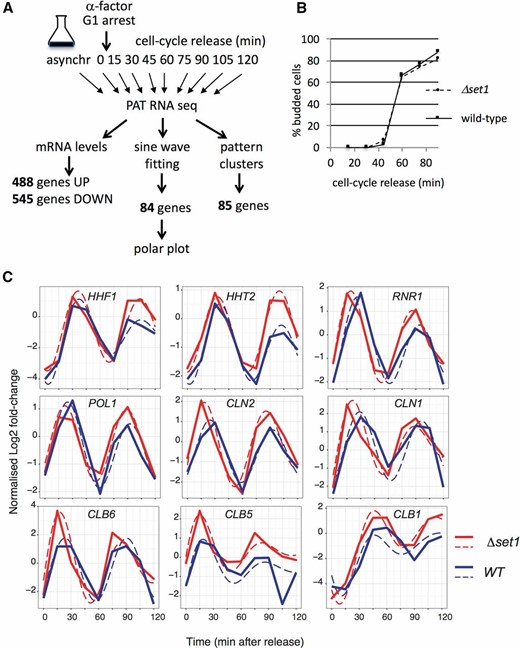
Gene expression analyses in alpha-factor synchronized WT and Δset1 strains. (A) WT and Δset1 cells were synchronized by alpha-factor treatment. Cells were released from the cell-cycle block by removal of the pheromone and samples were harvested in 15-min intervals for 2 hr. RNA of the cells was then subjected to PAT-seq high throughput sequencing. This identified transcripts that were up- or down-regulated in Δset1 throughout the duration of the time course. A parallel analysis grouped transcripts according to their sine wave signature (see Figure 5). (B) Budding index of cells subjected to alpha-factor synchronization and release as described in A. (C) Expression profiles of indicated mRNAs in WT (solid blue lines) and Δset1 (solid red lines) cells. Dashed lines indicate mathematically fitted curves (see Materials and Methods). The y-coordinate indicates mRNA oscillation amplitude where the data were centered around a mean of zero; the x-coordinate indicates time in minutes.
Increased tubulin expression in Δset1 strains
Most interestingly, we found that all four tubulin messenger RNAs (mRNAs), TUB1, TUB2, TUB3, and TUB4 were contained in the UP genes (Figure 4A). Since benomyl interacts with tubulin (Neff et al. 1983), increased TUB gene expression may contribute to the observed resistance to the drug. To further consolidate this observation, we analyzed alpha-tubulin protein levels (Tub1 and Tub3) in strains before and after alpha-factor synchronization (Figure 4B). We found that Δset1 cells displayed increased levels of alpha-tubulin relative to WT when cells were arrested in G1 (0 hr); an apparent increase of alpha-tubulin in Δset1 in asynchronous culture was observed in some but not all experiments.
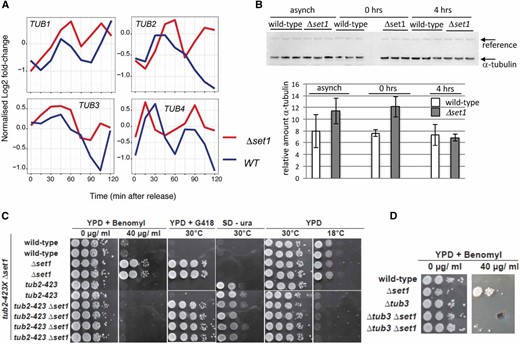
Increased tubulin expression in Δset1 strains. (A) TUB1, TUB2, TUB3, and TUB4 mRNA levels in WT (blue lines) and Δset1 (red lines) strains following alpha-factor synchronization and release into the cell cycle as described in Figure 3A. (B) Western blot (top) analysis of alpha-tubulin (Tub1 and Tub3) levels in asynchronous (asynch) WT and Δset1 strains and following alpha-factor synchronization (0 hr) and subsequent release into the cell cycle (4 hr); for each strain three independent cultures were analyzed. The arrows indicate alpha-tubulin and a cross-reacting reference band that was used as internal reference for quantification. (C) A diploid strain containing the Δset1 and cold-sensitive tub2-423 mutations was sporulated and haploid ascospores with the genotypes indicated on the left were obtained. Drop tests were done as described in Figure 1A at indicated temperatures on YPD containing 40 μg/ml benomyl, YPD containing G418, YPD and synthetic medium lacking uracil (SD −ura). Growth on SD −ura and deficient growth at 18° is due to tub2-423 allele and growth on G418 marks the Δset1 allele. (D) A diploid strain containing Δset1 and Δtub3 mutations was sporulated and obtained haploid ascospores were tested on plates containing the indicated amounts of benomyl.
We further evaluated the link between tubulin and the observed benomyl resistance by combining Δset1 with tubulin mutations. We used a deletion of the nonessential TUB3 gene, which contributes about 10% of the cellular alpha-tubulin protein (Bode et al. 2003) and the cold-sensitive (cs) tub2-423 allele, which has been found to be defective in spindle elongation (Reijo et al. 1994). Interestingly, both tubulin mutations conferred benomyl sensitivity to Δset1, demonstrating that disturbance of tubulin levels and function, respectively, interfered with the benomyl growth phenotype (Figure 4C). Conversely, however, the cs growth of tub2-423 was not suppressed by Δset1, consistent with the idea that Set1 was impacting on tubulin function indirectly via H3K4 methylation rather than direct interaction with tubulin protein.
Requirement for Set1 in cell-cycle-dependent gene expression
Inspection of cell-cycle-dependent genes in WT and Δset1 revealed tightly aligned timing and levels for a selection of genes, including POL1 and HHF1 (Figure 3C). For other genes, we observed distinct differences for both cell-cycle phase and/or expression levels. For example, expression of RNR1 (G1 phase) and HHT2 (S phase) occurred slightly earlier in Δset1, where the latter also showed a subtle increase of expression in Δset1. The G1 cyclins CLN1 and CLN2, the S-phase cyclins CLB5, and CLB6 and the G2/M cyclin CLB1 peaked slightly earlier at elevated levels in Δset1. These observations suggested a requirement for Set1 in the proper expression of cell-cycle-regulated genes and prompted a search for genes that displayed a shift in phasing or in amplitude between WT and Δset1. For this purpose, we initially fitted the data to a sine wave and identified 84 genes [false discovery rate (FDR) 0.05] that best adhered to such an expression pattern in both strains (File S2).
To visualize the impact of Δset1 on cell-cycle phase, polar plots were constructed (Figure 5A, Figure S2 and see Materials and Methods). The polar plots highlight changes in sine wave phasing as lines that are parallel to the time coordinate and that connect peak expression levels. In contrast, lines that are not parallel to the time coordinate indicate differences between peak expression levels. Polar plots thus highlight differences in phasing, peak expression, or both. The mathematical modeling in these data summarize all data points after cell-cycle release. Strikingly, the majority of gene expression changes resulted in slightly earlier onset and/or peak levels in Δset1 and occurred within 20–40 min, covering mainly the G1/S phase (Figure S2). Consistent with this, the GO term analysis of the 84 sine wave gene sets revealed highly significant P-values for G1/S-specific genes involved in DNA damage, DNA repair, cell cycle, and DNA replication (File S2). To verify expression data obtained with the global RNA-seq approach, an independent biological replicate of the cell-cycle experiment was performed and analyzed, using a multiplexed amplicon sequencing approach (mPAT; Figure 5A, see Materials and Methods). The data from the two approaches were highly correlated in terms of phase and amplitude of cell-cycle expression (circular correlation coefficient of 0.9570182). We also observed qualitatively similar gene expression changes for the majority of the analyzed genes underscoring the observations made in the genome-wide approach (Figure S2). Notably, only 9 of 84 sine wave genes can be found within the 1033 genes that contain both the 488 UP and 545 DOWN genes, illustrating a role for Set1 in differential cycle phasing in addition to oscillation amplitude.
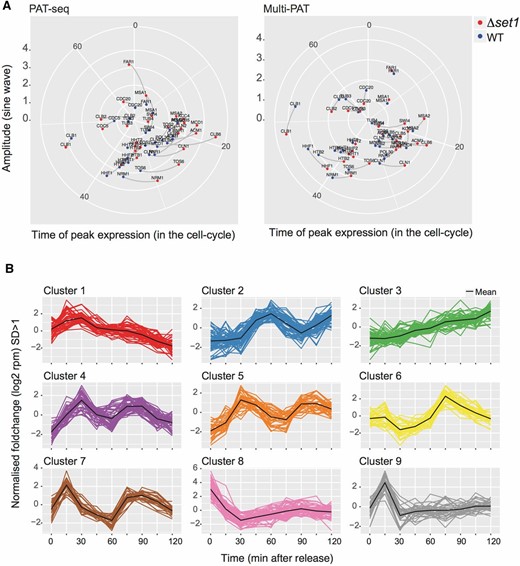
Sine wave analysis and clustering of gene expression changes in WT and Δset1 strains. (A) Polar plots were constructed to visualize gene expression differences that occurred between WT and Δset1 strains due to differences in cell-cycle phasing. Lines parallel to the time coordinate indicated differences in the phasing of gene expression, whereas lines perpendicular to the time coordinate indicate differences in expression amplitude. The two plots show data collected from two independent biological experiments of the cell-cycle synchronization, the first analyzed by the PAT-seq approach the second by the mPAT approach as indicated. To avoid overloading of the representation, both plots only show those genes that were validated by mPAT. (B) To capture additional cell-cycle-dependant gene expression in WT and Δset1 strains, all transcripts having at least 10 reads in PAT-seq data were grouped using mclust. An optimal cluster number of nine was found using the in-built Bayesian information criterion. The data were then filtered to the expression patterns of genes having a SD of <1 (SD > 1 log2-moderated transformation) from the cluster mean. From these data, 85 genes changed cluster membership between WT and Δset1.
We noted that strict sine wave fitting of the expression data were limited by perturbations at the start of the experiment when the alpha-factor block was removed and that dampening of the amplitude occurred in consecutive oscillations. We therefore refined the mathematical model with further parameters to take these effects into account (see Materials and Methods), and this was applied to fitting of both linear plots (dashed lines in Figure 3) and the polar plots in Figure 5.
To identify additional expression differences across the time course of cell-cycle reentry, the mclust R package was applied to accommodate all transcripts of the data set into nine discrete expression clusters (Figure 5B; see Materials and Methods). This approach allowed us to search specifically for mRNA differences between Δset1 and WT with respect to their expression pattern through a change in cluster association. We identified 85 “cluster changing” genes, which had a different expression profile in Δset1, and 25 of these genes overlapped with the 84 genes identified by sine wave analysis (File S2). GO terms of cluster changing genes with the highest statistical significance included the mitotic cell cycle and its regulation (File S2).
Delayed G1/S transition in the Δset1 strain
The observed differences in gene expression suggested that Δset1 strains may be defective in cell-cycle progression. To address this, we employed a new method that relies on the incorporation of the thymidine analog 5′-ethynyl-2′deoxyuridine (EdU) into DNA (Talarek et al. 2015). This procedure provides high spatial and temporal resolution of cell-cycle phases in S. cerevisiae that cannot be obtained by conventional FACS analyses (Talarek et al. 2015). WT and Δset1 strains were generated that allowed the cellular uptake of EdU and exponentially growing cultures were exposed to three different EdU pulses of 0-, 5-, and 10-min duration. The incorporation of the analog into DNA was detected following the attachment of azide-modified fluorochromes using “click” chemistry allowing the determination of the fraction of cells in S phase. FACS analysis revealed reproducible differences of cell-cycle progression between Δset1 and WT cells (Table 1 and Figure S3). For both EdU pulses, the percentage of cells that were in S phase was higher for the WT than for Δset1 (Table 1). To further confirm a distinct defect at the G1/S transition in the Δset1 mutant, alpha-factor-treated cells were released from the G1 arrest (Figure 6A). Twenty minutes after release from G1, EdU was added to the cultures for 10 min and then chased by addition of thymidine according to the scheme indicated in Figure 6B. Analysis of EdU incorporation in the FACS profile revealed a reduced number of cells in S phase in the Δset1 mutant (Figure 6C). Taken together, these results indicate that ∆set1 cells exhibit a significant delay at the G1/S transition.
Distribution of WT and Δset1 strains in different cell-cycle phases as determined by EdU incorporation
| Time of EdU pulse (min) | Strain | G0/G1a | Sa | Mid-Sa | G2/Ma |
|---|---|---|---|---|---|
| 0 | WT | 30.6 | 1.24 | 5.62 | 67.4 |
| Δset1 | 33.9 | 1.55 | 6.28 | 64.6 | |
| 5 | WT | 22.2 | 20.3 | 6.44 | 56.6 |
| Δset1 | 28.5 | 7.48 | 6.39 | 63.2 | |
| 10 | WT | 22.0 | 28.8 | 6.38 | 48.3 |
| Δset1 | 26.9 | 12.6 | 5.45 | 60.0 |
Values are from Figure S3 and indicate percentage of cells relative to total population.
| Time of EdU pulse (min) | Strain | G0/G1a | Sa | Mid-Sa | G2/Ma |
|---|---|---|---|---|---|
| 0 | WT | 30.6 | 1.24 | 5.62 | 67.4 |
| Δset1 | 33.9 | 1.55 | 6.28 | 64.6 | |
| 5 | WT | 22.2 | 20.3 | 6.44 | 56.6 |
| Δset1 | 28.5 | 7.48 | 6.39 | 63.2 | |
| 10 | WT | 22.0 | 28.8 | 6.38 | 48.3 |
| Δset1 | 26.9 | 12.6 | 5.45 | 60.0 |
Values are from Figure S3 and indicate percentage of cells relative to total population.
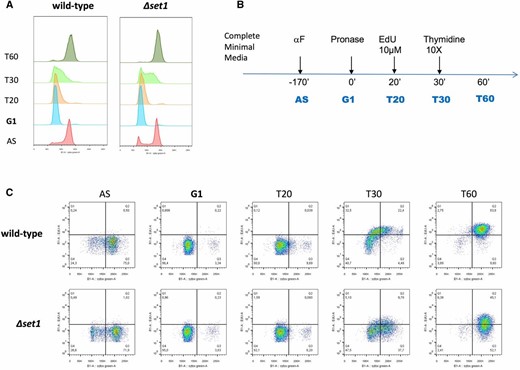
Delayed S phase entry of Δset1 cells. (A) Classical FACS profiles of WT and ∆set1 strains harboring TK-hENT1 integrated cassettes allowing fast and efficient uptake of EdU. (B) Schematic representation of the experimental sequence applied. (C) FACS profiles representing bivariate EdU Alexa 647 vs. propidium iodide dot plot. Vertical shift of the cloud represents the number of cells in S phase.
Defective expression of G1-specific genes duplicates benomyl resistance
Our results implicate methylation of H3K4 by Set1C in cell cycle progression and the control of chromosome segregation. The predominant effect of methylated H3K4 in gene expression appears to involve repressive mechanisms, which are relying on noncoding antisense RNA transcription (Margaritis et al. 2012; Weiner et al. 2012, Castelnuovo et al. 2014). We therefore asked whether benomyl resistance of Δset1 was modulated by the 3′–5′ exonuclease Rrp6, the main activity involved in the turnover of unstable noncoding RNA (ncRNA) (Wyers et al. 2005). Interestingly, growth of Δrrp6 was comparable to WT in the presence of benomyl but the mutation promoted a complete suppression of benomyl resistance associated with Δset1, possibly via the expression of ncRNA (Figure 7A).
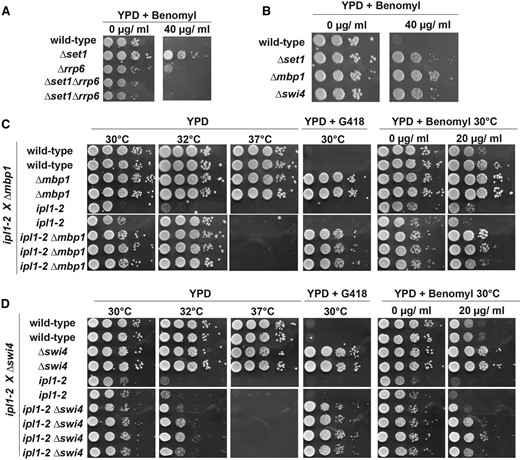
Δmbp1 and Δswi4 mutants of G1/S transcription factors are benomyl resistant and genetically interact with aurora kinase ipl1-2. (A) A diploid strain containing Δset1 and Δrrp6 mutations was sporulated and obtained haploid ascospores were tested on plates containing the indicated amounts of benomyl. (B) Benomyl phenotype of Δmbp1 or the Δswi4 yeast strains defective in G1/S transcription regulation; tests were done as described in Figure 1A. (C) and (D) Diploid strains containing either the Δmbp1 or the Δswi4 deletion in combination with the temperature-sensitive ipl1-2 allele were sporulated and haploid ascospores with the indicated genotypes were obtained. Drop tests were done as described in Figure 1A at indicated temperatures on YPD, YPD containing G418, and YPD containing 20 μg/ml benomyl. Deficient growth at 37° is due to ipl1-2 and growth on G418 marks the Δmbp1 and Δswi4 alleles, respectively.
We searched for evidence of ncRNA expression that could explain changes to TUB1-4 expression within the cell cycle. However, none of the four TUB genes was associated with ncRNA in previously reported tiling arrays of the yeast cell cycle (Granovskaia et al. 2010). We next searched tiling arrays from steady-state yeast bearing either single or double Δset1 and Δrrp6 mutations (http://steinmetzlab.embl.de/cgi-bin/viewArrayProfile.pl). In these data, >7000 ncRNA are annotated and therefore most genes hold annotations for either antisense transcription, bidirectional promoter activity, or sense transcription associated with the promoter or the 3′-UTR. For the TUB genes, the TUB1 3′-UTR overlaps in antisense with ncRNA2479/SUT287. TUB2 shows no evidence for local ncRNA expression (including for RUF21). TUB3 is associated with an annotated RNA ncRNA2455, but which is not expressed at steady state in the mutants in question. The TUB4 gene appears to be associated with bidirectional promoter activity that is Rrp6 dependent (ncRNA2263/CUT281); however, the expression of this RNA is anticorrelated with the upstream gene PHO84 and not TUB4. Therefore, none of these ncRNA easily explains the increase in TUB gene expression within the Δset1 cell cycle. Next, we searched the local ncRNA landscape around each of the 84 sine wave genes and 85 genes that change in cluster membership in the Δset1 cell cycle. Using the same criteria as above, 77/84 (92%) and 77/85 (90%) of the genes, respectively, were associated with annotated ncRNA either in the sense, antisense, or bidirectional configuration (see File S2). Two issues make direct comparisons between published expression of these ncRNA and their potential impact on our data problematic. First, we are comparing steady-state expression to cell-cycle expression in different strains. And second, while we see evidence for adenylated ncRNA expression in PAT-seq data, we did not identify changes in ncRNA expression that directly explain the phenotypes observed. For example, SUT287 is detected in our data with an adenylation site overlap of ∼100 bases with TUB1; however, the expression of the ncRNA is not significantly different between the WT and Δset1 cell cycle and thus cannot easily explain TUB1 overexpression in Δset1. In sum, the deregulation of a single ncRNA is unlikely to drive the complex changes to gene expression that underlie resistance to benomyl or the early firing of the cell cycle in the Δset1 mutant.
We considered the possibility that defective gene expression of Δset1 during G1/S and delayed S-phase entry may contribute to benomyl-resistant growth. Since gene expression during G1/S phase is regulated by the MBF and SBF transcription factors, we analyzed Δmbp1 and Δswi4 strains on benomyl and observed resistant growth similar to Δset1 (Figure 7B). To further link G1/S transcription to chromosome segregation, we then combined Δmbp1 and ipl1-2 mutations and we observed suppression of ts growth at intermediate temperatures, 30° and 32°, but not at 37° (Figure 7C). Moreover, Δmbp1 also efficiently suppressed hypersensitive growth of ipl1-2 in the presence of benomyl. Similarly, suppression of ipl1-2 ts growth and benomyl hypersensitivity was observed with Δswi4 (Figure 7D). These data suggest that regulation of G1/S genes is intimately linked to the proper implementation of the spindle assembly checkpoint during mitosis. Regulation of gene expression during G1/S phase may thus use H3K4 methylation to coordinate proper cell-cycle progression with chromosome segregation during the metaphase–anaphase transition.
Discussion
In this work, we analyzed a cellular pathway for benomyl toxicity and show that Set1C activity, probably at the level of monomethylation, is required for WT benomyl sensitivity. This requirement involves histone methylation, since H3K4A strains duplicated benomyl resistance as did the absence of the H3K4 methyl binding protein Pho23. In an attempt to identify the molecular basis for benomyl resistance, we found that Set1C was required for proper maintenance of tubulin levels, the timely expression of genes during G1/S, and the transition into the S phase. In addition, suppression of temperature sensitivity and benomyl hypersensitivity associated with ipl1-2 link Δset1 and Δpho23 to the regulation of chromosome segregation. Based on these observations we propose that H3K4 methylation contributes to the coordination of cell-cycle progression, which links regulation at G1/S to the metaphase–anaphase transition during mitosis.
The role of H3K4 methylation in regulation of gene expression is now well established (Margaritis et al. 2012; Weiner et al. 2012; Castelnuovo et al. 2014) but the impact of this regulation on the implementation of biological function remains unclear. We synchronized WT and Δset1 cells with alpha-factor pheromone and collected gene expression data of cells following their release into the cell cycle. Approximately 500 transcripts were significantly up- or down-regulated in Δset1, respectively, during a 2-hr period of cell-cycle progression. In addition, we analyzed cyclic gene expression using sine wave fitting and a pattern clustering, which enabled the detection of differences with respect to cell-cycle phase, pattern, and peak level transcription.
In Figure 8 we summarize how H3K4 methylation can modulate benomyl toxicity. The metaphase-to-anaphase transition requires proper bipolar spindle–kinetochore attachment to ensure equal distribution of the genetic material into the emerging daughter cells (Musacchio and Salmon 2007). Benomyl induces cell-cycle arrest during mitosis, since destabilization of microtubules triggers the SAC (Li and Murray 1991; Pinsky et al. 2006). Growth in the presence of benomyl will thus be limited by the ability to resolve the SAC and to complete mitosis. Benomyl resistance may therefore be caused by enhanced microtubule stability or enhanced spindle formation. We considered it unlikely that detoxification was causing resistance, since overexpression of multidrug resistance genes was not observed in Δset1. Interestingly, it was previously shown that benomyl sensitivity of mad mutants, which have compromised SAC function, could be suppressed by delaying exit from mitosis (Li and Murray 1991). In particular, this was achieved by extending S phase with the ribonucleotide reductase inhibitor hydroxyurea, which promoted the formation of the mitotic spindle to compensate for the negative impact of benomyl (Li and Murray 1991). Our results are consistent with this proposal in that we observed misregulation of G1/S gene expression in Δset1 and a defect in the transition to S phase. The argument is strongly supported by the fact that Δmbp1 and Δswi4 also displayed benomyl resistant growth. Gene expression at G1/S is thus intimately linked to benomyl toxicity.
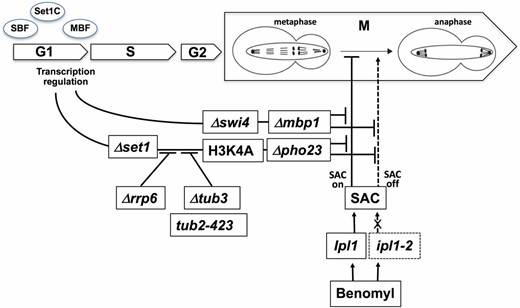
Model for the cross-talk of G1/S transcriptional regulation, H3K4 methylation, and benomyl toxicity. Defective H3K4 methylation resulting from the absence of Set1, or absence of the PHD subunit Pho23 of Rpd3L, results in resistance toward benomyl as does defective gene regulation during G1/S in Δmbp1 and Δswi4 cells. Benomyl activates the SAC by destabilizing microtubules. Mutations in aurora kinase (ipl1-2) interfere with activation of the SAC, resulting in improper chromosome segregation in the presence of benomyl. Absence of H3K4 methylation and defective G1/S transcriptional control antagonize the biological effect of benomyl in the presence of both WT and mutant aurora kinase, consistent with a role downstream of the SAC. The 3′→5′ exonuclease Rrp6, Tub3, and Tub2 tubulins are required for this antagonistic pathway.
Aurora kinase, Ipl1, senses proper bipolar spindle–kinetochore attachment and resolves interactions in the absence of tension (Dewar et al. 2004). Since Ipl1 is essential for activation of the SAC (Pinsky et al. 2006) benomyl hypersensitive growth of ipl1-2 ts strains likely is due to a failure to activate the SAC despite destabilized microtubules (Figure 8); therefore, cells will continue cell-cycle progression and nondisjunction of chromosomes will occur. Suppression of ipl1-2 ts and benomyl phenotypes by Δset1, Δpho23, Δmbp1, and Δswi4 is consistent with the proposal that defective H3K4 methylation and defective G1/S transcription cause enhanced microtubule stability and/or enhanced spindle formation. Cell-cycle progression will thus not have lethal impact despite a deficiency of ipl1-2 cells in the activation of the SAC.
Δset1 cells display a concerted misregulation of tubulin genes and contained elevated alpha-tubulin levels. Since the active benomyl component MBC binds to microtubules, increased tubulin levels may directly contribute to benomyl resistance. It seems possible that the concerted overexpression of multiple or all tubulin proteins, possibly together with other microtubule binding proteins, may be necessary to promote benomyl resistance. This idea is underscored by the observation that alpha-tubulin incorporation into microtubules is limited by the availability of beta-tubulin (Weinstein and Solomon 1990). Notably, Δset1 cells also had misregulated TUB4, which represents gamma-tubulin that is involved in spindle pole body function (Sobel and Snyder 1995; Marschall et al. 1996). Interestingly, Δset1 benomyl resistance was suppressed by cold-sensitive tub2-423 mutations (Huffaker et al. 1988). This is consistent with the proposal that Δset1 promotes microtubule stability as the mutation has been suggested to be deficient in spindle elongation (Reijo et al. 1994). In contrast, the reason for Δtub3 to suppress Δset1 benomyl toxicity is less clear. Δtub3 is nonessential for viability and Tub3 constitutes only ∼10% of alpha-tubulin, whereas Tub1 is the major alpha-tubulin component (Bode et al. 2003). Δtub3 cells are benomyl sensitive (Schatz et al. 1986), however, highlighting the contribution of all tubulin proteins to microtubule stability. Similarly, in vitro assembly experiments demonstrated distinct effects of alpha-tubulin isotypes (Tub1 and Tub3) on microtubule dynamics (Bode et al. 2003).
It remains to be resolved how H3K4 methylation is integrated with cell-cycle-dependent transcription. Since Rrp6 is required for benomyl resistance of Δset1 it seems possible that ncRNA contributes to the regulatory mechanisms. Such a requirement could be linked to the activity of Rpd3L deacetylase that carries the methylated H3K4 binding activity of Pho23 (Loewith et al. 2001). Published data indicate that ncRNA expression occurs widespread relative to Set1-dependent cell-cycle genes that were identified in this work. Strains lacking Rrp6, therefore, will harbor complex ncRNA expression patterns that are likely to have impact on the levels of a number of protein coding genes. The fact that we were not able to pinpoint a defined gene product to give rise to the benomyl-resistance phenotype in ∆set1 may indicate that the suppression of the phenotype in the absence of Rrp6 may result from the combinatorial impact on multiple genes.
Our results support a model in which transcriptional regulation during the G1/S phase of the cell cycle is integrated with events that control the progression through the metaphase–anaphase transition. The commitment of the cell to enter the cell cycle at “start” (G0) may thus be intimately linked to the implementation of chromosome segregation. We suggest that the link in part reflects the requirement to adjust the timing and duration of cell-cycle events to facilitate fluent transitions between cell-cycle phases. While this manuscript was in preparation it was reported that benomyl resistance in the set1G951S mutant was associated with a thick mitotic spindle and regulation of the SAC resolution by H3K4 methylation. Schibler et al. (2016) proposed that the ∆set1-induced benomyl resistance relies on sequestration of active C-Mad2 by H3K4me2/me3. While these observations appear to agree with our work and extend the repertoire of pathways that link H3K4 methylation to cell-cycle progression during mitosis, we clearly propose a different explanation for the benomyl resistance in ∆set1 cells.
Control of the G1/S transition and thus of cell proliferation in humans involves H3K4 methylation and Mll and Set1 histone methyltransferases (Tyagi et al. 2007). Our results suggest that yeast employs this chromatin modification to coordinate cell-cycle events. It will be interesting to see whether human cells employ H3K4 methylation to sustain similar cross-talk between G1/S phase and mitosis. Future analyses of yeast Set1C likely will provide valuable insight to further the understanding of its higher eukaryotic homologs.
Acknowledgments
We are particularly grateful to Phillipe Pasero (Institute of Human Genetics, Montpellier, France) and Etienne Schwob (Institute of Molecular Genetics, Montpellier, France) for their help with EdU experiments and FACS analysis. We thank Sharon Dent (M. D. Anderson Cancer Center, Houston) for the ipl1-2 strain and Tim Huffaker (Cornell University, Ithaca, New York) for the tub2-423 mutant. We thank David Powell from the Monash Bioinformatics and Monash Next Generation Sequencing platforms, Micromon, and the Monash Health Translation Precinct’s Medical Genomics Facility.
Footnotes
Supplemental material is available online at www.genetics.org/lookup/suppl/doi:10.1534/genetics.116.194852/-/DC1.
Communicating editor: O. J. Rando
Literature Cited
Fraley, C., A. E. Raftery, T. B. Murphy, and L. Scrucca, 2012 mclust Version 4 for R: Normal Mixture Modeling for Model-Based Clustering, Classification, and Density Estimation. Technical Report No. 597. Department of Statistics, University of Washington, Seattle.
