


Abstract
Mutagenesis is a widely used method for identifying protein positions that are important for function or ligand binding. Advances in high-throughput DNA sequencing and mutagenesis techniques have enabled measurement of the effects of nearly all possible amino acid substitutions in many proteins. The resulting large-scale mutagenesis data sets offer a unique opportunity to draw general conclusions about the effects of different amino acid substitutions. Thus, we analyzed 34,373 mutations in 14 proteins whose effects were measured using large-scale mutagenesis approaches. Methionine was the most tolerated substitution, while proline was the least tolerated. We found that several substitutions, including histidine and asparagine, best recapitulated the effects of other substitutions, even when the identity of the wild-type amino acid was considered. The effects of histidine and asparagine substitutions also correlated best with the effects of other substitutions in different structural contexts. Furthermore, highly disruptive substitutions like aspartic and glutamic acid had the most discriminatory power for detecting ligand interface positions. Our work highlights the utility of large-scale mutagenesis data, and our conclusions can help guide future single substitution mutational scans.
MAKING and studying mutants is a fundamental way to learn about proteins, revealing functionally important positions, validating specific hypotheses about catalytic mechanism, and yielding insights into protein folding and stability. Single amino acid scanning mutagenesis, in which every position in a protein is sequentially mutated to one particular amino acid, was a key advance. By searching sequence space systematically, scanning mutagenesis enabled the unbiased identification of positions and amino acid side chains important for protein function. The first application of scanning mutagenesis used alanine substitutions to identify positions in human growth hormone important for receptor binding (Cunningham and Wells 1989). Alanine was chosen because it represents a deletion of the side chain at the β-carbon. In addition to alanine, many other amino acids, including arginine (Nanevicz et al. 1995), cysteine (Kanaya et al. 1990), glycine (Valbuena et al. 2003), methionine (Woods et al. 1996), phenylalanine (Borngräber et al. 1999), proline (Vandemeulebroucke et al. 2008), and tryptophan (Zhang et al. 2007), have been used for scanning mutagenesis, often with a specific hypothesis in mind (e.g., that bulky amino acids are important). Nevertheless, some have suggested that alanine substitutions are maximally representative of the effects of other substitutions, or that they are especially useful for identifying functionally important positions (Bromberg and Rost 2008).
Which amino acid best represents the effect of other substitutions? Which substitutions are ideal for finding functionally important positions, such as those that participate in binding interfaces? Answering these questions is important because single amino acid scanning mutagenesis continues to be used to understand and engineer proteins. Despite the large investment in scanning mutagenesis, little work has been done to systematically compare the effects of different substitutions. Some scanning mutagenesis studies compare two different types of scans (e.g., alanine and cysteine), but generally find that the information revealed by each substitution is distinct (Borngräber et al. 1999; Xiao et al. 2009). Computational predictions for all substitutions at 1073 positions across 48 proteins in the Alanine Scanning Energetics Database suggested that alanine substitutions correlated best with the mean effect of every mutation at each position (Bromberg and Rost 2008). However, concrete answers to these questions require comparing the empirical effects of different substitutions in many proteins. Thus, we analyzed large-scale experimental mutagenesis data sets comprising 34,373 mutations in 14 proteins. We found that proline is the most disruptive substitution, and methionine is the most tolerated. Global and position-centric analyses revealed that histidine and asparagine substitutions best represent the effects of other substitutions, even when wild-type amino acid identity or structural context is taken into account. We evaluated the utility of each amino acid substitution for determining whether a position is in a ligand-binding interface, and found that highly disruptive substitutions like aspartic acid, glutamic acid, asparagine, and glutamine performed best. Thus, our results suggest that histidine and asparagine are the most representative substitutions, while aspartic acid and glutamic acid are the best choices for finding ligand-binding interfaces.
Materials and Methods
Data curation and rescaling
We curated a subset of the published deep mutational scanning data sets. We excluded deep mutational scans of non-natural proteins, because the mutational properties of natural and non-natural proteins could differ. The result was a set of 16 deep mutational scans of 14 proteins (Table 1). BRCA1 and UBI4 each have two large-scale mutagenesis data sets corresponding independent experiments in which different functions were assayed (e.g., ligand binding or catalytic activity). We treated these data sets separately, and did not perform any averaging of mutational effects between the data sets. Additionally, we removed any variants with more than one amino acid substitution from all the data sets.
Large-scale mutagenesis data sets used in this study
| Data set | Number of mutations | Mutagenized positions | Mutational completenessa (%) | Organism | Selected phenotype | Citation |
|---|---|---|---|---|---|---|
| Aminoglycoside kinase | 4234 | 264 | 84 | Klebsiella pneumoniae | Antibiotic resistance | Melnikov et al. (2014) |
| BRCA1 RING domain -BARD1 binding | 1748 | 102 | 90 | Homo sapiens | Binding activity (Y2H) | Starita et al. (2015) |
| BRCA1 RING domain–E3 ligase activity | 4872 | 303 | 85 | H. sapiens | Ubiquitin ligase activity | Starita et al. (2015) |
| DBR1 | 144 | 25 | 30 | H. sapiens | RNA enzyme activity | Findlay et al. (2014) |
| Gal4 | 1196 | 64 | 98 | H. sapiens | Transcription factor activity | Kitzman et al. (2015) |
| GFP | 1084 | 235 | 24 | Aequorea victoria | Fluorescence | Sarkisyan et al. (2016) |
| Hsp82 | 4021 | 219 | 97 | Saccharomyces cerevisiae | Chaperone activity | Mishra et al. (2016) |
| hYAP65 WW domain | 363 | 33 | 58 | H. sapiens | Ligand binding | Fowler et al. (2010) |
| MAPK1/ERK2 | 4470 | 359 | 66 | H. sapiens | Kinase activity | Brenan et al. (2016) |
| Pab1 | 1188 | 75 | 83 | S. cerevisiae | mRNA binding | Melamed et al. (2013) |
| Protein G GB1 domain | 1045 | 55 | 100 | Streptococcus sp. group G | IgG-Fc binding | Olson et al. (2014) |
| PSD95 pdz3 domain | 1577 | 83 | 100 | H. sapiens | Ligand binding | McLaughlin et al. (2012) |
| TEM1 β-lactamase | 5198 | 287 | 95 | Escherichia coli | Antibiotic resistance | Firnberg et al. (2014) |
| Ube4b U-box | 899 | 102 | 46 | S. cerevisiae | Ubiquitin ligase activity | Starita et al. (2013) |
| Ubi4–activity | 1249 | 75 | 88 | S. cerevisiae | Ubiquitin ligase activity | Roscoe et al. (2013) |
| Ubi4–activation by E1 | 1085 | 60 | 95 | S. cerevisiae | Ubiquitin ligase activity | Roscoe and Bolon (2014) |
Proportion of all possible single amino acid mutations in mutagenized region observed.
| Data set | Number of mutations | Mutagenized positions | Mutational completenessa (%) | Organism | Selected phenotype | Citation |
|---|---|---|---|---|---|---|
| Aminoglycoside kinase | 4234 | 264 | 84 | Klebsiella pneumoniae | Antibiotic resistance | Melnikov et al. (2014) |
| BRCA1 RING domain -BARD1 binding | 1748 | 102 | 90 | Homo sapiens | Binding activity (Y2H) | Starita et al. (2015) |
| BRCA1 RING domain–E3 ligase activity | 4872 | 303 | 85 | H. sapiens | Ubiquitin ligase activity | Starita et al. (2015) |
| DBR1 | 144 | 25 | 30 | H. sapiens | RNA enzyme activity | Findlay et al. (2014) |
| Gal4 | 1196 | 64 | 98 | H. sapiens | Transcription factor activity | Kitzman et al. (2015) |
| GFP | 1084 | 235 | 24 | Aequorea victoria | Fluorescence | Sarkisyan et al. (2016) |
| Hsp82 | 4021 | 219 | 97 | Saccharomyces cerevisiae | Chaperone activity | Mishra et al. (2016) |
| hYAP65 WW domain | 363 | 33 | 58 | H. sapiens | Ligand binding | Fowler et al. (2010) |
| MAPK1/ERK2 | 4470 | 359 | 66 | H. sapiens | Kinase activity | Brenan et al. (2016) |
| Pab1 | 1188 | 75 | 83 | S. cerevisiae | mRNA binding | Melamed et al. (2013) |
| Protein G GB1 domain | 1045 | 55 | 100 | Streptococcus sp. group G | IgG-Fc binding | Olson et al. (2014) |
| PSD95 pdz3 domain | 1577 | 83 | 100 | H. sapiens | Ligand binding | McLaughlin et al. (2012) |
| TEM1 β-lactamase | 5198 | 287 | 95 | Escherichia coli | Antibiotic resistance | Firnberg et al. (2014) |
| Ube4b U-box | 899 | 102 | 46 | S. cerevisiae | Ubiquitin ligase activity | Starita et al. (2013) |
| Ubi4–activity | 1249 | 75 | 88 | S. cerevisiae | Ubiquitin ligase activity | Roscoe et al. (2013) |
| Ubi4–activation by E1 | 1085 | 60 | 95 | S. cerevisiae | Ubiquitin ligase activity | Roscoe and Bolon (2014) |
Proportion of all possible single amino acid mutations in mutagenized region observed.
Variant annotation
DSSP was used to annotate the secondary structure and absolute solvent accessibility of each wild type amino acid in our data set (http://swift.cmbi.ru.nl/gv/dssp/DSSP_3.html). To estimate the relative solvent accessibility of amino acids, we divided absolute solvent accessibility as determined using DSSP by the total surface area of each amino acid. Amino acids with relative solvent accessibilities >0.2 were labeled as “surface,” whereas amino acids with relative solvent accessibilities <0.2 were labeled as “buried” (Chen and Zhou 2005).
Identification of interface positions
Four proteins in our data set had high-resolution PDB structures with peptide or nucleotide ligands, Gal4 (3COQ), BRCA1 RING domain (1JM7), PSD95 pdz3 domain (1BE9), and hYAP65 WW domain (1JMQ). We determined interface positions from the literature (Marmorstein and Carey 1992; Doyle et al. 1996; Fowler et al. 2010; Starita et al. 2015). The interface positions in hYAP65 WW domain were 188, 190, 197, and 199. The interface positions in BRCA1 RING domain were 11, 14, 18, 93, and 96. PSD95 pdz3 domain positions were 318, 322-327, 329, 339, 372, and 379. Gal4 interface positions were 9, 15, 17, 18, 20, 21, 43, 46, and 51.
Construction of receiver-operator characteristic (ROC) curves
We constructed empirical ROC curves to illustrate the power of each substitution to discriminate between interface and noninterface positions, determined as described above. First, we defined a discrimination threshold, such that positions with a mutational effect score below the threshold were classified “interface,” and positions with a mutational effect score above the threshold were classified as “noninterface.” For each substitution, we varied this discrimination threshold from the maximum mutational effect score to the minimum mutational effect score in 200 steps, calculating the true positive interface detection rate (TPR) and false positive interface detection rate (FPR) at each step. The TPR was calculated by dividing the number of interface positions with scores below the mutational effect threshold by the total number of interface positions. The FPR was calculated by dividing the number of noninterface positions with scores below the mutational effect threshold by the total number of noninterface positions. ROC curves were constructed by plotting the TPR and FPR for each of the 200 mutational effect thresholds. The area under each ROC curve was determined in R using the auc() function in the pROC package (https://cran.r-project.org/web/packages/pROC/pROC.pdf).
Data availability
The data sets used in this study came from a variety of published works (see Table 1). The curated data sets and code for generating figures can be found at https://github.com/FowlerLab/.
Results
Deep mutational scanning is a method that enables measurement of large numbers of mutational effect in a protein simultaneously (Fowler et al. 2010; Fowler and Fields 2014). Deep mutational scanning can be used to quantify the effects of all mutations at each position in a protein, and is therefore a conceptual extension of single amino acid scanning mutagenesis. The application of deep mutational scanning has resulted in an explosion of protein mutagenesis data (Fowler and Fields 2014). These large-scale mutagenesis data sets create the opportunity to assess relationships between the effects of different amino acid substitutions comprehensively.
We curated 16 large-scale mutagenesis data sets from published deep mutational scans of 14 proteins (Figure 1A and Table 1). Here, we included two distinct data sets for the BRCA1 RING domain and for UBI4 because mutations in these proteins were independently assayed for different protein functions (e.g., BRCA1 BARD1 binding and E3 ligase activity). Our collection of data sets is ideal for an unbiased analysis of the general effects of mutations because the mutagenized proteins are highly diverse, encompassing enzymes, structural proteins and chaperones from organisms ranging from bacteria to humans. The frequency of amino acids in the wild-type sequences of the 14 proteins was similar to amino acid frequencies in all known proteins (Magrane and UniProt Consortium 2011) (Figure 1B). For example, leucine (frequency = 11%) and alanine (8%) were the most frequently occurring wild-type amino acids in the 14 proteins, while tryptophan (<1%) was the rarest. However, the unbiased and massively parallel nature of deep mutational scanning experiments yielded a relatively uniform distribution of amino acid substitutions (Figure 1C). Furthermore, the data sets were generated by different laboratories at different times using different types of assays, reducing the chances of bias arising from specific experimental or analytical practices. Importantly, the assay formats used for the deep mutational scans included many commonly employed in single amino acid scanning like phage display and yeast two-hybrid. Collectively, these large-scale mutagenesis data sets comprised 34,373 nonsynonymous mutations at 2236 positions in the 14 proteins. The data sets contained effect scores for most mutations at each position. To facilitate comparisons between each data set, we rescaled mutational effect scores for each protein, using synonymous mutations to define wild-type-like activity, and the bottom 1% of mutations to define lack of activity (Figure S1A in File S1). Thus, each mutational effect score reflects the impact of the mutation, relative to wild type, with a score of zero meaning no activity, and a score of one meaning wild-type-like activity.
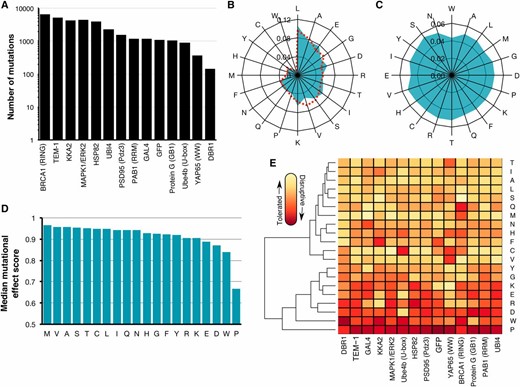
Large-scale mutagenesis data from 14 proteins. (A) The number of single amino acid mutations with effect scores in each of the 14 proteins is shown. (B) A radar plot shows the relative frequency of occurrence of each amino acid in the wild-type sequences of the 14 proteins (blue) or in 554,515 proteins in the UniProt Knowledgebase (Magrane and UniProt Consortium 2011) (dashed red). (C) A radar plot shows the relative frequency of each of the 20 amino acid substitutions in the large-scale mutagenesis data sets for all 14 proteins. (D) The median mutational effect score of each amino acid substitution is shown for 34,373 mutations at 2236 positions in all 14 proteins. (E) A heat map shows the median mutational effect score of each amino acid substitution for each protein separately. Yellow indicates tolerated substitutions while orange indicates disruptive substitutions. Amino acids and proteins were ordered according to similarity using hierarchical clustering with the hclust function from the heatmap2 package in R.
To validate the large-scale mutagenesis data, we examined expected patterns of mutational effect. For example, mutations to proline should generally disrupt protein function, as proline restricts the conformation of the polypeptide backbone and eliminates the amide hydrogen necessary for hydrogen bonding. Indeed, proline substitutions were overwhelmingly more disruptive than other substitutions to protein function (Figure 1D and Figure S1B in File S1). In fact, proline was the most disruptive substitution in 11 of 14 proteins, and second most disruptive in the remaining three proteins (Figure 1E). Additionally, as expected from the Dayhoff (Dayhoff 1978), Blosum (Henikoff and Henikoff 1992), and Grantham (Grantham 1974) substitution matrices, tryptophan tended to be deleterious. Methionine was the best-tolerated substitution, and therefore may be useful for identifying the most immutable protein positions. Interestingly, mutations to alanine, which is commonly employed in scanning mutagenesis, were better tolerated than many other substitutions. Other substitutions were also well tolerated, with seven different amino acids appearing as the most tolerated across the 14 proteins (Figure 1, D and E). Tolerance to substitutions depends on structural context, so the variability in the best-tolerated substitution might be due to diversity in the structural composition of each protein in our data set. Thus, the large-scale mutagenesis data sets we collected generally recapitulated our expectations about the effects of mutations, despite coming from 14 distinct proteins that were each assayed independently.
Next, we determined which amino acid substitution best represented the effects of all other substitutions. To avoid bias arising from missing data, we restricted this analysis to the 882 positions in the 14 proteins with measured effects for all 19 possible substitutions. We calculated the median mutational effect at each of these 882 positions. Overall, the median effects across these positions were mildly disruptive, with a mean of 0.82 (stop ∼0, wild type ∼1). We found that the effects of phenylalanine, glycine, histidine, isoleucine, leucine, asparagine, glutamine, and tyrosine substitutions were all indistinguishable from the median effects (Figure 2A and Table S1). However, proline, aspartic acid and tryptophan substitutions were much more disruptive than the median substitution. Alanine, cysteine, methionine, serine, threonine, and valine were considerably less disruptive than the median substitution. These well-tolerated amino acid substitutions might be useful for detecting the most mutationally sensitive positions in a protein, but they are not especially representative of the effects of other substitutions.
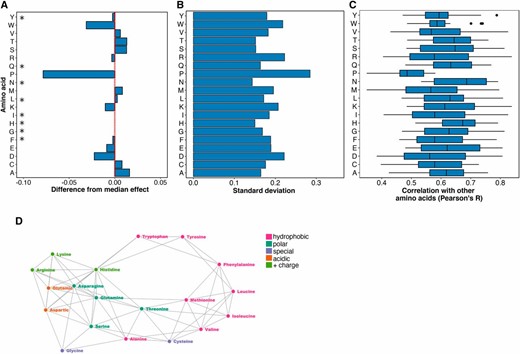
Histidine and asparagine substitutions best represent the effect of other substitutions. (A) For each of the 882 positions where the mutational effects of all 19 substitutions were measured, the difference from the median effect was calculated for each substitution at each position. The median of these differences across all positions for each substitution is shown, with the red line indicating a median difference of zero. A paired, two-sided Wilcoxon rank sum test was used to determine whether each substitution’s difference from the median effect across all positions was equal to zero (* indicates substitutions with a Bonferroni-corrected P-value > 0.01; Table S1). (B) The SD of each substitution’s differences from the median effect at the 882 positions where the mutational effects of all 19 substitutions were measured is shown. (C) For each substitution, Pearson correlation coefficients were calculated for the mutational effects of that substitution with every other substitution at each position. The distribution of correlation coefficients for each substitution is shown. (D) These pairwise mutational effect score correlations are also illustrated using a force directed graph. Each node represents an amino acid and each edge force value is the Pearson correlation coefficient for the mutational effect scores of the two amino acid substitutions connected by the edge. To reduce the density of edges, only the top 40% of Pearson correlation coefficients were included. This cutoff removed proline from the graph. Amino acids are colored by physicochemical type. The graph was constructed using the networkD3 package in R.
We also examined the dispersion of each amino acid’s mutational effect about the median at all 882 positions, reasoning that representative substitutions would have minimal dispersion. Of substitutions whose effects were indistinguishable from the median effect, histidine and asparagine have the smallest dispersion (SD = 0.15 and 0.14, respectively; Figure 2B), while tyrosine (0.18), glutamine (0.16), phenylalanine (0.19), glycine (0.17), leucine (0.17), and isoleucine (0.19) all had larger dispersions. Thus, of all possible substitutions, histidine and asparagine tended to have effects closest to the median effect at the 882 positions we examined.
Next, we investigated the influence of the wild-type amino acid on the effect of each substitution at all 882 positions. Wild-type amino acid frequencies differed, so the number of mutations for each wild-type amino acid also varied. For example, we observed 1786 mutations at 94 positions where leucine was the wild-type amino acid and 114 mutations at six tryptophan positions. We found that tryptophan positions were the most sensitive to mutation (median effect = 0.48 at Trp positions), while glutamine positions were the least sensitive (median effect = 0.99 at Gln positions). For each substitution and wild-type amino acid pair, we subtracted the median effect of all substitutions at positions with the wild-type amino acid (Figure S2A in File S1) from the median effect of the substitution at those positions. A difference greater than zero denoted a substitution that was more tolerated than the median substitution for that wild-type amino acid, while a difference less than zero denoted a more disruptive substitution.
Hierarchical clustering of wild-type amino acids based on these differences revealed two major classes (Figure S2B in File S1). The first class included large hydrophobic amino acids, which were more sensitive to substitutions, while the second class included charged and polar amino acids, which were less sensitive to substitutions (Figure S2A in File S1). We found that some substitutions, including histidine and asparagine, had effects close to the median substitution for most wild-type amino acids (Figure S2C in File S1). However, histidine substitutions were less disruptive than the median substitution when the wild-type amino acid was tryptophan or tyrosine, and more disruptive than the median substitution when the wild-type amino acid was methionine or cysteine. Meanwhile, asparagine substitutions were less disruptive when the wild-type amino acid was histidine, and more disruptive when the wild-type was methionine. Other substitutions had more variable effects across different wild type amino acids. Thus, histidine and asparagine best represent the median mutational effect across most wild-type amino acids.
Because of the comprehensive nature of the large-scale mutagenesis data sets, we could ask how well the mutational effect scores of each substitution correlated with the scores of every other substitution at each position. Thus, we calculated Pearson correlation coefficients for the mutational effect scores of each substitution pair across all positions (Figure 2C and Figure S3 in File S1). The effects of histidine and asparagine substitutions correlated best with the effects of all other substitutions, while the effect of proline substitutions correlated worst. To visualize the relationships between each pair of substitutions, we constructed a force-directed graph (Figure 2D). As expected, substitutions cluster by physicochemical type in the graph, meaning that similar substitutions have similar effects. Proline is not represented because its effects are poorly correlated with other substitutions. Histidine and asparagine are connected to many other amino acids, owing to the high correlation of the effects of these substitutions with many other substitutions.
We next asked whether the secondary structural context of a position altered the effect of each substitution. We excluded DBR1 and GB1 from this analysis because they did not have structures of sufficiently close homologs. We used DSSP to identify 1007 positions in the remaining proteins that were in an α-helix, a β-sheet or a turn (Kabsch and Sander 1983). Overall, substitutions in turns were less disruptive than substitutions in α-helices or β-sheets (Figure 3A). However, the relative effects of each substitution in the three structural contexts were mostly consistent, especially between α-helices and β-sheets (Figure 3B and Figure S4A in File S1). Surprisingly, the tolerance for each amino acid substitution in the different secondary structural contexts was not strongly correlated with the frequency of that amino acid’s occurrence in known structures (Costantini et al. 2006). For example, alanine occurs more frequently in α-helices, relative to β-sheets. However, in our large-scale mutagenesis data sets, alanine substitutions were mildly disruptive in both structural contexts. These observations suggest that secondary structure does not dominate mutational tolerance, at least for the proteins we examined.
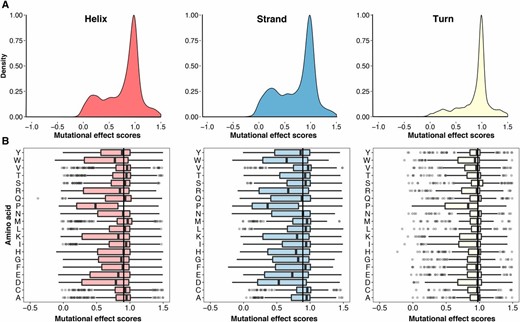
Secondary structural context of mutational effects. (A) Density plots describing the distribution of mutational effect scores for each substitution are shown for three different structural contexts as determined using DSSP: α-helices (left panel, N = 8669), β-sheets (middle panel, N = 4796), and turns (right panel, N = 3329). (B) The mutational effect score distributions for each substitution in α-helices (left panel), β-sheets (middle panel), and turns (right panel) are shown. The vertical line in each panel represents the median effect score for all substitutions in that secondary structure type.
We next investigated which substitutions were the most representative regardless of structural context. We found that histidine substitutions have close to the median effect in α-helices and turns, but were more disruptive than the median effect in β-sheets (Figure 3B). Asparagine and glutamine substitutions had near median effects in all three contexts. As above, we examined how well the effects of each substitution correlated with every other substitution at each position in each context. We found that the effects of histidine, asparagine, and glutamine substitutions correlated best with the effects of other substitutions (Figure S4, B and C in File S1). Thus, the effects of histidine, asparagine, and glutamine are relatively consistent in the different structural contexts we examined, highlighting the representativeness of these substitutions.
An important use of single amino acid scanning is to identify positions in protein-ligand interfaces. In order to determine which substitution is ideal for that purpose, we analyzed the effects of substitutions in four proteins with ligand-bound structures: the hYAP65 WW domain, the PSD95 pdz3 domain, the BRCA1 RING domain, and GAL4. Among these four proteins there were 4884 mutations at 282 positions. We used relative solvent exposure to classify each position as either buried or on the surface. We also determined interface positions based on published structures and functional studies (see Materials and Methods). We found that substitutions at interface positions were substantially more disruptive than substitutions at buried, noninterface, or surface noninterface positions (Figure 4A). This result was expected, given that all four deep mutational scans were conducted using selections that depended on ligand binding. Alanine, along with phenylalanine, isoleucine, and methionine, are the least disruptive amino acid substitutions at interface positions, suggesting that they may not be ideal for interface detection.
![Asparagine, glutamine, aspartic acid, and glutamic acid are best for identifying positions in protein–ligand interfaces. (A) The distribution of mutational effect scores for every substitution in four proteins with ligand-bound structures [hYAP65 WW domain, PSD95 pdz3 domain, BRCA1 RING domain (BARD1 binding) and Gal4] is shown at ligand interface positions as reported in the literature, and for noninterface buried positions or noninterface surface positions. (B) A mutational effect threshold was defined such that positions with a mutational effect below the threshold were classified as “interface,” whereas positions with a mutational effect above the threshold were classified as “noninterface.” ROC curves for each amino acid were generated by varying this threshold. The area under each ROC curve is shown, illustrating the power of each substitution to discriminate between interface and noninterface positions.](https://oup.silverchair-cdn.com/oup/backfile/Content_public/Journal/genetics/207/1/10.1534_genetics.117.300064/9/m_53fig4.jpeg?Expires=1716415037&Signature=Zm1XoLnsyBGBpgFBMl6GOvhcF61fJ5psBGkkXbYaXbmBcqXmMOGnoQ47qYgbpWlb94-mrqb0P9vZgQ10pRY3Ps4KeswKvJpyyXAIpWyHMFC~Xd30RS9pfjCkyo2NlBtozWHGOOsKsf2DCHuvf6j65AV6c-M8lqQ3Uiw-yI9YRjfZswCh2P2cWalumW20sUxB93Nxv1HoL2klJWYTGc9W1eyV7eN9-r2zTaSqWtY0iA1T2Fqia1A43HWUXCIENzZpH9y59AstVGOhCkctjrA2Q8-uXyaoLHs1l7cn1ZfX9ACKZynJDLutyBsrugtLkfNi1yrxbGhpLGHVFB0OiQ6-mA__&Key-Pair-Id=APKAIE5G5CRDK6RD3PGA)
Asparagine, glutamine, aspartic acid, and glutamic acid are best for identifying positions in protein–ligand interfaces. (A) The distribution of mutational effect scores for every substitution in four proteins with ligand-bound structures [hYAP65 WW domain, PSD95 pdz3 domain, BRCA1 RING domain (BARD1 binding) and Gal4] is shown at ligand interface positions as reported in the literature, and for noninterface buried positions or noninterface surface positions. (B) A mutational effect threshold was defined such that positions with a mutational effect below the threshold were classified as “interface,” whereas positions with a mutational effect above the threshold were classified as “noninterface.” ROC curves for each amino acid were generated by varying this threshold. The area under each ROC curve is shown, illustrating the power of each substitution to discriminate between interface and noninterface positions.
We reasoned that the ideal substitution for detecting protein–ligand interfaces would exhibit a large difference in mutational effect between interface and noninterface positions. To formalize this idea, we used a mutational effect threshold. If a substitution at a particular position had a mutational effect below the threshold, we classified that position as “interface.” Conversely, if the mutational effect was above the threshold that position was classified as “noninterface.” For each substitution, we varied the mutational effect threshold from the maximum mutational effect score to the minimum effect in 200 steps. At each step, we compared the true interface positions to those determined using the mutational effect threshold procedure. We then constructed ROC curves. The area under each ROC curve revealed the ability of that substitution to discriminate between true interface and noninterface positions. We found that isoleucine, lysine, and alanine had the worst discriminatory power (Figure 4B and Figure S5 in File S1). Substitutions that were highly disruptive at interfaces, like asparagine, glutamine, aspartic acid, and glutamic acid, had the best discriminatory power. Next, we calculated the fraction of true interface positions detected by each amino acid substitution at a 5% false positive rate. Here, we found that asparagine and glutamine substitutions revealed over 60% of the true interface positions; aspartic acid and glutamic acid substitutions also performed well (Figure S6 in File S1). However, alanine substitutions detected <20% of the true interface positions at a 5% false positive rate. Thus, asparagine, glutamine, aspartic acid, or glutamic acid substitutions are all good choices for detecting protein–ligand interfaces.
Discussion
Single amino acid scanning mutagenesis is a widely used method for identifying protein positions that are important for function or ligand binding. Alanine is often employed, and was selected on rational grounds as it constitutes a deletion of the side chain at the β-carbon. By analyzing tens of thousands of mutations in 14 proteins, we have determined that alanine is not necessarily the most revealing substitution. For example, histidine and asparagine substitutions have an effect close to the median, and these substitutions correlate best with the effects of all other substitutions. Thus, they best represent the effects of mutations generally. Asparagine, glutamine, aspartic acid, and glutamic acid substitutions are highly disruptive at ligand interfaces, and are consequently the most useful substitutions for detecting ligand interface positions.
However, our conclusions are based on only 14 proteins. While these proteins are diverse in structure and function, they may not fully reflect the mutational propensities of other proteins. For example, tryptophan scanning mutagenesis is often applied to transmembrane domains (Sharp et al. 1995; Depriest et al. 2011; Rasmussen et al. 2015), which were absent from the proteins we analyzed. Thus, our conclusions are most applicable to soluble proteins. Furthermore, we do not address specialized applications of single amino acid scanning mutagenesis. For example, cysteine scanning mutagenesis has been used to introduce disulfide bridges (Kanaya et al. 1990) and glycine scanning mutagenesis has been used to increase conformational flexibility (Weinglass et al. 2001). Our conclusions do not apply to these situations. Finally, the deep mutational scanning data we analyzed arises from genetic selections for protein function. Biochemical assays might reveal different patterns. However, we note that a few of the large-scale mutagenesis data sets we used were benchmarked against and found to be consistent with biochemical assay results (McLaughlin et al. 2012; Olson et al. 2014).
Deep mutational scanning can reveal the functional consequences of all possible single amino acid substitutions in a protein. However, these experiments can be expensive or unwieldy. Therefore, scanning mutagenesis with one or a few amino acids will remain useful for determining functionally important positions, probing protein–ligand interactions, and answering other specific questions. Our results can be used to guide future single amino acid scanning mutagenesis experiments, enabling selection of the amino acid best suited for the goals of the experiment.
Acknowledgments
We thank Lea Starita for helpful discussions and advice. This work was supported by the National Institute of General Medical Sciences (1R01GM109110 to D.M.F.). V.E.G. is a National Science Foundation Graduate Research Fellow (DGE-1256082) and R.J.H. is a Damon Runyon Cancer Research Foundation Fellow (DRG-2224-15).
Author contributions: D.M.F. conceived of the project. V.E.G. and R.J.H. curated and rescaled the data sets. V.E.G. and D.M.F. analyzed the data and wrote the paper.
Footnotes
Supplemental material is available online at www.genetics.org/lookup/suppl/doi:10.1534/genetics.117.300064/-/DC1.
Communicating editor: M. Johnston
