


Abstract
We used microarrays and a previously established linkage map to localize the genetic determinants of brain gene expression for a backcross family of lake whitefish species pairs (Coregonus sp.). Our goals were to elucidate the genomic distribution and sex specificity of brain expression QTL (eQTL) and to determine the extent to which genes controlling transcriptional variation may underlie adaptive divergence in the recently evolved dwarf (limnetic) and normal (benthic) whitefish. We observed a sex bias in transcriptional genetic architecture, with more eQTL observed in males, as well as divergence in genome location of eQTL between the sexes. Hotspots of nonrandom aggregations of up to 32 eQTL in one location were observed. We identified candidate genes for species pair divergence involved with energetic metabolism, protein synthesis, and neural development on the basis of colocalization of eQTL for these genes with eight previously identified adaptive phenotypic QTL and four previously identified outlier loci from a genome scan in natural populations. Eighty-eight percent of eQTL-phenotypic QTL colocalization involved growth rate and condition factor QTL, two traits central to adaptive divergence between whitefish species pairs. Hotspots colocalized with phenotypic QTL in several cases, revealing possible locations where master regulatory genes, such as a zinc-finger protein in one case, control gene expression directly related to adaptive phenotypic divergence. We observed little evidence of colocalization of brain eQTL with behavioral QTL, which provides insight into the genes identified by behavioral QTL studies. These results extend to the transcriptome level previous work illustrating that selection has shaped recent parallel divergence between dwarf and normal lake whitefish species pairs and that metabolic, more than morphological, differences appear to play a key role in this divergence.
UNDERSTANDING the genetic basis of adaptation is a central goal of evolutionary biology (Orr and Smith 1998; Orr 2005a). Populations that diverge to exploit alternative ecological resources are well suited for examining the genetic basis of adaptive evolutionary change (Skúlason and Smith 1995; Ayala and Fitch 1997; Howard 1998). Reduced competition and distinct niches have created conditions where directional selection has led to speciation, particularly in temperate northern lakes (Robinson and Schluter 2000; Landry et al. 2007). A forward genetic approach (from phenotype to genotype) has been used in these systems to elucidate the genetic basis of adaptive phenotypes (e.g., Foster and Baker 2004). Under this approach, QTL studies have been used to understand the genetic architecture of adaptive traits by examining the number, magnitude, and direction of underlying loci (Peichel et al. 2001; Rogers and Bernatchez 2007). Genome scans involving loci associated with QTL and a large number of loci randomly distributed throughout the genome have then been used to test adaptive hypotheses regarding QTL in the divergent populations (Rogers and Bernatchez 2007).
The genetics of global gene expression, and particularly the analysis of the genetic architecture of transcriptome variation, offers to further our understanding of the mechanistic basis of adaptive divergence (Rockman and Kruglyak 2006; Roff 2007). Expression QTL (eQTL) studies treat transcript abundance as a quantitative trait and apply traditional QTL mapping techniques to localize genetic determinants of gene expression. To date, eQTL studies have focused on model organisms (Brem et al. 2002; Schadt et al. 2003; Morley et al. 2004; Bystrykh et al. 2005; Chesler et al. 2005; Hubner et al. 2005; Li et al. 2006; Shi et al. 2007; West et al. 2007), with few applications to non-model organisms (but see Kirst et al. 2005). In addition to insights gained on the number, magnitude, direction, and genome distribution of loci underlying transcription, several studies have compared genomic eQTL locations with traditional organismal-level phenotypic QTL (hereafter phenotypic QTL) to locate candidate genes underlying these traits (Schadt et al. 2003; Bystrykh et al. 2005; Chesler et al. 2005; Hubner et al. 2005; Wentzell et al. 2007). This approach falls within the emerging field of phenomics, defined as the study of the nature of phenotypes and how they are determined, particularly when studied in relation to the set of all genes (genomics) or all proteins (proteomics). In an evolutionary context, this approach provides a powerful, yet untested, framework for examining transcriptional underpinnings of population divergence and how selection shapes the phenome (the complete phenotypic representation of a species; Freimer and Sabatti 2003).
Analysis of the genetic architecture of the brain transcriptome in systems undergoing adaptive divergence not only can identify genes involved in adaptive evolution but also can help to elucidate the role of behavior in adaptive radiation. A mechanistic link between gene expression in the brain and behavior is well supported (Bucan and Abel 2002; Rankin et al. 2002; Robinson et al. 2005; Toth and Robinson 2007). While transcript abundance is not always predictive of protein abundance and some differences in gene expression are a consequence, not a cause, of a behavioral change, as a first approximation, it is reasonable to assume that neural transcriptome variation is directly or indirectly associated with behavioral differences (Aubin-Horth et al. 2005a, 2007; Robinson et al. 2005). Thus, studies of genetic architecture of the brain transcriptome in systems where populations are adaptively diverging can be used not only to test hypotheses related to the effects of selection on the transcriptome but also to reveal candidate genes and the genetic basis of behaviors important for adaptive radiation.
eQTL analyses can also be used to understand differences between sexes in the genetic architecture of transcription regulation, an aspect of adaptive population divergence that has rarely been addressed. Changes in sex-biased gene expression are likely to be a major contributor to adaptive phenotypic divergence between species (Ellegren and Parsch 2007). Sex-biased gene expression is widespread (Ellegren and Parsch 2007) and there is growing evidence for adaptive evolution of sex-biased genes not only at the level of coding sequence, but also at the level of gene expression (Meiklejohn et al. 2003; Khaitovich et al. 2005). eQTL analyses provide an opportunity to compare the genome distribution of the genetic determinants of gene expression between sexes in particular tissues, thus adding to our understanding of the genetic underpinnings of adaptive evolutionary change.
Sympatric dwarf (limnetic) and normal (benthic) species pairs of the lake whitefish (Coregonus sp.) provide a case of recent adaptive radiation that is well suited for investigating the genetic architecture of gene transcription. Geographic isolation during the Pleistocene led to genetic divergence between whitefish populations inhabiting distinct glacial refugia (Bernatchez and Dodson 1990; Pigeon et al. 1997; Lu et al. 2001). Secondary contact of these evolutionary lineages subsequently occurred ∼12,000 YBP (years before present) within at least six lakes in northeastern North America. Both ecological opportunity and character displacement have contributed to the evolution of a limnetic dwarf species, which has diverged in sympatry from the ancestral benthic normal species (Bernatchez 2004; Landry et al. 2007). Adaptive trait differences between dwarf and normal whitefish are supported by genetically based phenotype–environment associations for behavior (Rogers et al. 2002), growth (Trudel et al. 2001; Rogers and Bernatchez 2005), morphology (Lu and Bernatchez 1999; Bernatchez 2004), and gene expression (Derome et al. 2006; St-Cyr et al. 2008). The dwarf whitefish has a higher metabolic rate, partly associated with the cost of more active swimming behavior (higher position in water column, direction changes, burst swimming), and a lower bioenergetic conversion efficiency (growth rate/consumption rate ratio), associated with slower growth and younger age at sexual maturity (Trudel et al. 2001) when compared to normal whitefish (Rogers et al. 2002; Rogers and Bernatchez 2007). Rogers et al. (2007) and Rogers and Bernatchez (2007) used linkage mapping to document the number and effects of QTL involved in controlling these adaptive traits. In addition, genome scans performed in natural populations provided evidence that directional selection is maintaining genetic divergence between sympatric dwarf and normal whitefish by restricting gene flow at more than half of these adaptive QTL (Rogers and Bernatchez 2005, 2007). Finally, functional genomic studies performed in these same natural populations on white muscle and liver tissue provided strong indirect evidence for the role of selection in the evolution of differential regulation of genes involving a vast array of potentially adaptive physiological processes between dwarf and normal whitefish (Derome and Bernatchez 2006; St-Cyr et al. 2008). These studies also provided a first mechanistic, genomic basis for the observed trade-off in life-history traits distinguishing dwarf and normal whitefish species pairs, wherein enhanced survival via more active swimming, necessary for increased foraging and predator avoidance, incurs energetic costs that translate into slower growth rate and reduced fecundity in dwarf relative to normal whitefish. The weight of current evidence indicates that accumulation of genetic differences during the allopatric phase of geographic isolation as well as ecological divergence that subsequently occurred in sympatry have led to reproductive isolation between dwarf and normal whitefish species pairs (Lu and Bernatchez 1998; Rogers and Bernatchez 2006).
The objective of this study was to elucidate the genomic distribution and sex specificity of brain eQTL in dwarf and normal whitefish to test if neural eQTL associate with adaptive phenotypic QTL and regions of the genome under selection. We used individuals from the same F1 hybrid × dwarf backcross (BC) used in Rogers et al. (2007) to perform a eQTL analysis of brain transcription. We tested (i) for an association between previously identified phenotypic QTL (Rogers and Bernatchez 2007) and neural eQTL to determine if brain transcription underlies previously identified adaptive traits, (ii) for an association between outlier loci from a genome scan and neural eQTL as a test for the influence of selection on the neural transcriptome, and (iii) for eQTL of transcripts that are also differentially expressed between parental dwarf and normal progeny (issued from grandparents of the backcross family and raised under controlled conditions) to provide further evidence that eQTL are associated with gene expression divergence due to directional selection in whitefish.
MATERIALS AND METHODS
Experimental crosses:
In 1996, dwarf whitefish from Témiscouata Lake, Québec (Acadian glacial lineage), and normal whitefish from Aylmer Lake, Québec (Atlantic glacial lineage), were used to create pure (nonhybrid) dwarf, pure normal, and F1 hybrid crosses (for details see Lu and Bernatchez 1998). In 1999, F2 pure individuals from each parental line were created along with a backcross line generated by crossing an F1 hybrid female with an F1 dwarf male (hybrid♀ × dwarf♂). We used these BC progeny for eQTL analyses. BC individuals were euthanized in January 2003 and stored at −80°. For the comparison of gene expression in pure dwarf and normal whitefish, we sampled 16 randomly selected same-aged F2 individuals of each pure line [dwarf mean length (±SD) = 23.1 ± 2.1 cm; normal mean length (±SD) = 28.2 ± 2.4 cm] in September 2004. All lines were maintained under the same environmental conditions in the Laboratoire Régional des Sciences Aquatiques animal facility at Université Laval.
Whitefish linkage map and phenotypic QTL analysis:
The detailed results pertaining to both the whitefish linkage map and phenotypic QTL analyses are presented in Rogers et al. (2007) and Rogers and Bernatchez (2007), respectively. In brief, a total of 198 backcross progeny were genotyped at 389 AFLP and 23 microsatellite loci. Linkage groups and marker orders were first determined in MAPMAKER/EXP (Lander et al. 1987). The map consisted of a total of 37 sex-specific linkage groups (LG)—of the 40 that exist in lake whitefish—with a mean distance between markers of 17.5 cM (Rogers et al. 2007). These linkage groups and marker orders showed a high degree of colinearity, with >83% of the loci mapping to the same location and linkage groups in a second, independent hybrid backcross family (Rogers et al. 2007).
Nine phenotypes, including traits for swimming behavior (directional changes, activity level, burst swimming, and depth preference), growth, condition factor (a ratio of length to weight in fish), the number of gill rakers (cartilaginous feeding sieves), and two aspects of life history were analyzed for QTL. Between 1 and 7 significant QTL were detected for each of the nine traits for a total of 24 QTL over all traits (Rogers and Bernatchez 2007). Genetic differentiation of loci associated with these QTL has been examined in four replicate natural species pairs to test for effects of natural selection on loci closely associated with adaptive phenotypic QTL (Rogers and Bernatchez 2007). A total of 440 polymorphic loci were examined in four population pairs (Campbell and Bernatchez 2004). Of these 440 loci, 180 were homologous with our genetic map. These 180 loci were distributed over 92% (34 of 37) of the linkage groups. Overall, a total of 33 of these loci were associated with phenotypic QTL and 19 loci exhibited significant evidence of reduced gene flow (i.e., signatures of selection) between natural dwarf and normal populations (Rogers and Bernatchez 2007). These results provide a unique template to further test for eQTL segregating within the same genetic map and to test for associations with signatures of selection in nature.
RNA isolation, labeling, and hybridization:
Individuals were stored at −80° until RNA was extracted. Whole brains were dissected and RNA was extracted following the Trizol reagent protocol (Gibco BRL). RNA was quantified with a GeneQuant spectrophotometer (Pharmacia). RNA quality and quantity were also determined with a 2100 Bioanalyzer (Agilent).
We performed reverse transcriptase PCR with 15 μg of total RNA per sample following the SuperScript II reverse transcriptase protocol (Invitrogen Life Technologies). cDNA fragments generated by this protocol were indirectly labeled by first annealing dye-specific dendromers to the cDNA from each individual. cDNA was pooled prior to the first hybridization to a microarray chip. Cy3 and Alexa 647 dyes were then hybridized to the dendromers in a second hybridization to the microarray following the Array 50 kit protocol (Genisphere).
Transcriptome profiles were obtained with a 16,006 cDNA microarray (version 2.0) developed for the Atlantic salmon (Salmo salar) by the consortium for Genomic Research on All Salmonids Project (cGRASP; Rise et al. 2004) and successfully tested and applied to other salmonid species, including Coregonus clupeaformis (Derome and Bernatchez 2006; Derome et al. 2006; Rise et al. 2007; St-Cyr et al. 2008). Gene identification with the corresponding EST sequence can be found at http://web.uvic.ca/cbr/grasp/.
We inferred transcript levels by quantifying fluorescence levels with a ScanArray Express scanner (Packard Bioscience). Spot location and quantification were performed with the QuantArray (Perkin Elmer) software. We used the adaptive circle spot quantification method, which calculates the mean intensity value for each spot. Aberrant spot signals were removed before analysis. We estimated values of removed spots with the “row average imputer” function implemented in SAM software (Tusher et al. 2001). Genes considered significantly expressed had mean intensity for both dyes greater than the mean intensities of the empty spot controls plus 2.5 × SD (Williams et al. 2006). Genes below this threshold were removed from further analysis. The raw data set is available on the Gene Expression Omnibus website (http://www.ncbi.nlm.nih.gov/geo/) (accession GSE12068).
Experimental design and statistical analyses:
For the comparison of gene expression between parental lines, we used a paired design (Churchill 2002) to hybridize reverse-transcribed RNA from a randomly chosen group of eight fish of each dwarf and normal line. Potential bias associated with variation in fluorophore intensity was minimized by swapping the Cy3 and Alexa 647 dyes (Churchill 2002). Raw values of all “expressed” transcripts were first log2 transformed, normalized with the rlowess regional correction, and subsequently analyzed with a mixed analysis of variance (ANOVA) model in R/MAANOVA (Wu et al. 2003). In this model, sample and dye were fixed effects and array was a random effect. We used the variety-by-gene term (VG) in the model of Cui and Churchill (2003) to capture variation in expression level of each gene across individuals and to obtain mean estimates of expression levels for each parental line. A permutation-based F-test (F3) was performed with 1000 permutations to test for species pair-specific differences in gene expression.
For backcross progeny used in eQTL mapping, we used a loop design (Churchill 2002) to maximize the number of sampled meioses while technically replicating each sample with each of the two dyes (Cy3 and Alexa 647). The loop design allows for an efficient balance between analyzing a large number of individuals while still allowing technical replication (Kirst et al. 2005). Again, raw values of all expressed transcripts were log2 transformed, normalized with the rlowess regional correction, and analyzed with a mixed ANOVA model in R/MAANOVA (Wu et al. 2003). Sample and dye were again fixed effects and array was a random effect. The variety-by-gene term (VG) in the model of Cui and Churchill (2003) was used to capture variation in expression level of each gene across individuals for subsequent QTL analyses. After removing negative controls and, due to technical inconsistencies, data from the last subarray (1444 transcripts from the 12th meta-row on each microarray), we examined gene expression among BC progeny for a total of 14,968 transcripts.
As part of our first objective, we created sex-specific subsets of the BC expression data to test for differences in eQTL effects between males and females. BC fish were sexually mature when sampled, and consequently expression differences and resulting eQTL observed in the combined BC data set could have been influenced by sex. We created female-only (N = 32) and male-only (N = 25) subsets of the expression data to test for a sex bias of eQTL. With the same mixed ANOVA model in R/MAANOVA (Wu et al. 2003) as described above, we performed a permutation-based F-test (F3) with 1000 permutations to test for sex-specific differences in gene expression. We extracted mean variety-by-gene terms (VGs) for each sex for subsequent eQTL analyses (female-only and male-only data sets).
eQTL detection:
Gene expression values were used as the phenotypes along with the linkage map to perform a genomewide QTL detection scan for each transcript with the UNIX version of QTL Cartographer (Basten et al. 2002). This analysis was performed separately on the combined, female-only, and male-only data sets. We used the Kosambi map function because of the effects of crossover interference that occurs in salmonids (Rogers and Bernatchez 2007). We used interval mapping (IM; model 3 of the Zmapqtl module) for QTL detection. Likelihood-ratio (LR) profiles [−2ln(L0/L1)] were generated for each transcript at every 2-cM interval of the hybrid♀ × dwarf♂ map with a window size of 10 cM. Three empirical thresholds for genomewide type I error rates (0.1, 0.05, and 0.01) were determined for all eQTL that we significantly expressed by recording the 10th, 50th, and 100th ranked LR of 1000 random permutations. We developed a PYTHON script for the UNIX version of QTL cartographer to automatically run iterations among traits. This script requires a user-defined parameter file containing the list of traits to be analyzed, the number of iterations, the number of iterations for each trait (here 1000), and the percentile values to be sampled (here 90th, 95th, and 99th). The PYTHON script records the parameter values and calls the different QTL cartographer programs, including Rmap (reads the map), Rcross (reads the cross), and Zmapqtl (runs an association analysis between traits and markers). For each trait (transcript), both during and following each iteration, a function reads the output from Zmapqtl and records the GlobalMax values at each desired fixed percentile. The script is available from the authors upon request.
To visualize the genomic distribution of eQTL associations, we divided the genome into 17.6-cM bins, corresponding to the average distance between markers for male and female maps (Rogers et al. 2007), resulting in a total of 366 bins. We assumed a Poisson distribution to calculate the probability of observing a given number of significant eQTL within a bin, following Brem et al. (2002). The mean of the Poisson distribution for each data set was estimated as 366 bins/number of eQTL linkages at a genomewide α = 0.05.
Transcript annotations correspond to EST library annotations of Rise et al. (2004), with updates available on the cGRASP web page: http://web.uvic.ca/cbr/grasp/. Significant eQTL were assigned to biological process categories with the AMIGO browser of Geneontology (http://www.geneontology.org), the KEGG PATHWAY database (http://www.genome.jp/kegg/pathway.html), and the UniProt database (http://www.expasy.uniprot.org/), along with additional literature searches. For the same subset of transcripts showing significant linkages, transcripts classified by Rise et al. (2004) as unknown were submitted to BLAST nucleotide and translated protein searches to determine if new gene identifications were possible. Some annotations by Rise et al. (2004) appeared to be in error due to repetitive regions within clones. These transcripts were reclassified as unknown.
Effects of sequence variation on microarray hybridization dynamics:
Cross-hybridization is known to potentially cause problems for spotted cDNA microarrays because sequence polymorphisms between strains or paralogous genes may affect the signal for certain transcripts (Hubner et al. 2005). In this study, we used a predominantly Salmo-based microarray to assay gene expression for a member of Coregonus, because the genera Salmo and Coregonus belong to the family Salmonidae. However, we did not compare Salmo to Coregonus transcripts; rather, we compared expression levels among individuals from a backcross family of whitefish species pairs that diverged <12,000 YBP (Bernatchez and Dodson 1990). Overall genetic differentiation between dwarf and normal populations may be very low and driven only by ecological selection pressures (Lu and Bernatchez 1999), and these young species still exchange genes where they occur in sympatry (Campbell and Bernatchez 2004). Even though they are considered incipient species, differences in hybridization dynamics due to sequence variation between dwarf and normal whitefish transcripts might be on the order of magnitude of what would be expected for closely related populations. Hence, sequence divergence between different alleles is expected to be small with respect to this study. Nevertheless, we used two approaches to evaluate possible effects of sequence variation on our microarray expression data.
First, we used quantitative real-time PCR to confirm microarray results for two brain transcripts (β-globin and a G-protein) that were significantly differentially expressed between the pure dwarf and normal parental lines (J. St-Cyr, unpublished data). cDNA from eight lake whitefish (four normal, four dwarfs) was amplified using primers designed from transcripts on the microarray. These whitefish sequences were used to design TaqMan probes with Primer Express 2.0 (Applied Biosystems). Target cDNAs were amplified in triplicate by real-time PCR with an Applied Biosystems PRISM 7000 thermocycler (Perkin Elmer). We normalized expression levels to 18S rRNA expression with the comparative CT method.
Second, we analyzed sequence polymorphism in dwarf and normal whitefish for 68 transcripts for which we detected gene expression with the salmon microarray. Thirty-six of these transcripts had significant eQTL either in this study or in a companion study of muscle eQTL in the same backcross family (Derome et al. 2008). Sequence data were generated from primers based on transcript sequences on the microarray and these primers were used to amplify the corresponding genes from genomic DNA. Initially, we verified for a subset of 10 genes that PCR amplification was possible from individual samples of both dwarf and normal whitefish. Additional genes were amplified and sequenced from pooled genomic DNA originating from multiple dwarf and normal populations of whitefish with the goal of including as much sequence variance as possible. Rare alleles may escape visual inspection of the electropherograms of sequences from pooled amplicons; however, high-frequency single nucleotide polymorphisms (SNPs) or other polymorphisms, which are of interest with respect to this study, can be detected reliably. We quantified the number of SNPs present in genomic DNA among dwarf and normal whitefish for each of the 68 transcripts. We also compared the distribution of SNPs for transcripts with and without significant eQTL to test the hypothesis that levels of polymorphism may differ between both groups of transcripts. If sequence variation between dwarf and normal whitefish were extensive, differential hybridization dynamics could bias expression data and lead to false-positive eQTL. More SNPs in transcripts with significant eQTL would suggest that our eQTL methodology was sensitive to expression artifacts caused by these SNPs. Alternatively, an observation of few SNPs, particularly in the transcripts for which we detected significant eQTL, would suggest a small likelihood of biased expression data resulting from differential hybridization dynamics.
Our use of heterospecific microarrays could also lead to a general downward bias in the total number of eQTL detected in our analysis, because of a reduced efficiency of cross-hybridization due to sequence divergence between whitefish and salmon. Mean sequence divergence between C. clupeaformis and S. salar is ∼13% on the basis of 16 mitochondrial and nine nuclear genes (Crespi and Fulton 2004). However, sequence divergence might be lower for transcripts on the microarray than the genes used for phylogenetic inference. To evaluate the potential effects of sequence divergence between Coregonus and Salmo on hybridization dynamics, we compared sequence divergence for 36 transcripts with significant eQTL with S. salar sequences from the microarray.
Comparison of eQTL to phenotypic QTL:
We used the phenotypic data from Rogers and Bernatchez (2007) to compare genomic locations of adaptive phenotypic QTL to brain eQTL. To ensure concordance of map distances between data sets, we used the same UNIX platform to reanalyze the phenotypic data. We used the same IM mapping procedure as for eQTL (Zmapqtl Module 3) to examine phenotypic QTL for N = 198 individuals. This analysis identified the same QTL as Rogers and Bernatchez (2007) albeit with slightly different map positions. Support units (2.0-LOD) based on most likely positions of QTL (Broman 2001) were calculated for comparison of overlap between phenotypic QTL and eQTL. We used point estimates for the locations of eQTL.
We also divided the data from Rogers and Bernatchez (2007) into female-only (N = 68) and male-only (N = 72) groups to examine sex-specific phenotypic QTL for comparison to sex-specific eQTL (combined N < 198 because sex was not determined for all individuals). All observed phenotypic QTL in the combined data set were present in each of the sex-specific data sets and had similar LR profiles but often had lower LR values, likely caused by smaller sample size or by sex-specific expression affecting the heritability of the traits. As the locations were the same, all QTL from the larger combined phenotypic data set were used to compare with the distribution of sex-specific eQTL.
Comparison of eQTL to outlier loci from genome scan:
Genome scans involve the analysis of many loci across the genome to infer the role of selection on outlier loci exhibiting extreme allele frequency divergence and have been important for identifying regions of the genome involved in adaptive evolutionary change (Luikart et al. 2003). We compared the genomic location of brain eQTL to loci determined to be outliers in a genome scan of natural lakes that contain sympatric species pairs of lake whitefish (Campbell and Bernatchez 2004). We used genetic map locations of the 19 outlier loci detected by Rogers and Bernatchez (2007). Differentiation between dwarf and normal whitefish at these loci significantly exceeded 95% confidence limits of simulated FST values under a model of neutral evolution (Rogers and Bernatchez 2007), suggesting that divergent natural selection is responsible for the extreme values. This selection hypothesis was further supported by parallel patterns of increased differentiation in more than one species pair for 3 of the outlier loci. These outliers were distributed throughout the genome and since the same experimental individuals were used to identify these outlier loci and in the present eQTL analysis, colocalization between these loci and eQTL could be determined with certainty. eQTL mapping to within 20 cM of outlier AFLP loci were considered colocalized; this corresponded to eQTL colocalizing with the same or immediately adjacent marker on a given linkage group.
RESULTS
eQTL detection:
For the comparison involving eight individuals from each parental line, 1808 genes (12%) were significantly expressed. Of these 1808 transcripts, 201 (11.1%) were significantly differentially expressed (P < 0.05) between dwarf and normal lines raised in a common environment. In the 57 BC progeny examined, 3563 transcripts (24%) were significantly expressed. When BC individuals were segregated according to sex, 306 of these 3563 transcripts (9%) were significantly differentially expressed between males and females (P < 0.05).
We tested for eQTL for all 3563 expressed transcripts, as suggested by Brem et al. (2002) and Shadt et al. (2003). With a permutation-based genomewide significance of α = 0.05, eQTL were identified for 2, 2, and 3% of the 3563 expressed genes in the combined, female-only, and male-only data sets, respectively (Table 1). For the subset of transcripts with significant eQTL, the percentage of transcripts with one eQTL was 100% (72/72), 91% (72/79), and 95% (93/98) for the combined, female-only, and male-only data sets, respectively (supplemental Table S1). For the female-only data set, six transcripts had two eQTL and one transcript had five eQTL, whereas for the male-only data set, five transcripts had two eQTL. Median LR of significant eQTL was 21.0 (range 19.0–119.8), 21.4 (range 19.1–39.8), and 22.5 (range 19.0–51.2) for the combined, female-only, and male-only data sets, respectively. Median percentage of variation explained (PVE) was 48.1% (range 28.8–92.8%), 64.7% (range 44.9–80.8%), and 70.2% (range 54.1–87.1%) for the combined, female-only, and male-only data sets, respectively. Inflated PVE values may be due to the Beavis effect, where small sample size contributes to overestimates of QTL effect sizes (Xu 2003).
Significant eQTL detected for the combined, female-only, and male-only analyses
Group | N | α < 0.10a | α < 0.05 | α < 0.01 |
|---|---|---|---|---|
| Combined | 57 | 100 | 72 | 31 |
| Female only | 32 | 102 | 79 | 24 |
| Male only | 25 | 164 | 98 | 32 |
Group | N | α < 0.10a | α < 0.05 | α < 0.01 |
|---|---|---|---|---|
| Combined | 57 | 100 | 72 | 31 |
| Female only | 32 | 102 | 79 | 24 |
| Male only | 25 | 164 | 98 | 32 |
Empirical threshold for experiment-wide type I error rates of 0.10, 0.05, and 0.01 were determined for each transcript by recording the 10th-, 50th-, and 100th-ranked LR of 1000 random permutations.
The effect on transcript abundance associated with the substitution of a normal whitefish allele (+, toward the hybrid genotype) into a dwarf whitefish genetic background (−, toward the paternal genotype) is reflected by the direction of eQTL additive effects. Additive effect values can therefore be interpreted as the mean effect on transcription of the substitution of a normal whitefish allele into a dwarf whitefish genetic background. eQTL effects ranged from −1.3 to 1.6 in the combined data set, from −1.3 to 1.9 in the female-only data set, and from −0.9 to 1.5 in the male-only data set (supplemental Table S1). Thus, allelic substitution had up to an approximately twofold effect on transcript abundance within our cross.
A sex bias in brain transcriptional genetic architecture was also observed. More significant eQTL were detected in the male-only (98) data set than in either the combined (72) or female-only (79) data sets (χ2 = 4.36, P = 0.04; Table 1; supplemental Table S1). In addition, there were few significant eQTL in common among the three analyses (15, 2, and 1% between the combined and female-only, combined and male-only, and female and male-only, respectively), suggesting that each analysis detected different subsets of transcripts and that pooling male and female data for the combined analysis obscured sex-specific transcription signal.
Effects of sequence divergence on hybridization dynamics:
Results for the β-globin transcript were highly concordant between the microarray and RT–PCR data for differential expression between the parental strains (fold changes of 1.67 and 1.56 for microarrays and RT–PCR, respectively; supplemental Table S2). For the G-protein, the observed fold changes were positive for both microarrays and RT–PCR (fold changes of 1.96 and 1.01 for microarrays and RT–PCR, respectively), but the difference was not significant for RT–PCR (supplemental Table S2).
Sequence results for 68 transcripts on the microarray provided evidence that the likelihood of biased expression data resulting from differential hybridization dynamics between dwarf and normal transcripts should be rare in our analysis. We observed minimal sequence divergence between dwarf and normal transcripts. For the 68 transcripts for which sequence was examined, a total of 84 SNPs were observed for an average of 1.4 SNP/kb. The distribution of SNPs per transcript was highly skewed, where the majority of transcripts (40/68; 59%) had zero SNPs and 90% (61/68) had three or fewer. The mean number of SNPs per transcript was 1.2 (SD 2.4; range 0–13).
We also did not observe a tendency for transcripts for which we detected significant eQTL to have greater sequence variation than transcripts without eQTL, as was the prediction under the hypothesis that sequence variation could cause differential hybridization dynamics that could then cause false-positive eQTL. The mean number of SNPs for transcripts with significant eQTL (N = 36, mean 0.89, SD 1.5, range 0–6) did not significantly differ from transcripts without eQTL (N = 32, mean 1.6, SD 3.1, range 0–13; t43 = 1.2, P = 0.23). In addition, we could not reject the null hypothesis that the distributions of SNPs for transcripts with or without eQTL were the same (Kolmogorov–Smirnov two-sample test; P > 0.05). Results were the same if we standardized the number of SNPs per transcript by the number of base pairs sequenced (data not shown).
The average sequence divergence between the 36 transcripts with significant eQTL and the Salmo sequence on the microarray was 5.1%, which was much lower than has been observed for genes used to reconstruct phylogenetic relationships (∼13% divergence) possibly due to higher constraints on coding regions. Therefore, the greater sequence similarity for transcripts on the microarray should lessen any downward bias on eQTL detection.
Genome distribution of eQTL:
eQTL occurred throughout the whitefish genome, but were not evenly distributed, as we observed concentrations of eQTL clusters in specific regions (Figure 1). Assuming a Poisson distribution, the probability of observing five eQTL in a given bin was <0.0001 for each of the data sets. Thus, we conservatively considered bins with five or more eQTL as regulation hotspots. Hotspots were assigned numbers for each of the data sets (Table 2; Figure 1). We observed the greatest number of hotspots in the female-only analysis (five). Concordance in hotspot genomic location across data sets occurred twice, once on LG 36f for the combined and female-only analyses and again on LG 24f for the combined and male-only analyses (Figure 1). For the female-only and male-only data sets, hotspots occurred on the same linkage group twice (Figure 1), but locations were not concordant (Table 1; supplemental Table S3).
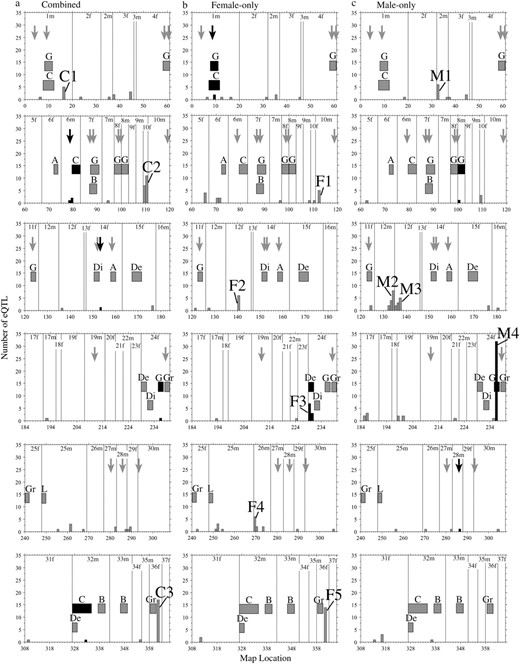
Genome locations of significant eQTL (α = 0.05), phenotypic QTL, and outlier AFLP loci from a genome scan. Shown separately are (a) combined, (b) female-only, and (c) male-only data sets. Linkage group numbers are shown and successive linkage groups are separated by a vertical line. Numbers on the x-axis correspond to successively numbered genetic markers on each linkage group and each interval on the x-axis corresponds to a 17.6-cM bin. Phenotypic QTL correspond to Rogers and Bernatchez (2007) and are shown with 2.0-LOD intervals, represented by boxes. Phenotypic QTL are abbreviated as follows: A, activity; B, burst swim; C, condition factor; De, depth preference; Di, directional swimming change; G, growth rate; Gr, gill raker number; L, life history (age at maturity). Locations of outlier AFLP loci from a previous genome scan (Rogers and Bernatchez 2007) are shown with arrows. Shading of histograms, boxes, and arrows reflects colocalization with eQTL: histogram bars that colocalize with either phenotypic QTL or outlier loci are solid; otherwise, they are shaded. Arrows (representing outlier loci) that colocalize with eQTL are solid; otherwise, they are shaded. Similarly, phenotypic QTL and their 2.0-LOD interval boxes that overlap with eQTL are solid and otherwise are shaded. The number of species pairs for which AFLP loci were outliers is not shown (see Table 4 for those that colocalize with eQTL). Hotspots are defined as bins containing five or more eQTL and are shown numbered successively within each of the analyses according to Table 2.
Characteristics of brain eQTL hotspots
Hotspota | No. of transcriptsb | Mean additive effectc | Mean LRd | Mean PVE (%)e | Proportion same directionf | Linkage groupg | Location (cM)g |
|---|---|---|---|---|---|---|---|
| Combined data set | |||||||
| C1 | 5 | −0.72 | 25.40 | 56.8 | 1 | 1m | 316.8 |
| C2 | 19 | −0.49 | 21.73 | 42.3 | 0.95** | 10f | 18.5 |
| C3 | 17 | −0.77 | 25.08 | 71.7 | 0.94** | 36f | 106.1 |
| Female data set | |||||||
| F1 | 5 | 0.74 | 20.38 | 70.1 | 1 | 10m | 35.3 |
| F2 | 6 | 1.00 | 25.58 | 62.5 | 1 | 12f | 90.9 |
| F3 | 8 | 0.54 | 22.71 | 63.9 | 1 | 24f | 6.9 |
| F4 | 6 | 0.03 | 21.75 | 67.0 | 0.67 | 26m | 19.7 |
| F5 | 14 | −0.66 | 22.15 | 75.9 | 0.86* | 36f | 107.6 |
| Male data set | |||||||
| M1 | 6 | −0.75 | 21.96 | 64.7 | 1 | 2m | 8.3 |
| M2 | 8 | −0.55 | 22.16 | 72.8 | 1 | 12m | 180.8 |
| M3 | 6 | 0.60 | 23.10 | 73.1 | 1 | 12f | 58.0 |
| M4 | 32 | 0.70 | 24.81 | 72.1 | 1 | 24f | 125.6 |
Hotspot identification code.
Number of transcripts within a hotspot.
Direction of mean effects indicates the overall direction of transcripts within a hotspot and is the direction referred to in the “Proportion same direction” column.
Mean likelihood ratio of transcripts within a hotspot.
Mean and direction of additive effects of transcripts within a hotspot.
A value of “1” indicates that the additive effects of all eQTL of a hotspot were in the same direction. A χ2 test was used to test for significant deviations from a 1:1 proportion of positive and negative effects within hotspots. When the proportion in same direction is 1, the result is highly significant. *P < 0.01; **P < 0.001.
Linkage groups and chromosomal locations are numbered following Rogers and Bernatchez (2007) and Rogers et al. (2007).
The additive effects of all or most of the eQTL in a given hotspot tended to be in the same direction (Table 2). The mean value of additive effects of a hotspot was indicative of the direction of absolute phenotypic effect for the eQTL within a given hotspot (Table 2). The null hypothesis of a 1:1 proportion of eQTL with positive and negative additive effects could be rejected in all but one case (female-only hotspot 4, LG 26m). For 8 of 12 (67%) of the detected hotspots, the additive effects of all of the eQTL were in the same direction (Table 2).
Comparison to phenotypic QTL:
We compared genome locations of previously identified phenotypic QTL and eQTL to test if regulators of neural transcription co-occur with loci underlying previously identified adaptive traits. Of the nine instances of overlap, eight (89%) involved QTL for growth rate and condition factor (Table 3; Figure 1). For the combined data set, there were three instances of colocalization between previously identified QTL and neural eQTL, including colocalization of a condition factor QTL and an eQTL for the 60S ribosomal protein L35 on LG 6m and a condition factor QTL and an eQTL for the histone H1x transcript (putative biological process = transcription regulation) on LG 32m (Table 3). For the female-only data set, there were three cases of colocalization between phenotypic QTL and eQTL (Table 3; Figure 1). Overlap occurred on LG 1m between QTL for both condition factor and growth rate and eQTL of the 60S ribosomal protein L10a and 40S ribosomal protein SA transcripts. On LG 24f, a depth preference behavioral QTL colocalized with female-only hotspot 3, where five of seven (71%) of the eQTL were for transcripts involved in protein synthesis (Table 3). Also occurring in this location were eQTL for the SPARC precursor (secreted protein acidic and rich in cysteine; putative biological process = neural development) and troponin (putative biological process = neural development; Table 3; Figure 1). For the male-only data set, there were three cases of overlap between phenotypic QTL and eQTL, including colocalization of a growth rate QTL and an eQTL for two transcripts that both code for protein SP100-A1 (putative biological process = neural plasticity) on LG 11f and a growth rate QTL with male-only hotspot 4 on LG 24f (Table 3; Figure 1). This hotspot contained eQTL with putative biological processes related to energetic metabolism, metal ion sequestration, neural growth, and transcription regulation, among others (Table 3).
Colocalization between brain eQTL and traditional phenotypic QTL
Trait with phenotypic QTL/transcript with eQTLa | Biological processb | LGc | Location (cM)d | 2.0-LOD unit of support (cM)e | LRf | Additive effectg | PVE (%)h |
|---|---|---|---|---|---|---|---|
| Combined | |||||||
| Condition factor | 6m | 117.6 | 82.8–139.6 | 14.9 | (−) | 7.9 | |
| CK991325 [GO] [O55142] 60S ribosomal protein L35a | Protein synthesis | 6m | 84.1 | 20.9 | −0.50 | 32.2 | |
| CK990835 unknown | Unknown | 6m | 92.1 | 20.0 | −0.71 | 42.6 | |
| Growth rate | 24f | 98.8 | 57.5–136.0 | 12.6 | (−) | 6.7 | |
| CK990765 unknown | Unknown | 24f | 122.0 | 20.9 | −0.51 | 32.8 | |
| Condition factor | 32m | 67.5 | 0–121.8 | 12.4 | (−) | 7.7 | |
| CB492165 histone H1x | Transcription regulation | 32m | 84.3 | 21.0 | −0.36 | 36.6 | |
| Female only | |||||||
| Condition factor | 1m | 159.6 | 130.3–195.7 | 5.4 | (−) | 6.2 | |
| Growth rate | 1m | 159.6 | 132.3–185.9 | 11.1 | (−) | 10.3 | |
| CB491051 60S ribosomal protein L10a | Protein synthesis | 1m | 185.9 | 22.9 | 0.43 | 74.4 | |
| CK990697 40S ribosomal protein SA | Protein synthesis | 1m | 183.9 | 20.8 | 0.47 | 58.8 | |
| Depth | 24f | 16.0 | 4.0–37.2 | 15.9 | (−) | 19.5 | |
| Female-only hotspot 3 (N eQTL = 8) | |||||||
| CA047024 [GO] [P62843] 40S ribosomal protein S15 | Protein synthesis | 24f | 6.0 | 24.2 | 0.59 | 65.9 | |
| CA061476 [GO] [P62830] 60S ribosomal protein L23 | Protein synthesis | 24f | 6.0 | 26.5 | 0.62 | 71.7 | |
| CA062534 predicted: Danio rerio hypothetical LOC556254 | Unknown | 24f | 10.0 | 21.4 | 0.37 | 64.1 | |
| CA043808 [GO] [Q9W0Y1] troponin C-akin-1 protein | Neural development | 24f | 12.0 | 24.2 | 0.86 | 71.5 | |
| CB491051 [GO] [P53026] 60S ribosomal protein L10a | Protein synthesis | 24f | 14.0 | 22.8 | 0.41 | 70.4 | |
| CA052515 [GO] [Q9CXW4] 60S ribosomal protein L11 | Protein synthesis | 24f | 21.2 | 19.4 | 0.69 | 61.2 | |
| CA058685 [GO] [O55142] 60S ribosomal protein L35a | Protein synthesis | 24f | 21.2 | 19.3 | 0.66 | 9.7 | |
| CB498012 [GO] [P07214] SPARC precursor | Neural development/synaptic function modulation | 24f | 25.2 | 19.4 | 0.57 | 68.9 | |
| Male only | |||||||
| Growth rate | 8m | 14.0 | 0.0–25.5 | 20.7 | (+) | 16.3 | |
| CA054575 unknown | Unknown | 8m | 0.0 | 21.4 | 0.31 | 58.2 | |
| Growth rate | 11f | 70.4 | 53.6–88.4 | 13.9 | (−) | 7.4 | |
| CK990568 [GO] [P56565] protein S100-A1 | Neural plasticity | 11f | 70.4 | 22.3 | −0.51 | 59.5 | |
| CB504209 [GO] [P56565] protein S100-A1 | Neural plasticity | 11f | 78.4 | 19.0 | −0.39 | 73.5 | |
| Growth rate | 24f | 98.8 | 57.5–136.0 | 12.6 | (−) | 6.7 | |
| Male-only eQTL hotspot 4 (N eQTL = 32) | |||||||
| CB515219 [GO] [P41233] ATP-binding cassette, subfamily A | Transport pump | 24f | 126.0 | 19.7 | 0.58 | 65.9 | |
| CA049433 [NT] [AF338763] ferritin-H subunit | Iron metabolism | 24f | 126.0 | 20.1 | 0.77 | 67.1 | |
| CA064135 [GO] [Q8VDJ3] vigilin | Unknown | 24f | 122.0 | 19.8 | 0.45 | 58.5 | |
| CA052164 [NT] [AJ716203] Cyp19b-I gene for P450aromB-I | Neuroprotection | 24f | 126.0 | 27.6 | 0.66 | 75.8 | |
| CA044693 [NR] [AAH56725] glutathione S-transferase, θ-1 | Neuroprotection | 24f | 126.0 | 25.1 | 0.47 | 72.9 | |
| CK990995 S. salar TNF-α-2 gene | Immune system | 24f | 126.0 | 27.7 | 0.78 | 75.8 | |
| CA053291 solute carrier family 23 member 1 | Transport protein | 24f | 128.0 | 28.7 | 0.83 | 80.6 | |
| CB497887 [GO] [Q99P72] Reticulon 4 (neurite outgrowth inhibitor) | Neural development | 24f | 126.0 | 24.2 | 0.46 | 72.0 | |
| CB496947 [GO] [Q08376] zinc-finger protein 161 (Zfp-161) | Transcription regulation | 24f | 126.0 | 23.8 | 0.96 | 71.5 | |
| +23 unknown transcriptsi | Unknown | 24f | 122.0–128.0 | 25.1 | 0.70 | 71.9 | |
Transcripts names follow cGRASP (http://web.uvic.ca/cbr/grasp/; Rise et al. 2004). Phenotypic QTL are in italics, eQTL in non-italic type. Hotspot numbers and details follow Table 2.
Significant eQTL were assigned to biological process categories with the AMIGO browser of Geneontology (http://www.geneontology.org), the KEGG PATHWAY database (http://www.genome.jp/kegg/pathway.html), and the UniProt database (http://www.expasy.uniprot.org/), along with additional literature searches.
LG refers to the linkage group within which phenotypic QTL and eQTL were detected and are numbered according to Rogers and Bernatchez (2007) and Rogers et al. (2007).
Location refers to the mean chromosomal position, in centimorgans, of phenotypic QTL or eQTL.
Reported for phenotypic QTL only.
Likelihood ratio. For sex-specific phenotypic QTL, LR values correspond to values from sex-specific analyses.
Additive effect, direction provided by (+) or (−) signs. Only the direction of additive effects is shown for phenotypic QTL since scale differs for eQTL and values are not directly comparable.
Percentage of variation explained.
Mean LR, PVE, and additive effects of the 23 eQTL associated with unknown transcripts in male hotspot 4 are shown.
Comparison to outlier loci from genome scan:
Colocalization of eQTL with previously identified outlier loci from a genome scan was used to test for the influence of selection on the neural transcriptome. Four of 19 outlier AFLP loci previously identified colocalized with neural eQTL, 2 for the combined data set and 1 for each of the female-only and male-only data sets (Table 4; Figure 1). This colocalization involved eQTL of seven different transcripts (Table 4). For the combined data set, CATA073.7 colocalized with an eQTL for the cytocrome c oxidase polypeptide 5A transcript (putative biological process = metabolism and energy production) and eQTL for two ribosomal transcripts (60S ribosomal protein L31 and 60S ribosomal protein L35a) on LG 6m. CAAG116.1 colocalized with an eQTL for protein S100-A1 on LG 14f. For the female-only data set, GGTG105.0 colocalized with eQTL for two ribosomal transcripts (40S ribosomal protein SA and 60S ribosomal protein L10a) on LG 1m. Finally, for the male-only data set, CGTC060.7 colocalized with an eQTL for the ATP synthase β-chain transcript (putative biological process = metabolism and energy production) on LG 28m (Table 4).
Colocalization between brain eQTL and outlier loci from genome scan of natural populations
Outlier locus/transcript with eQTLa | Biological processb | LGb | Location (cM)b | LRb | Additive effectb | PVE (%)b |
|---|---|---|---|---|---|---|
| Combined | ||||||
| CATA073.7 (outlier in three populations) | 6m | 73.7 | ||||
| CB510673 [GO] [P12787] cytochrome c oxidase polypeptide 5A | Metabolism/energy production | 6m | 78.7 | 19.6 | −0.39 | 39.3 |
| CK990835 [GO] [P62900] 60S ribosomal protein L31 | Protein synthesis | 6m | 92.1 | 20.0 | −0.71 | 42.6 |
| CK991325 [GO] [O55142] 60S ribosomal protein L35a | Protein synthesis | 6m | 84.1 | 20.9 | −0.50 | 32.2 |
| CAAG116.1 (outlier in one population) | 14f | 115.9 | ||||
| CK990473 [NR] [AAC28367] protein S100-A1 | Neural plasticity | 14f | 115.7 | 19.9 | 0.20 | 29.5 |
| Female only | ||||||
| GGTG105.0 (outlier in one population) | 1m | 186.9 | ||||
| CK990697 [GO] [P14206] 40S ribosomal protein SA | Protein synthesis | 1m | 183.9 | 20.8 | 0.47 | 58.8 |
| CB491051 [GO] [P53026] 60S ribosomal protein L10a | Protein synthesis | 1m | 185.9 | 22.9 | 0.43 | 74.4 |
| Male only | ||||||
| CGTC060.7 (outlier in one population) | 28m | 57.9 | ||||
| CA062071 [GO] [P56480] ATP synthase β-chain | Metabolism/energy production | 28m | 54.6 | 20.1 | 0.69 | 60.8 |
AFLP outlier loci from genome scan are in italics; the number of populations for which AFLP loci were outliers are in parentheses, and eQTL in non-italic type. Outlier loci and corresponding genome locations are from Rogers and Bernatchez (2007).
See Table 3 legend for other columns.
Comparison to transcripts differentially expressed between parental lines:
Transcripts that are differentially expressed between parental lines raised in a common environment may have diverged due to directional selection. Thus, eQTL of such transcripts become candidates for eQTL shaped by adaptive divergence. For an eQTL genomewide α = 0.05 and a corresponding significance level of differential parental line expression, we observed 2, 5, and 1 eQTL for transcripts whose expression level differed between parental lines for the combined, female-only, and male-only analyses, respectively (Table 5). Relaxing the error rate to P < 0.10 for tests of differential gene expression, we observed 5, 10, and 4 eQTL for transcripts that also differed significantly in expression-level parental lines for the combined, female-only, and male-only analyses, respectively. For the combined analyses, transcripts included Acyl-CoA-binding protein (putative biological process = neural development), cytochrome c oxidase subunit 3, and tubulin α-2 chain. For the female-only data set, transcripts included cytochrome c oxidase subunit 1, Acyl-CoA-binding protein, tubulin α-2 chain, actin (putative biological process = neural development), and 40S ribosomal protein. For the male-only data set, transcripts included protein S100-A1 and 60s ribosomal protein L13A. This S100-A1 transcript (CK990568) also colocalized with a growth factor QTL on LG 11f. Interestingly, the eQTL for all three differentially expressed tubulin transcripts occurred on LG 36f, implicating this linkage group with divergent neural developmental processes between dwarf and normal whitefish (Table 5).
Genes both differentially expressed between pure dwarf and normal parental lines (P < 0.10) and with significant brain eQTL (α = 0.05)
Transcript namea | Biological processa | P-value of differential expressionb | D/N common environmentc | LGa | Location (cM)a | LRa | Additive effecta | PVE (%)a |
|---|---|---|---|---|---|---|---|---|
| Combined | ||||||||
| CB496981 [GO] [Q24320] DNA-directed RNA polymerases I, II, and III subunit RPABC2 | RNA synthesis | 0.015 | 0.76 | 28m | 70.4 | 19.1 | 0.66 | 28.8 |
| CA044952 [GO] [P42281] Acyl-CoA-binding protein homolog (ACBP) | Neural development | 0.017 | 1.53 | 2m | 72.8 | 20.1 | −0.54 | 40.2 |
| CK991017 [GO] [P00417] cytochrome c oxidase subunit 3 | Metabolism and energy production | 0.063 | 0.87 | 10f | 8.0 | 19.3 | −0.79 | 37.9 |
| CA047976 Wu:fc15g08 protein [D. rerio] | Unknown | 0.064 | 1.25 | 36f | 107.6 | 28.6 | −1.23 | 78.3 |
| CB492276 [GO] [P05213] tubulin α-2 chain | Neural development | 0.072 | 0.90 | 36f | 105.6 | 20.5 | −0.77 | 74.0 |
| Female only | ||||||||
| CN442540 [GO] [P00399] cytochrome c oxidase subunit 1 | Metabolism and energy production | 0.0074 | 0.81 | 26m | 19.7 | 19.7 | −0.81 | 63.8 |
| CA044952 [GO] [P42281] Acyl-CoA-binding protein homolog (ACBP) | Neural development | 0.017 | 1.53 | 2m | 70.8 | 22.2 | −0.71 | 65.8 |
| CB498203 pleiotrophic factor-α-2 precursor | Unknown | 0.028 | 0.85 | 12m | 28.2 | 22.5 | −0.32 | 50.9 |
| CB511393 unknownd | Unknown | 0.049 | 0.85 | 3f, 26m | 18.0,169.0 | 22.8, 23.4 | −0.95, −0.94 | 78.2, 77.4 |
| CB496460 [NR] [AAO32675] hyperosmotic glycine-rich protein [S. salar] | Unknown | 0.059 | 0.80 | 26m | 20.0 | 22.7 | −1.12 | 69.9 |
| CA047976 Wu:fc15g08 protein [D. rerio] | Unknown | 0.064 | 1.25 | 36f | 107.6 | 22.2 | −1.23 | 78.5 |
| CB492276 [GO] [P05213] tubulin α-2 chain (α-tubulin 2) (α-tubulin isotype M-α-2) | Neural development | 0.072 | 0.90 | 36f | 107.6 | 23.1 | −0.80 | 77.7 |
| CB497444 [GO] [P68134] Actin, α cardiac | Neural development | 0.078 | 1.30 | 12f | 90.2 | 22.6 | 1.01 | 58.7 |
| CB511927 [GO] [P68369] tubulin α-chain | Neural development | 0.094 | 0.96 | 36f | 107.6 | 25.7 | −0.71 | 80.8 |
| CB492855 [GO] [P62242] 40S ribosomal protein S8 | Protein synthesis | 0.097 | 1.25 | 5f | 93.9 | 19.4 | 0.65 | 58.8 |
| Male only | ||||||||
| CK990568 [GO] [P56565] protein S100-A1 | Neural plasticity | 0.030 | 1.29 | 11f | 70.4 | 22.3 | −0.51 | 59.5 |
| CA047133 [GO] [P02089] hemoglobin subunit β-1 | Blood | 0.063 | 0.85 | 21f | 29.5 | 20.9 | 1.01 | 70.2 |
| CB494514 [GO] [Q9VNE9] 60S ribosomal protein L13A | Protein synthesis | 0.076 | 1.25 | 2m | 8.0 | 21.2 | −0.80 | 62.8 |
| CK990921 unknown | Unknown | 0.083 | 1.23 | 17f | 83.5 | 19.3 | −0.87 | 61.7 |
See Table 3 legend.
Based on F-test implemented in R/MAANOVA and eight individuals of each pure parental line.
Ratio of dwarf to normal mean expression values.
Only transcript for which more than one eQTL was detected; parameter estimates for each of these eQTL are separated by a comma.
DISCUSSION
The objective of this study was to elucidate the genetic architecture of brain gene expression in diverging dwarf and normal lake whitefish species pairs and to test for colocalization of brain eQTL with phenotypic QTL and loci exhibiting signatures of selection in natural populations. Our results demonstrate that genetic underpinnings of neural transcription colocalize with previously identified phenotypic QTL in some cases and that signatures of selection are associated with neural eQTL. In several cases, these colocalizing eQTL were associated with transcripts that were also differentially expressed between dwarf and normal parental lines, providing further evidence for the adaptive significance of these transcripts. We also observed a sex bias to brain transcriptional genetic architecture, suggesting that differences between sexes may be another important component to adaptive divergence in whitefish.
Genetic architecture of transcription in whitefish:
The 11% of transcripts that we observed to be significantly differentially expressed between parental (dwarf and normal) lines reared in a common environment is consistent with other eQTL studies to date (Gibson and Weir 2005) and other studies of gene expression in brain tissue of salmonids. For example, Aubin-Horth et al. (2005a) found that ∼15% of brain transcripts were significantly differently expressed in wild-caught salmon of two alternative life histories, and Aubin-Horth et al. (2005b) found 10.5% were significantly differently expressed in a comparison of salmon of alternative life histories reared in either the wild or captivity.
We observed a small proportion of eQTL with extremely high LR values, which is consistent with previous eQTL analyses (e.g., Kirst et al. 2005). We also observed many eQTL that explained a large amount of transcriptional variation, up to 90%. Other studies have commonly found eQTL that account for 25–50% of transcriptional variation (Gibson and Weir 2005). The distribution of PVE values that we observed, especially in the sex-specific data sets, could be due to the Beavis effect (Lynch and Walsh 1998; Gibson 2002). Thus, absolute PVE values from this study must be interpreted with caution, but nevertheless suggest that major-effect eQTL may be common in whitefish.
The vast majority of the 3563 expressed transcripts had zero significant eQTL, suggesting that the majority of transcripts did not have additive genetic variation for gene expression segregating in our backcross family. However, low power due to the number backcross progeny that we analyzed might be largely responsible for this result. It is possible that we would have detected eQTL for more transcripts had we used an F2 study design or if a more dense linkage map were available. Furthermore, the use of a Salmo-based microarray might have caused a downward bias in the total number of eQTL detected. However, we expect that this bias is minimal due to the evidence that sequence divergence between Coregonus and Salmo transcripts on the microarray is only 5.1%, less than half of that observed for genes used to construct phylogenetic relationships.
Our observation that 9% of transcripts were differentially expressed between males and females indicates moderate sex bias in brain gene expression in whitefish. Previous studies of sex-biased gene expression have varied widely, depending on the tissue analyzed, but up to 57% of genes showed sex-biased expression in a study of whole adult Drosophila melanogaster (Ranz et al. 2003; Ellegren and Parsch 2007). In whitefish, a recent eQTL analysis of muscle tissue that used the same backcross individuals used in our study revealed that 21% of transcripts were differentially expressed between males and females (Derome et al. 2008). In addition, our observation of significantly more eQTL in males than in either the female-only or combined data set provides additional support for the results of Derome et al. (2008), which observed divergence in the genetic architecture of gene expression between sexes. Together, these studies suggest that sex-biased genetic architecture of transcription may be an important component of evolutionary divergence in whitefish. It is noteworthy, however, that the pattern observed in the brain was reversed to that reported for muscle, where there were significantly more eQTL in females than either the male-only or combined data set. This indicates that differential patterns between sexes may vary according to different tissues and functions.
We observed the greatest number of eQTL in the male-only subset of the data, despite the fact that this subset had the smallest sample size. Thus, it appears that low power is not the cause of these results. By partitioning the data set between sexes, we observed many different eQTL that did not appear in the pooled analysis, which suggests that the sex-specific analyses detected subsets of transcripts that are differentially regulated in each sex. It is likely that pooling male and female data for the combined analysis obscured the sex-specific transcription signal and, in turn, transcripts detected in the combined data set were not influenced by sex. This leads to the prediction that the combined analysis identified eQTL that are not sex biased in expression, at least in brain tissue. In addition, the lack of concordance between males and females in genomic locations of hotspots indicates that master regulators of transcription may differ between sexes. Large differences in the internal environment of each sex, particularly with hormone expression (Davies and Wilkinson 2006; Ellegren and Parsch 2007), is one potential explanation for the observed sex bias in eQTL associations.
Our RT–PCR results, where RT–PCR and microarrays were concordant in one of two cases, suggest that our eQTL data set may contain a significant proportion of false positives. However, concordance between microarrays and RT–PCR may not be particularly strong in cases where individual variability is high and fold change in transcription is relatively low, or where a history of genome duplication has given rise to multiple related genes with high sequence similarity (Harr et al. 2006; Morey et al. 2006). In the case of the G-protein gene, it is possible that our RT–PCR primers amplified a paralog or distinct member of the G-protein gene family instead of the transcript for which expression data were collected on the microarray. It is also noteworthy that the percentage difference between microarray and RT–PCR results was within the range from the one eQTL study published thus far (of 25 studies) that has attempted to validate eQTL results (Hubner et al. 2005). These authors observed percentage differences between the RT–PCR and microarrays ranging from 0 to 233% (data from their supplemental Figure S1) and concluded that RT–PCR had validated their microarray data. In our case, the percentage differences that we observed were 6% and 96%.
Our sequence data provided more compelling evidence that sequence variation should not create bias in our microarray expression results. Indeed, sequence variation that might affect hybridization dynamics between dwarf and normal transcripts was minimal and rare. Transcripts with significant eQTL did not differ in the number of SNPs from transcripts without eQTL, nor did the SNP distributions differ for transcripts with or without eQTL. Together, these data suggest that it is unlikely that differential hybridization dynamics owing to sequence variation would affect more than a small percentage of transcripts in our eQTL analysis.
Hotspots:
Hotspots have emerged as an important aspect of the genetic architecture of transcription (Gibson and Weir 2005). eQTL hotspots may occur at the same location as a regulatory factor that controls a large set of genes or may represent gene-rich regions (Kirst et al. 2005). We observed that most, if not all, transcripts within hotspots had additive effects in the same direction, with only one exception. These results are similar to those found by Kirst et al. (2005) in a study of eucalyptus. This concordance in the direction of additive effects is consistent with a master regulatory gene with a strong pleiotropic effect on transcription of large suites of genes. Such master regulatory genes could represent mutations of large effect related to gene regulation, a form of early substitution of large effect theoretically predicted during adaptive divergence (Orr 2005b). These master regulatory genes may play an important role in whitefish divergence, particularly where hotspots colocalize with other phenotypic QTL (see below). The concordance of directionality within hotspots is also consistent with a history of directional selection shaping transcriptional variation for all transcripts within a hotspot, as suggested by Orr (1998) for the direction of additive effects for QTL.
Overlap between phenotypic QTL and eQTL:
Direct comparison of the genomic distribution of eQTL and traditional phenotypic QTL, lying within the emerging field of phenomics, has been used as a powerful method to bridge the gap between genotype and phenotype and to generate lists of candidate genes with a potentially large influence on organismal phenotypes (Schadt et al. 2003; Bystrykh et al. 2005; Chesler et al. 2005; Hubner et al. 2005; Wentzell et al. 2007). For example, Hubner et al. (2005) compared physiological QTL with eQTL from fat and kidney tissue of rats to identify cis- and trans-acting eQTL that represent candidate genes for traits related to hypertension.
We lack positional data for the transcripts for which we detected eQTL, such that eQTL that we identified could be either cis- or trans-acting. Cis-acting eQTL are usually caused by sequence variation in the gene itself, most likely in the gene's regulatory region (Chesler et al. 2005). Trans-acting eQTL represent loci that influence expression of genes or transcripts remote from the eQTL itself (Hubner et al. 2005). Cis-acting eQTL are of particular interest as positional candidate genes for phenotypic QTL, or in the case of overlap with outlier loci in our study, candidates for loci under selection (Hubner et al. 2005). Overlap of eQTL with phenotypic QTL or with outlier loci suggests that these loci could be involved with regulatory pathways that mediate the organismal-level phenotypes of interest or that components of a particular regulatory pathway may be influenced by natural selection. However, positional data will be required to determine cis- or trans-status of the eQTL identified in this study.
All but one (89%) of the instances of overlap between previously identified phenotypic QTL and brain eQTL in our study involved growth rate and condition factor, which rank among the most important phenotypic traits differentiating dwarf and normal whitefish (Rogers and Bernatchez 2007). eQTL of ribosomal protein genes (both 40S and 60S) were associated with two of these instances of overlap (on LG's 1m and 6m). Ribosomal proteins are integral components of the ribosome where they stabilize rRNA structure and regulate translocation of mRNA and tRNA, both of which are essential for optimal mRNA translation into protein (Melese and Xue 1995; Salem et al. 2007). In much the same way that RNA–DNA ratios are commonly used to estimate growth and condition (Buckley et al. 1999), we hypothesize that regulation of ribosomal protein genes is functionally related to growth rate and condition factor QTL through increased protein biosynthesis and turnover (Smith et al. 2000). The direction of additive effects were consistent with this hypothesis in the case of overlap on LG 1m in the female-only analysis, where the substitution of the normal whitefish allele (the species with greater growth rate) had a positive effect on 60S and 40S ribosomal protein expression. However, the eQTL on LG 6m for another 60S ribosomal transcript had a negative additive effect on transcript abundance in the combined analysis, implying that this gene is upregulated in reduced growth rate dwarf whitefish. An eQTL for the histone H1x gene also colocalized with a condition factor QTL on LG 32m and, in this case, the normal allele had a negative additive effect on transcript abundance. This histone transcript may control gene expression related to metabolic function, as histones play an important role in gene expression regulation through epigenetic modification of chromatin structure (Jenuwein and Allis 2001). Finally, one eQTL for each of two protein S100-A1 transcripts provided an intriguing colocalization with a growth factor QTL in the male-only data set on LG 8m. An S100-A gene is a strong promoter of neurite outgrowth and has been implicated in neuronal plasticity in rats (Kiryushko et al. 2006). How gene regulation by histones and neural plasticity caused by S100-A1 proteins may be related to condition and growth and thus how they may be involved in whitefish species pair divergence warrants further investigation.
Overlap between eQTL hotspots and phenotypic QTL provides a particularly strong case for a link between transcriptional phenotype and genes underlying organismal phenotype. It is possible that one master regulatory gene influences the transcription of many other genes and directly influences organismal phenotype at these sites. Such colocalization occurred with the growth rate QTL on LG 24f with male-only hotspot 4. This hotspot contained eQTL for genes putatively involved with transcription regulation, neuroprotection, neural development, protein transport, iron metabolism, and immune function. A candidate for a master regulatory genes at this site is transcript CB496947, a zinc-finger protein and the only transcript with eQTL in this hotspot that functions in transcription regulation. Zinc-finger proteins are one of the most common kinds of transcription regulators (Luscombe et al. 2000) and have been found to play important roles in developmental regulatory networks (Simpson 2007). Mapping evidence will be necessary to further test the role of this zinc-finger transcript in regulating this hotspot. In addition, the diverse functional roles of transcripts with eQTL in this hotspot suggest that multiple regulators of this hotspot may exist and that this zinc-finger transcript may be one of several regulators.
Overall, our prediction that brain eQTL would colocalize with genes underlying behavioral QTL was not well supported, with the exception of the depth preference QTL on LG 24f and hotspot F3 in the female-only analysis. This could be due to lack of power due to the relatively small number of progeny used. Another possibility is that previously identified behavioral QTL may correspond to genes involved with integrated metabolic phenotypes that result from behavioral differences instead of identifying genes directly involved with the measured behavior. Colocalization between the depth preference QTL of LG 24f and the female-only hotspot F3 identified candidate genes that may directly and indirectly influence behavior. Two genes with colocalizing eQTL that might be directly related to behavior are SPARC and troponin. SPARC is involved in neural development through signaling that allows neurons to end developmental migrations (Gongidi et al. 2004). SPARC has also been proposed to modulate synaptic functions and to be involved in higher cortical functions in adult mammalian brains (Lively et al. 2007), making this an intriguing candidate for depth preference behavior. Troponin is associated with actin and tropomyosin in the actin scaffold of muscle tissue (Roisen et al. 1983). In neurons, these molecules are collectively associated with neural development and growth (Schevzov et al. 1997; Aubin-Horth et al. 2005a), thus potentially providing a link between troponin and behavioral differences between species pairs.
Two linkage groups in particular appear to play an important role in adaptive divergence between whitefish species pairs. First, multiple lines of evidence point to the importance of LG 24f. In this study, this linkage group provided one of only two cases where we observed concordance in eQTL–phenotypic QTL overlap across data sets. It was also the only linkage group with colocalization of eQTL with a behavioral QTL. Further, the eQTL–phenotypic QTL colocalization in the male-only analysis involved the hotspot with the greatest number of eQTL. Rogers and Bernatchez (2007) observed four phenotypic QTL on this linkage group in addition to an AFLP outlier locus that colocalized with a number of gill raker QTL. Further understanding of the genetic underpinnings of the eQTL on this linkage group (including those in hotspots) promises to shed light on its evolutionary importance. Similarly, LG 36f emerged as another highly important linkage group. This linkage group contained hotspots in both the combined and the female-only analyses, and 26% of the transcripts significantly differentially expressed between parental lines had eQTL there as well.
Overlap between eQTL and outlier loci from genome scan:
We compared overlap between brain eQTL and outlier loci from a genome scan to test the hypothesis that neural transcriptomes play a direct role in adaptive trait divergence. The four observed cases of colocalization provide initial evidence that directional selection can shape neural transcriptomes. Of the seven eQTL that colocalized with outlier loci, four were associated with ribosomal transcripts, providing further evidence that protein synthesis genes associated with growth may be involved in adaptive divergence between whitefish species pairs. An additional colocalizing eQTL was associated with protein S100-A1, providing additional evidence that this putative neural plasticity gene may be involved with whitefish divergence.
The two energetic metabolism transcripts that had eQTL colocalizing with outlier AFLP loci provide further evidence that divergence between whitefish is related to metabolic function. Cytochrome c oxidase was among the transcripts with eQTL in the genomic region containing locus CATA073.7 on LG 6m. This gene is a crucial mitochondrial enzyme that functions in the final step of the respiratory chain by carrying electrons from cytochrome c to molecular oxygen (Boekema and Braun 2007) and could be particularly important in high-energy-demanding brain tissue (Streck et al. 2007). Cytochrome c oxidase emerges as an important metabolic candidate gene due to this colocalization, especially since CATA073.7 was an outlier in three separate species pairs, providing strong evidence that selection is responsible for elevated divergence at this region of the genome (Rogers and Bernatchez 2007). Furthermore, the negative direction of additive effects of this eQTL were also consistent with the normal allele leading to reduced transcript abundance since genes associated with energy metabolism have been shown to be generally overexpressed in dwarf whitefish. Another energetic metabolism gene with an eQTL that colocalized with an outlier locus was the ATP synthase β-chain on LG 28m. ATP synthase is crucial to the mitochondrial oxidative phosphorylation system in its role of catalysis of ADP to produce ATP (Boekema and Braun 2007); however, in this case the additive effects of this eQTL were positive and thus were not in the direction predicted if normal whitefish alleles lead to a reduction in energetic metabolism gene expression.
Differential expression between parental lines:
Several of the candidate transcripts above were also differentially expressed between common environment parental lines. Significant divergence in expression between pure dwarf and normal whitefish reared in a common environment is potentially due to adaptive and historical genetic divergence between these species. Thus, divergence in expression between parental forms provides additional evidence that eQTL are highly important in evolutionary diversification in whitefish, especially when the same eQTL colocalize with phenotypic QTL or outlier AFLP loci. For example, the same protein S100-A1 transcript (CK990568) that had an eQTL that colocalized with the growth rate QTL on LG 11f in the male-only analysis was also differentially expressed between parental lines. The eQTL that colocalized in the combined analysis with outlier locus CAAG116.1 on LG 14f was a different S100-A1 transcript (CK990473). These two transcripts share only 46% sequence identity (data not shown) and thus may be alternative forms of the S100 gene or may be duplicate gene copies. Additionally, cytochrome c oxidase subunits 1 and 3 were significantly differentially expressed between parental lines. While different from the cytochrome oxidase transcript with an eQTL that colocalized with an AFLP outlier locus, these results attest to the general importance of cytochrome c oxidase genes in whitefish adaptive evolution. Further work is needed to disentangle issues related to functional role, gene copy number, and genome locations of these genes.
Additional data from two lakes with naturally occurring species pairs support some of the above conclusions (J. St-Cyr, unpublished data; populations described in Derome and Bernatchez 2006; St-Cyr et al. 2008). 40S ribosomal protein S15 and troponin, two of the transcripts with eQTL that map to female-only hotspot 3, the hotspot colocalizing with the depth preference QTL, are also significantly differentially expressed in one of the natural lakes investigated in these studies. In addition, the same protein S-100-A1 transcript (CK990568) with eQTL that colocalize with a growth rate QTL on LG 11f in the male analysis and that is significantly differentially expressed in captive parental lines was also significantly differentially expressed in one of these natural lakes, with greater expression in the dwarf species in both the laboratory and the wild. Finally, one of the cytochrome c oxidase genes (subunit 1) that was differentially expressed between lab-reared parental lines was also significantly differentially expressed in a natural lake.
Conclusions:
Analyses of the genetic architecture of gene transcription in systems undergoing adaptive divergence provide a powerful method for understanding the link between genotype and phenotype and the effects of natural selection on gene expression. To our knowledge, this is the first report to integrate data from traditional phenotypic QTL, genome scans in natural populations, and eQTL in a study system undergoing adaptive evolution. Genetic architecture of brain gene expression in whitefish species pairs was divergent between sexes. This study revealed candidates genes for adaptive divergence of dwarf and normal whitefish and evidence that natural selection may act on neural transcription. The most important candidate genes included multiple ribosomal protein genes, cytochrome c oxidase, ATP synthase, and protein S100-A1. Hotspots colocalized with previously identified phenotypic QTL in several cases and in a sex-specific manner, revealing possible locations where master regulatory genes, such as a zinc-finger protein in one case, control gene expression directly related to adaptive phenotypic divergence. With one exception involving depth preference, we observed little evidence of colocalization of neural eQTL with behavioral QTL. Yet, colocalization of brain eQTL with four previously identified outlier loci from a genome scan demonstrated that the neural transcriptome can be associated with signatures of selection in natural populations. In addition, eQTL of transcripts that were differentially expressed between parental lines and colocalized with either phenotypic QTL or outlier loci were especially promising candidate genes. In future investigations, candidates that emerged from this analysis should be sequenced to determine genetic differentiation among natural populations, to map the positions of these genes, and to further test for the effects of directional selection on the genes themselves.
Footnotes
Present address: Department of Zoology, University of British Columbia, Vancouver, BC V6T 1Z4, Canada.
Footnotes
Communicating editor: P. J. Oefner
Acknowledgement
We thank Serge Higgins and co-workers in the Laboratoire Régional des Sciences Aquatiques animal facility for providing support during whitefish rearing. B. Koop and W. Davidson with the cGRASP project provided assistance with microarrays. K. Giguère assisted with quantitative RT–PCR experiments. Members of the Centre de Bioinformatique et de Biologie Computationnelle at Université Laval provided computational assistance. We also thank two anonymous referees for providing constructive comments on a previous version of this article. This research was financially supported by a Natural Sciences and Engineering Research Council of Canada Discovery grant and an E. W. R. Steacie supplement to L.B.
References
Aubin-Horth, N., C. R. Landry, B. H. Letcher and H. A. Hofmann,
Ayala, F. J., and W. M. Fitch,
Basten, C. J., B. S. Weir and Z.-B. Zeng,
Bernatchez, L.,
Bernatchez, L., and J. J. Dodson,
Broman, K. W.,
Bucan, M., and T. Abel,
Buckley, L., E. Caldarone and T. L. Ong,
Ellegren, H., and J. Parsch,
Foster, S. A., and J. A. Baker,
Gibson, G., and B. Weir,
Howard, D. J.,
Lively, S., M. J. Ringuette and I. R. Brown,
Lu, G., and L. Bernatchez,
Lu, G. Q., and L. Bernatchez,
Luikart, G., P. England, D. A. Tallmon, S. Jordan and P. Taberlet,
Luscombe, N. M., S. E. Austin, H. M. Berman and J. M. Thornton,
Lynch, M., and B. Walsh,
Meiklejohn, C. D., J. Parsch, J. M. Ranz and D. L. Hartl,
Orr, H. A.,
Pigeon, D., A. Chouinard and L. Bernatchez,
Rise, M. L., K. R. von Schalburg, G. A. Cooper and B. F. Koop,
Robinson, B. W., and D. Schluter,
Rogers, S. M., and L. Bernatchez,
Schevzov, G., P. Gunning, P. L. Jeffrey, C. Temmgrove, D. M. Helfman et al.,
Shi, C., A. Uzarowska, M. Ouzunova, M. Landbeck, G. Wenzel et al.,
Simpson, P.,
Skúlason, S., and T. B. Smith,
Smith, R. W., R. M. Palmer and D. F. Houlihan,
Trudel, M., A. Tremblay, R. Schetagne and J. B. Rasmussen,
Tusher, V. G., R. Tibshirani and R. Chu,
Wentzell, A. M., H. C. Rowe, B. G. Hansen, C. Ticconi, B. A. Halkier et al.,
West, M. A. L., K. Kim, D. J. Kliebenstein, H. van Leeuwen, R. W. Michelmore et al.,
Williams, R. B. H., C. J. Cotsapas, M. J. Cowley, E. Chan, D. J. Nott et al.,
Wu, H., M. K. Kerr, X. Q. Cui and G. A. Churchill,
