


Abstract
Matings between D. melanogaster females and males of sibling species in the D. melanogaster complex yield hybrid males that die prior to pupal differentiation. We have reexamined a previous report suggesting that the developmental defects in these lethal hybrid males reflect a failure in cell proliferation that may be the consequence of problems in mitotic chromosome condensation. We also observed a failure in cell proliferation, but find in contrast that the frequencies of mitotic figures and of nuclei staining for the mitotic marker phosphohistone H3 in the brains of hybrid male larvae are extremely low. We also found that very few of these brain cells in male hybrids are in S phase, as determined by BrdU incorporation. These data suggest that cells in hybrid males are arrested in either the G1 or G2 phases of the cell cycle. The cells in hybrid male brains appear to be particularly sensitive to environmental stress; our results indicate that certain in vitro incubation conditions induce widespread cellular necrosis in these brains, causing an abnormal nuclear morphology noted by previous investigators. We also document that hybrid larvae develop very slowly, particularly during the second larval instar. Finally, we found that the frequency of mitotic figures in hybrid male larvae mutant for Hybrid male rescue (Hmr) is increased relative to lethal hybrid males, although not to wild-type levels, and that chromosome morphology in Hmr− hybrid males is also not completely normal.
SPECIATION requires reproductive isolation between diverging populations (Mayr 1942). One type of barrier that can isolate emerging species is the inviability or infertility of hybrids. For example, although the species in the Drosophila melanogaster complex (D. melanogaster and its sibling species D. simulans, D. mauritiana, and D. sechellia) are closely related and morphologically almost indistinguishable, matings between D. melanogaster females and males of any of the sibling species yield F1 females that are semiviable but sterile, as well as males that die as developmentally delayed larvae or pseudopupae with small or nonexistent imaginal discs (Sturtevant 1920, 1929; Hadorn 1961; Sánchez and Dübendorfer 1983).
The lethality of hybrid males appears to be due to an incompatibility between one or more genes on the D. melanogaster X chromosome and one or more autosomal genes in the other species (Sturtevant 1920, 1929; Pontecorvo 1943; Hadorn 1961; Hutteret al. 1990; Yamamoto 1992; Brideauet al. 2006). Hybrid lethality is not sex specific, since hybrid females homozygous for the D. melanogaster X chromosome also die at the same stage of development (Hutteret al. 1990; Orr 1993). The X-linked Hybrid male rescue (Hmr) gene in D. melanogaster and the autosomal Lethal hybrid rescue (Lhr) gene in D. simulans are major players in causing this hybrid lethality because loss-of-function alleles in these genes suppress the lethality (Watanabe 1979; Hutter and Ashburner 1987; Barbashet al. 2000, 2003; Brideauet al. 2006). Despite this progress in studying the genetic basis of hybrid male inviability, the developmental causes of the phenomenon remain poorly understood. One study found that hybrid males suffer from limited cell proliferation and proposed that this phenotype is due to a failure in mitotic chromosome condensation (Orret al. 1997). These authors observed that uncultured brain cells have a very low frequency of normally condensed metaphase chromosomes and also found that hybrid females produce only small abdominal clones of D. melanogaster X chromosome tissue. The investigators further found that the brains of hybrid male larvae incubated in 0.7% NaCl and in both the presence and the absence of colchicine (a drug used to arrest cells in metaphase) contained very few normal mitotic figures, but many cells displayed masses of diffuse chromatin. These latter cells were interpreted to have entered a defective mitosis in which the chromatin remains undercondensed relative to that normally seen in the prometaphase/metaphase mitotic figures in neuroblasts from each pure species.
To better understand the nature of the apparent chromosome condensation defects in hybrid male larval brains, we characterized this phenotype with techniques developed since the publication of the earlier report (Orret al. 1997). To our surprise, we found that the frequency of cells in M phase in these brains is extremely low. Although in 0.7% NaCl-incubated brains we observed the same high frequency of cells with masses of diffuse chromatin seen by the previous investigators, we established that these cells were not in mitosis but were instead dying. The very low mitotic index in the brains of male hybrid larvae is reflected in the extremely slow progression of these animals through the second larval instar stage of development. Our results suggest that the cells of hybrid male larvae display physiological defects that prevent mitotic entry and that render them particularly susceptible to cell death when environmentally stressed.
MATERIALS AND METHODS
Fly strains and cultures:
Flies were reared on standard yeast glucose media and raised at 23° on a 12-hr light/12-hr dark cycle. All hybrid crosses were initiated with 1-day-old D. melanogaster virgin females and 5-day-old D. simulans males. D. melanogaster females were either y1 w1 received from the Drosophila stock center (Bloomington, IN) or Df(1)Hmr−, y w v/FM7i, P{w+mC=ActGFP}JMR3 (Barbash and Lorigan 2007). All D. simulans males were vermilion/Y.
Cytology for analysis of mitosis:
Larval brains were dissected, fixed, and squashed as described in Williamset al. (1992) except that incubation in 3.7% formaldehyde was decreased to 20 min. Incubations with antibodies were done overnight at 4° in phosphate saline buffer (PBS) containing 0.1% Triton X (PBT). Rabbit antiphosphohistone H3 (anti-PH3) Upstate, Charlottesville, VA) was used at a 1:500 dilution followed by incubation with tetra-rhodamine-isothiocyanate-conjugated anti-rabbit IgG (Jackson Immunoresearch, West Grove, PA), and DNA was detected by staining with 0.05 μg/ml Hoechst 33742 (Sigma, St. Louis) in PBS for 5 min. Imaging was done on an Olympus BX-50 microscope with a Qimaging Retiga Exi CCD camera (Burnaby, BC, Canada) and MetaMorph 6.1 software (Universal Imaging, Downington, PA).
For aceto-orcein staining, larval brains were dissected in 0.7% NaCl and transferred immediately to a drop of aceto-orcein stain (2% orcein in 45% acetic acid) on a cover slip and squashed onto a glass slide (Gatti and Goldberg 1991). In some experiments, brains were incubated in 0.5 × 10⁻⁵m colchicine in 0.7% NaCl for 0.5, 1, or 2 hr after dissection prior to transfer to aceto-orcein. Mitotic indices were determined as previously described (Williamset al. 1992); briefly, the mitotic index of a sample was defined as the number of PH3-staining mitotic cells per standard field of view at ×1000 magnification. Individual stages of mitosis were scored in PH3-positive cells. Cells in prophase and prometaphase were characterized by their relatively low levels of chromosome condensation. Metaphase figures were scored on the basis of their more highly condensed chromosomes. Anaphase and telophase were identified by the separation of chromatids into distinct populations, but these two stages could not be separately distinguished.
Determination of S phase using bromodeoxyuridine:
Whole dissected brains were incubated in Grace's media with 1 mg/ml 5-bromo 2-deoxyuridine (BrdU; Sigma) for 1 hr and then fixed and permeabilized, and antibody was stained as described in Truman and Bate (1988). Mouse anti-BrdU and rat anti-Elav were used at a dilution of 1:150 in PBT overnight at 4°. These antibodies were received from the Developmental Studies Hybridoma Bank, developed under the auspices of the National Institute of Child Health and Human Development, and maintained by the Department of Biological Sciences, University of Iowa, (Iowa City, IA). After five 10-min washes in PBT, brains were incubated overnight at 4° with the following secondary antibodies: AlexaFluor 488-conjugated donkey anti-mouse (Molecular Probes, Eugene, OR) and Cy3-conjugated donkey anti-rat (Jackson Immunoresearch) diluted to 1:1000 in PBT plus 1% donkey serum. Brains were imaged on a Leica TCS SP2 confocal microscope system.
Cell death assays:
Cell death was assayed using Trypan blue 0.4% (Gibco, Carlsbad, CA) at a 1:100 dilution in PBS. Brains were stained for 10 min and then rinsed for 10 min in PBS. As a positive control, cell death was induced in D. melanogaster y1 w1 brains by treating them for 1 hr in 100 mm cycloheximide immediately before Trypan blue staining.
Apoptosis was detected using Vybrant Apoptosis assay kit no. 2 (Molecular Probes) following the manufacturer's instructions. Whole brains were incubated for 20 min in a 1:4 dilution of Alexa Fluor 488-conjugated annexin V stock solution in annexin-binding buffer (ABB). After a brief rinse in ABB, DNA was additionally counterstained for 5 min using To-Pro-3 (Molecular Probes) at 1 × 10⁻³ dilution in the same buffer. The brains were then mounted in 80% glycerol and imaged immediately on a Leica TCS SP2 confocal microscope. As a positive control, apoptosis was induced in D. melanogaster y1 w1 larvae by incubating dissected brains in 10 mm cycloheximide in 0.7% NaCl for 1 hr followed by recovery in Grace's media (Invitrogen, Carlsbad, CA) at 25° for 30 min before treating as above to detect apoptosis.
Autophagic cell death was detected using LysoTracker Green DND-26 (Molecular Probes) as described in the product manual. Briefly, LysoTracker Green was diluted to 75 nm in Grace's media and warmed to 37°. Dissected brains were incubated in the diluted LysoTracker at 37° for 1 hr before washing with PBS, counterstaining DNA with To-Pro-3 and imaging as above.
Ecdysone feeding:
20-Hydroxyecdysone (Sigma) was diluted to 1 mg/ml in 5% ethanol and mixed with 0.5 g dry yeast to make a yeast paste. Second and third instar larvae were transferred to plates containing the yeast paste and observed over time. Rescue of the developmental block was defined as a significant increase in the percentage of animals undergoing pupariation.
Larval staging and brain-size estimation:
Females were allowed to lay eggs for a 24-hr period, and progeny were assayed for stage of development every 24 hr after removal of adults. Larvae were staged by characterizing either mouth hook morphology or tracheal development. Mouth hooks were dissected from larvae and imaged at ×400 magnification. Second instar larvae have only 5–15 teeth/mouth hook, while third instar larvae have 20–30 teeth/mouth hook (Demerec 1950). For staging of live animals, larvae with unextended, balled trachea were classified as second instars, while larvae with extended trachea and inflated spiracles were classified as third instars (Parket al. 2002).
Brain sizes were measured as the length of the ventral ganglion and width of the distance between the center of the larval brain hemispheres. Size was also estimated in squashes by the number of fields of view that each brain occupied at ×100 magnification.
RESULTS
Developmental delays in hybrid males:
It has long been known that the F1 males resulting from crosses between D. melanogaster mothers and sibling-species fathers develop more slowly than their sister F1 females or animals from either pure species (Sturtevant 1929; Sánchez and Dübendorfer 1983). Since these developmental delays have never been described in detail, we took a closer look at the progression of hybrid males through the three larval instar stages and the pupal stage. Using the morphologies of both the mouth hooks and tracheal spiracles as markers to stage larvae (see materialsandmethods), we found that, in comparison with controls, the hybrid males progressed more slowly through each postembryonic stage (Table 1) and died with high frequencies at each step (Table 2). Controls included males and females of each pure species, hybrid females, and hybrid males rescued by a deletion of the Hmr gene, Df(1)Hmr−.
Days post-egg deposition taken to reach indicated stage of development
Genotypea | First instar | Second instar | Third instar | Pupal | n |
|---|---|---|---|---|---|
| Hmr−/FM7 D. melanogaster females | 1.3 ± 0.45 | 2.6 ± 0.62 | 3.7 ± 0.42 | 6.8 ± 0.35 | 903 |
| Hmr−/Y D. melanogaster males | 1.2 ± 0.24 | 2.4 ± 0.48 | 3.6 ± 0.36 | 6.7 ± 0.41 | 576 |
| y1w1 D. melanogasterb | 1.2 ± 0.29 | 2.2 ± 0.62 | 3.5 ± 0.53 | 6.8 ± 0.48 | 862 |
| vsimD. simulansb | 1.3 ± 0.26 | 2.1 ± 0.47 | 3.4 ± 0.40 | 6.9 ± 0.43 | 625 |
| FM7/Xsim hybrid females | 1.2 ± 0.21 | 2.0 ± 0.53 | 3.0 ± 0.38 | 6.3 ± 0.30 | 398 |
| FM7/Ysim hybrid males | 2.1 ± 0.56 | 4.1 ± 2.61 | 11.5 ± 4.8 | 12.1 ± 1.17 | 472 |
| Hmr−/Xsim hybrid females | 1.3 ± 0.26 | 2.4 ± 0.46 | 3.6 ± 0.55 | 6.9 ± 0.69 | 637 |
| Hmr−/Ysim hybrid males | 1.5 ± 0.54 | 3.0 ± 0.81 | 4.4 ± 0.91 | 7.9 ± 1.90 | 452 |
D. simulans chromosomes are indicated with the subscript “sim.”
Males and females were counted together.
Lethality during indicated developmental stage
% lethality | ||||
|---|---|---|---|---|
| Genotypea | First instar | Second instar | Third instar | Pupal |
| Hmr−/FM7 D. melanogaster females | 2.1 | 1.1 | <1% | 1.0 |
| Hmr−/Y D. melanogaster males | 2.0 | 0.9 | <1% | 1.1 |
| y1w1 D. melanogasterb | 1.0 | <1% | <1% | 1.2 |
| vsim D. simulansb | 1.1 | 1.2 | 1.2 | 2.1 |
| FM7/Xsim hybrid females | 2.3 | 1.5 | 2.3 | 1.4 |
| FM7/Ysim hybrid males | 5.3 | 19.4 | 68.6 | 6.8 |
| Hmr−/Xsim hybrid females | NAc | 1.2 | 1.8 | 1.2 |
| Hmr−/Ysim hybrid males | NAc | 2.8 | 3.8 | 2.4 |
Larvae were raised at 23° and all n's are >100.
D. simulans chromosomes are indicated with the subscript “sim.”
Males and females were counted together.
Rescued hybrids were not scored at first instar.
Developmental delay was particularly notable in the period preceding the molt into the third instar. While wild-type animals of either species spent only ∼1 day as second instar larvae, F1 hybrid males remained in the second instar for >7 days on average. There was considerable variation in the length of the second instar period. The slowest-developing hybrid male second instars remained in that stage for 11–12 days (that is, until ∼15 days after egg deposition). These animals became very large and could thus be mistaken for small third instars (Figure 1A), but the mouth hook and tracheal markers confirmed that they were indeed in the second instar. All of these large second instars failed to molt and were thus responsible for the elevated lethality observed during the second instar phase (Table 2). The majority (75.3%) of hybrid males eventually became third instars (Figure 1B). Most of these failed to pupariate and died as third instars within 2–3 days of the second-to-third instar molt. A small number of hybrid males (6.7% of the total) pupariated; these tended to be the individuals that had progressed most quickly through the second instar phase. In all cases, pupariating animals died within 24 hr. Less than 1% of hybrid males were still alive at 16 days post-egg deposition.
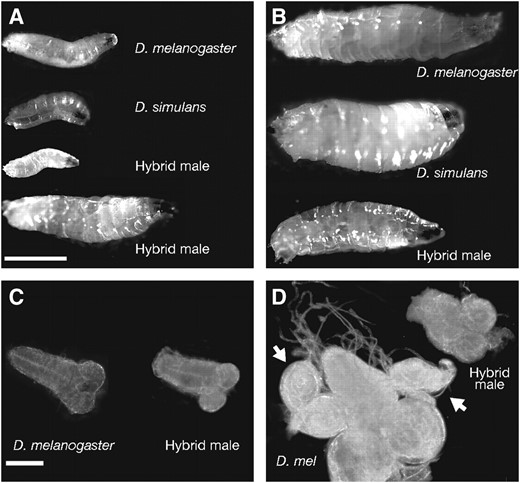
Developmental progress of hybrid males. (A) Second instar hybrid males are smaller than pure species of the same age, but they can continue to grow and become much larger than wild-type second instars. The smaller and larger hybrid male second instar larvae (bottom) are 6 and 12 days post-egg deposition, respectively. (B) Third instar male larvae are smaller than those of either pure species, but considerably larger than second instar hybrids. The hybrid third instar is 12 days post-egg deposition. Bar, 1 mm for A and B. (C) Brains from hybrid second instar larvae are slightly smaller than those of the corresponding pure-species stage (2.4 vs. 2.6 mm in length on average; n > 20). (D) By the third instar, the discrepancy in brain size becomes more obvious (3.2 vs. 5.3 mm in length on average; n > 20). Hybrid male third instar larvae also lack the imaginal discs seen in the pure species (arrows). Bar, 0.5 mm for C and D.
Defects in ecdysone-induced behavior:
Normal-sized hybrid second instar larvae initiated the normal premolting behaviors of moving their bodies in an anterior–posterior fashion and biting with their mouth hooks to free the cuticle (Parket al. 2002). However, these animals often failed to molt, even after 30 min of trying, and returned to a wandering pattern of behavior.
As molting behaviors are induced by ecdysone (Parket al. 2002), we attempted to rescue these phenotypes by feeding the larvae 20-hydroxyecdysone at different stages of larval development (see materialsandmethods). This feeding, regardless of the protocol used, failed to rescue either the slow rate of development or the extended attempts at molting exhibited by hybrid males (data not shown). However, 20-hydroxyecdysone was able to rescue the molting ability of control second or third instar larvae homozygous for mutations in the Eip75B gene, a gene that responds early within the ecdysone-induction pathway (Segraves and Hogness 1990; data not shown). These results suggest that the developmental and behavioral abnormalities encountered by hybrid male larvae are unlikely to reflect defects in pathways mediated by ecdysone.
Low mitotic frequencies in hybrid male larvae:
It was previously proposed (Orret al. 1997) that many cells in the brains of hybrid male larvae enter mitosis, but fail to condense their chromosomes properly and thus arrest in an aberrant prophase-like stage. To characterize these apparent mitotic defects in more detail, we examined preparations of larval brains stained either with orcein or with a combination of Hoechst 33742 (for DNA) and an antibody to anti-PH3 to track mitotic chromatin (Hendzelet al. 1997). We were surprised to find a nearly complete absence of mitotic figures in second instar hybrid male brains: usually only 0–1 cells/brain stained positive with anti-PH3. Third instar hybrid male larval brains displayed more, but still very few, mitotic figures (<10), as compared with several hundred PH3-staining cells in control single-species brains from the same developmental stage (data not shown).
Of the few mitotic figures that were seen in the brains of hybrid male larvae, almost all were in prophase/prometaphase (79%) or metaphase (20%), with <1% in anaphase/telophase (Table 3). In contrast, ∼20% of mitotic figures from pure-species males are in anaphase/telophase. These data suggest that there is a mitotic defect in the very small number of hybrid male cells that do enter mitosis. The increased frequency of cells in prophase/prometaphase suggests that at least some of these defective cells arrest prior to activation of the spindle assembly checkpoint. The deletion of Hmr in male hybrids returned the proportion of mitotic figures in anaphase/telophase to near pure-species ratios, but the mitotic index remained somewhat lower than the controls (Table 3). Chromosome morphology in the rescued hybrid male larvae was often unusually elongated and stringy (Figure 2, A and B). Thus, although the deletion of Hmr rescues the lethality of hybrid males, cell cycle progression in these animals is not completely normal.
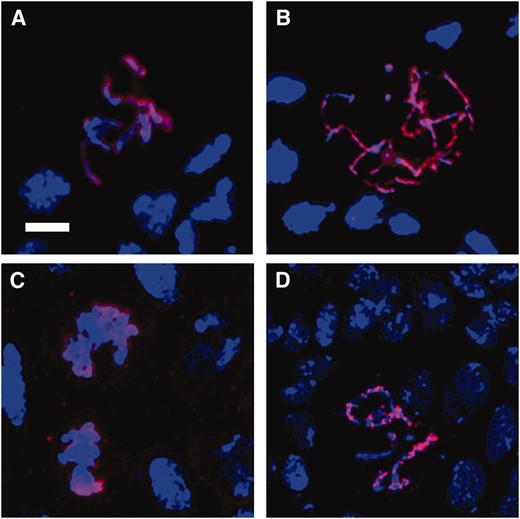
Chromosome morphology in hybrid brains. In A–D, DNA is shown in blue and PH3 in red. (A) D. simulans mitotic figure with condensed and clearly defined chromosomes. (B) Many (>50%) mitotic figures in Df(1)Hmr− hybrid male larval brains show a diffuse thread-like chromosome morphology. (C) In FM7/Xsim hybrid females, mitotic chromosomes are generally undercondensed, despite their positive PH3 signal. (D) Df(1)Hmr−/Xsim hybrid female with normal-appearing mitotic chromosomes. Bar, 5 μm.
Percentage of mitotic figures in pure species and hybrid third instar larvae
% of mitoses in indicated stage | Average no. of fields/brain | No. of fields examined | ||||
|---|---|---|---|---|---|---|
| Genotypea | Prophase/prometaphase | Metaphase | Anaphase/telophase | Mitotic index | ||
| D. melanogaster males | 70 | 10 | 20 | 0.56 | 103 | 947 |
| D. melanogaster Hmr− males | 71 | 10 | 19 | 0.60 | 109 | 526 |
| D. melanogaster females | 69 | 11 | 20 | 0.57 | 111 | 511 |
| D. simulans males | 70 | 11 | 19 | 0.59 | 106 | 932 |
| D. simulans females | 68 | 10 | 22 | 0.58 | 114 | 496 |
| FM7/Ysim hybrid males | 79 | 20 | <1 | 0.13 | 20 | 532 |
| Hmr−/Ysim hybrid males | 70 | 13 | 17 | 0.33 | 81 | 776 |
| FM7/Xsim hybrid females | 52 | 3 | 45 | 1.04 | 92 | 404 |
| Hmr−/Xsim hybrid females | 69 | 12 | 18 | 0.80 | 104 | 628 |
D. simulans chromosomes are indicated with the subscript “sim.”
Consistent with the low levels of mitosis seen in the larval brains of the male hybrids, these brains were smaller in size than those of control second or third instar larvae (Figure 1, C and D; see also the “Average no. of fields/brain” column in Table 3), as noted previously by Orret al. (1997). This difference was particularly stark for third instars, where the total volume of hybrid male brains was only about one-fifth that of control brains (Figure 1D; Table 3). We measured the mitotic index (defined as the number of mitotic figures per field of view) to normalize the amount of mitosis relative to the brain volume and found that the mitotic index of third instar hybrid brains was decreased by roughly fourfold relative to the single species at the same developmental stage (Tables 3 and 4). A similar reduction in the mitotic index was also observed in second instar larvae. The absence of cell division in hybrid larvae was not restricted to the brains; these larvae also showed a near complete absence of imaginal disc tissue (Figure 1D), as previously reported (Seiler and Nothiger 1974; Sánchez and Dübendorfer 1983).
Mitotic indices of larval brain cells before and after colchicine treatment
Stage | 0 mina | 60 min | 120 min |
|---|---|---|---|
| D. melanogaster | |||
| Second instar | |||
| 0.7% NaCl | 0.45 | 0.43 | 0.42 |
| +colchicine | ND | 0.91 | 1.96 |
| Third instar | |||
| 0.7% NaCl | 0.68 | 0.72 | 0.63 |
| +colchicine | ND | 1.59 | 3.45 |
| Xmel/Ysim hybrid | |||
| Second instar | |||
| 0.7% NaCl | 0.078 | 0.057 | 0.061 |
| +colchicine | ND | 0.063 | 0.074 |
| Third instar | |||
| 0.7% NaCl | 0.15 | 0.16 | 0.15 |
| +colchicine | ND | 0.14 | 0.13 |
Mitotic indices were calculated as the number of PH3-positive cells per microscope field. Fifteen or more brains were examined for each data point. ND, not determined.
Amount of time cultured after dissection but prefixation.
In a further attempt to gauge the frequency of mitosis in hybrid males, we cultured larval brains in colchicine, a drug that inhibits microtubule polymerization and thus arrests cells in mitosis. When the brains of control pure-species larvae were treated with colchicine in 0.7% NaCl [the solution normally employed for cytological analysis in Drosophila (Gatti and Goldberg 1991)], mitotic indices increased roughly twofold after 1 hr and fourfold after 2 hr of incubation (Table 4). In contrast, the frequency of mitosis in hybrid brains did not increase even after 2 hr of colchicine treatment. This latter result is consistent with the idea that the brains of hybrid larvae have very few cells competent to enter mitosis.
Interestingly, cells in hybrid females also appear to encounter difficulties in cell cycle progression, although these problems may be of a different nature. First, few of the PH3-positive mitotic figures in hybrid female larval brains display the degree of chromosome condensation characteristic of metaphase (Table 3; Figure 2C). Second, the mitotic index of female hybrid brains is ∼1.8 times higher than that of males or females in the single species, while at the same time an unexpectedly high proportion of cells in female hybrid brains are in anaphase/telophase (Table 3). Such problems in cell cycle progression may explain the sterility of adult hybrid females, since extensive cell division is required for amplification of the female germline and for oogenesis. This hypothesis is supported by our finding that deletion of D. melanogaster Hmr in hybrid females normalizes both mitotic progression (Table 3) and chromosome condensation (Figure 2D) and by the previous observation that Hmr deletion partially suppresses the sterility of these animals (Barbash and Ashburner 2003).
Low frequency of S phase in the brains of hybrid male larvae:
Since few cells in hybrid male larval brains are in M phase, we also wanted to determine by BrdU incorporation whether any of these cells were in S phase. In the brains of third instar larvae from the pure species, the majority of DNA replication occurs in two bands in each optic lobe, the inner and outer optic lobe anlage, and in a set of neuroblasts scattered throughout the central brain and ventral nerve cord (Figure 3, A and B). In contrast, smaller third instar hybrid male brains displayed no BrdU incorporation (Figure 3C), while only a small number of cells were replicating their DNA in larger hybrid brains (Figure 3D). The low levels of DNA replication and mitosis seen in hybrid larval brains suggest that the large majority of the neural precursor cells are unable to enter either S or M phases, but these data do not discriminate between arrest in G1 or G2 phases.
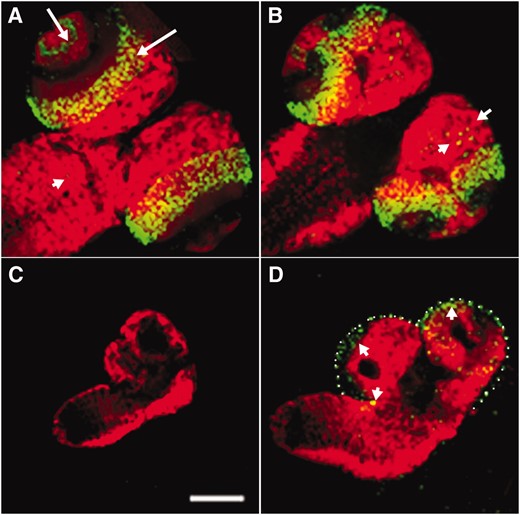
Hybrid male larval brains lack cells in S phase. (A and B) Wild-type D. melanogaster brains incorporate substantial BrdU in the developing optic lobe (long arrows; antibody against BrdU is in green). Some scattered neuroblasts are also observed to undergo DNA replication (short arrows). As a counterstain, differentiated neurons are marked by anti-Elav (red). (C and D) Brains from third instar hybrid larvae have no (C) or few (short arrows in D) BrdU-incorporating cells. Because hybrid male brains have poorly developed optic lobes, the outline of the brain tissue in D is shown with white dots. Incubation of dissected brains in the presence of BrdU was done in Grace's media to avoid potential artifacts (see Figure 5; Table 5). Bar, 0.5 mm.
High levels of necrotic cell death in the cultured brains of hybrid male larvae:
Orret al. (1997) reported that when the brains of hybrid (D. melanogaster/D. mauritiana) male larvae were cultured in the presence or absence of colchicine in 0.7% NaCl, there was a dramatic increase in the number of cells displaying dense but diffuse chromatin. These authors interpreted such cells as being arrested in an early stage of mitosis, with chromatin more condensed than interphase chromatin but less condensed than the chromatin seen in metaphase mitotic figures. Even though we examined hybrids between D. melanogaster and a different sibling species (D. simulans), we were able to reproduce these results: cultured brains from hybrids but not from D. melanogaster rapidly filled with cells showing this aberrant chromosome morphology (Figure 4, A–D; Table 5). However, the fact that the PH3-positive mitotic index does not increase when the brains of hybrid males are exposed to 0.7% NaCl in the presence or absence of colchicine indicates that these cells are not actually in mitosis (Table 4; Figure 4, E–H).
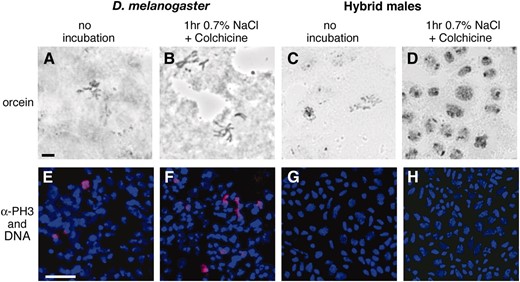
Cells with aberrant nuclear morphology seen in the cultured brains of hybrid males are not in mitosis. (A, B, E, and F) Control D. melanogaster third instar larval brains. (C, D, G, and H) Hybrid male third instar larval brains. The brains in A, C, E, and G were squashed immediately after dissection, while those in B, D, F, and H were examined after a 1-hr incubation in colchine. (A–D) Orcein-stained brain squashes. The mitotic index in pure-species brains increases after colchicine treatment (A and B). Approximately 25% of the cells in hybrid male larval brains develop an abnormally dense chromatin morphology after the same treatment (C and D). Bar, 5 μm for A–D. (E–G) Brain squashes stained for DNA (blue) and PH3 (red) to visualize mitotic chromosomes. The mitotic index as measured by PH3 staining increases in pure species with colchicine incubation (E and F), but few cells in hybrids stain with PH3 in the presence or absence of colchicine (G and H). Bar, 15 μm for E–H.
Percentage of aberrant cells in larval brains
Stage | 0 mina | 60 min | 120 min |
|---|---|---|---|
| D. melanogaster | |||
| Second instar | |||
| 0.7% NaCl | 0 | 0 | 2.8 |
| Grace's media | 0 | 0 | 0 |
| Third instar | |||
| 0.7% NaCl | 0 | 0 | 3.1 |
| Grace's media | 0 | 0 | 0 |
| Hybrid male | |||
| Second instar | |||
| 0.7% NaCl | 3 | 23.8 | 48.6 |
| Grace's media | 2.8 | 3.7 | 4.8 |
| Third instar | |||
| 0.7% NaCl | 3.5 | 27.9 | 47.2 |
| Grace's media | 3.6 | 4.2 | 5.1 |
Percentage of total cells showing aberrant chromatin morphology. Ten or more brains were examined for each data point.
Amount of time cultured after dissection prefixation.
When male hybrid brains were incubated in Grace's media instead of 0.7% NaCl, the frequency of cells showing aberrant nuclear morphology decreased by 85% (Table 5). This result suggests that the changes in the appearance of chromatin are mostly an artifact of incubation in 0.7% NaCl. However, freshly dissected hybrid male larval brains that either were placed into Grace's media or were immediately prepared for cytological analysis without any incubation showed a low frequency (2–4%) of aberrant cells (Table 5). It thus appears that 0.7% NaCl hastens a process that had already begun in hybrid larval brains prior to exposure to the salt solution.
We suspected that the cells with aberrant nuclear morphology were undergoing cell death, so we stained larval brains with the vital dye Trypan blue, which labels degenerating cells (Krebs and Feder 1997). Although control brains incubated in 0.7% NaCl for 1 hr had few if any cells that stained with this dye, a very high percentage of cells in identically treated hybrid male larval brains were positive for Trypan blue (Figure 5, A and B). The levels of cell death were roughly equivalent to those achieved by exposing larval brains from either pure species to cycloheximide for 1 hr to induce apoptosis (Figure 5C). Cell death was much reduced (although still visible in a few cells) in hybrid male brains incubated in Grace's media (Figure 5D).
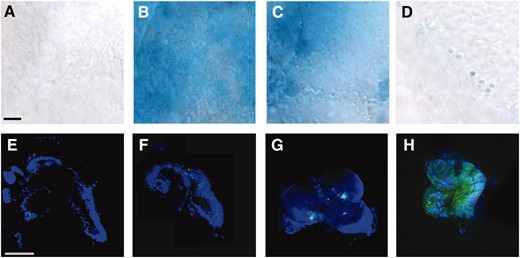
Cell death is increased in 0.7% NaCl cultured third instar hybrid male brains. (A–D) Trypan blue staining of dead cells. The surface of the central region of a single brain hemisphere is shown in A–H. (A) D. melanogaster brain showing no cell death after incubation in 0.7% NaCl for 1 hr. (B) Hybrid male brains incubated under the same conditions show massive cell death. (C) As a positive control, D. melanogaster brains cultured in 10 mm cycloheximide for 1 hr and allowed to recover for 30 min to induce cell death similarly show intensive staining with Trypan blue. (D) Hybrid male brains incubated in Grace's media for 1 hr instead of 0.7% NaCl. The number of dead cells is greatly diminished. Single-species brains incubated in Grace's media had virtually no Trypan blue staining (data not shown). Bar, 50 μm for A–D. (E–H) Annexin V staining to visualize apoptosis. Neither D. melanogaster (E) nor hybrid brains incubated in 0.7% NaCl (F) or Grace's media (G) display many apoptotic cells. (H) A positive control in which apoptosis was induced in D. melanogaster brains by cycloheximide. Bar, 1 mm for E–H.
Further characterization of the dead or dying cells in the brains of hybrid male larvae after salt treatment suggests that this phenotype is the result of necrosis rather than apoptosis or autophagy. Although there was a reproducible, slight elevation of apoptosis in these brains as determined by detection of the apoptotic marker annexin V (vandenEijndeet al. 1998), the frequency of apoptotic cells was far too low to explain the high prevalence of cell death (Figure 5, E–H). When hybrid larval brains in 0.7% NaCl were stained with Lysotracker, which measures pH changes in lysosomes indicative of autophagic cell death (Anderson and Orci 1988), little if no staining was observed (data not shown).
Hybrid male larvae also contained obvious melanotic masses, primarily in gut tissues but also occasionally in salivary glands (Figure 6). These melanotic masses might be caused by cell death, but they could also result from an aberrant immune response generated in these unhealthy larvae (Minakhina and Steward 2006).
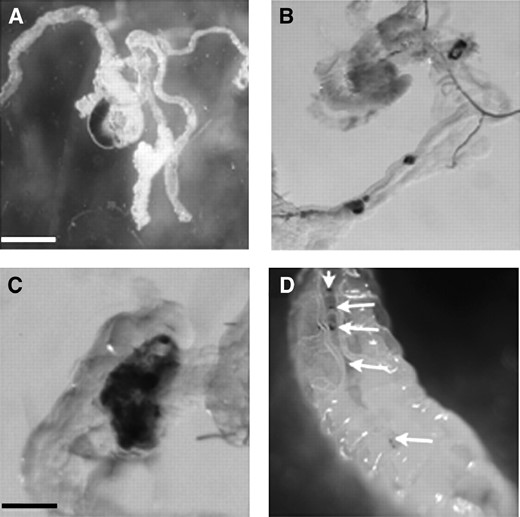
Naturally forming melanotic tumors from third instar hybrid males. These tumors form primarily in gut tissue (A–C), although they also develop in salivary glands (not shown). Bar, 100 μm for A and B; 250 μm for C. (D) Lower magnification of several gut tumors in a single larvae.
DISCUSSION
Although hybrid incompatibility between D. melanogaster and its sibling species was first studied in the 1920s (Sturtevant 1920, 1929), the cellular and developmental basis of hybrid male lethality remains unknown. To our knowledge, the first direct examination of this issue was performed by Orret al. (1997), who proposed that hybrid lethality was caused by mitotic defects associated with failure of proper chromosome condensation. The results reported here verify that hybrid male larvae in fact do suffer from problems in cell proliferation. However, we find that these defects largely reflect the inability of cells to enter mitosis; cells in hybrid male larval brains are not, as described in the previous study, subject to cell cycle arrest that occurs after M phase has initiated. The failure of most cells to enter mitosis would explain not only the almost total absence of brain cells that stain positive for phosphohistone H3 (Figure 4, E–H), but also the small brain size and the absence of imaginal discs in hybrid male larvae (Figure 1; see also Seiler and Nothiger 1974; Sánchez and Dübendorfer 1983). Since there is virtually no incorporation of BrdU in hybrid male brains (Figure 3), it is clear that very few cells are in S phase at any particular time, so the majority of cells must instead be arrested in either G1 or G2 phases.
Our results further suggest that cells in the brains of hybrid males are particularly sensitive to environmental stress. Incubation of brain tissue from hybrid male larvae in 0.7% NaCl, a solution thought to be of physiological osmolarity and widely used for studying Drosophila cytology (Gatti and Goldberg 1991), induces considerable cell death (Figure 4). We believe that the aberrant nuclear morphology reported by Orret al. (1997) and interpreted as incomplete mitotic chromosome condensation is mostly the result of artifactual cell death resulting from exposure to 0.7% NaCl (Table 5). With the benefit of hindsight, the results of these previous investigators do not comfortably fit their hypothesis of a mitotic arrest. The proportion of cells with aberrant nuclear morphology after 90 min of incubation was reported to be >25%, a frequency more than five times higher than the mitotic index of the strongest known metaphase-arrest mutants in Drosophila (Gatti and Goldberg 1991). Past experience thus suggests that such a high percentage of cells are highly unlikely to enter mitosis within a few hours of incubation. Moreover, the interpretation of Orret al. (1997) fails to explain the much lower frequency of such cells (0.25%) that they observed in freshly dissected hybrid brains. If 0.7% NaCl is truly physiological and the cells with aberrant nuclear morphology represent mitotic arrest, one would expect that their frequency would be high prior to incubation as well.
The most straightforward interpretation of our results is that cellular physiology in hybrid male larvae is substantially altered, leading in vivo to a dramatic decline in the rate of cell proliferation and a modest increase in the level of cell death. Many of the surviving cells are sensitized to environmental conditions and die readily by necrosis after exposure to 0.7% NaCl. We found that the induction of cell death by 0.7% NaCl occurs in dissected tissue and that the slow development of hybrid male larvae is not rescued by treatment with 20-hydroxyecdysone. Imaginal discs from D. melanogaster/D. mauritiana hybrid males are capable of growth and differentiation when transplanted into D. melanogaster hosts, suggesting that hybrid lethality is not strictly cell autonomous (Sánchez and Dübendorfer 1983). Hybrid tissues of lethal genotypes, however, do show a severe cell-autonomous growth disadvantage. Clonal analysis experiments showed that clones homozygous or hemizygous for the D. melanogaster X induced in hybrid females are extremely small and thus proliferation deficient; the growth defects of the clones are not rescued by adjacent X/X nonclonal hybrid tissue (Sánchezet al. 1994; Orret al. 1997).
While our results provide little direct guidance about the molecular basis of hybrid lethality, they do affirm that hybrids are defective in cellular physiology and proliferation. Since we have shown that the lethality of hybrid larvae does not reflect arrest in M phase, what alternative mechanisms are plausible? A recent microarray-based transcriptional profiling comparison of lethal and viable [Df(1)Hmr−-rescued] hybrids found a surprisingly small magnitude of transcriptional differences between these genotypes, suggesting that hybrid lethality is also not caused by large-scale transcriptional misregulation. Recent studies instead hint that hybrids may have defects in chromatin structure. PalBhadraet al. (2006) found that dosage compensation proteins fail to localize to the hybrid male X chromosome. Dosage compensation defects are unlikely to be the sole explanation of hybrid lethality because this lethality is fully penetrant in both males and females that are hemizygous or homozygous for the D. melanogaster X chromosome. These results, however, do suggest that the hybrid male X chromosome has an aberrant chromatin structure, since proper localization of dosage compensation proteins requires a unique X chromosome chromatin state (reviewed in Akhtar 2003). Brideauet al. (2006) recently found that the hybrid lethal gene Lhr encodes a protein that interacts and colocalizes with heterochromatin protein 1 (HP1). Greilet al. (2007) also independently found that LHR (alternatively referred to as HP3) colocalizes with HP1 and depends on HP1 for its correct localization in cultured cells. The requirement of HP1 for the maintenance of heterochromatin states (Eissenberg and Elgin 2000) suggests the possibility that hybrid lethality may result from an altered structure of heterochromatin. Mechanistic studies of Lhr and Hmr will be required to test these speculations and to understand why cells do not proliferate properly in hybrids.
Footnotes
Communicating editor: R. S. Hawley
Acknowledgement
We thank H. Allen Orr and Patrick Ferree for helpful comments. This work was supported by National Institutes of Health grants to D.A.B. (5R01GM074737-02) and to M.L.G. (5R01GM048430-14). Antibodies were received from the Developmental Studies Hybridoma Bank at the University of Iowa (Iowa City, IA).
References
Barbash, D. A., and J. G. Lorigan,
Barbash, D. A., D. F. Siino, A. M. Tarone and J. Roote,
Hadorn, E.,
Hendzel, M. J., Y. Wei, M. A. Mancini, A. Van Hooser, T. Ranalli et al.,
Pontecorvo, G.,
Sánchez, L., and A. Dübendorfer,
Seiler, T., and R. Nothiger,
Sturtevant, A. H.,
Watanabe, T. K.,
Yamamoto, M. T.,
