


Abstract
The developmental gene optomotor-blind (omb) encodes a T-box-containing transcription factor that has multiple roles in Drosophila development. Previous genetic analyses established that omb plays a key role in establishing the abdominal pigmentation pattern of Drosophila melanogaster. In this report we examine patterns of omb nucleotide variation in D. polymorpha, a species that is highly polymorphic for the phenotype of abdominal pigmentation. Haplotypes at this locus fall into two classes that are separated by six mutational steps; five of these mutational events result in amino acid changes. Two lines of evidence are consistent with a role for omb in the abdominal pigmentation polymorphism of D. polymorpha. First, we find that haplotype classes of omb are correlated with abdominal pigmentation phenotypes, as are microsatellite repeat numbers in the region. Second, tests of selection reveal that the two haplotype classes have been maintained by balancing selection. Within each class there is a significantly low amount of diversity, indicative of previous selective sweeps. An analysis including D. polymorpha's closest relatives (members of the cardini group) provides evidence for directional selection across species. Selection at this locus is expected if omb contributes to variation in abdominal pigmentation, since this trait is likely of ecological importance.
THE gene optomotor-blind (omb) is one of the essential “toolkit” genes used to coordinate development in diverse animal taxa (Carroll et al. 2001). The omb locus encodes a T-domain transcription factor (Pflugfelder et al. 1992a,b) that plays key patterning roles in the central nervous system (Brunner et al. 1992; Pflugfelder et al. 1992b; Poeck et al. 1993) and leg and wing imaginal discs (Grimm and Pflugfelder 1996; Lecuit et al. 1996; Nellen et al. 1996) of Drosophila melanogaster. The T-domain is a highly conserved region that functions in DNA binding (Pflugfelder et al. 1992a; Kispert and Herrmann 1993; Kispert et al. 1995). The T-box family is named after its founding member, the mouse Brachyury (T) gene (Bollag et al. 1994).
In addition to its early developmental roles, omb is necessary for patterning the pigment band in each adult abdominal segment: in the developing pupa, omb is expressed at the posterior edge of each abdominal segment in a stripe that prefigures the pigment band of the adult (Kopp and Duncan 2002). omb loss-of-function clones lose pigmentation and overexpression of omb leads to expansion of the pigment band (Kopp and Duncan 1997). The pattern and extent of the pigment band is a character that is highly variable in the genus (reviewed in True 2003; Wittkopp et al. 2003a), differing among species groups (Garcia-Bellido 1983; Gompel and Carroll 2003), between closely related species (Hollocher et al. 2000), between sexes within a species (Kopp et al. 2000), and geographically within a species (Heed 1963; Lee 1963; Robertson et al. 1977; Ohnishi 1985). The control of pigmentation in D. melanogaster by omb suggests that omb may also be important in specifying this natural variation within and between species of Drosophila.
To explore omb's role in abdominal pigmentation variation, we examined patterns of nucleotide variation at the omb locus in natural populations of a South American species of fruit fly, D. polymorpha. D. polymorpha is a member of the cardini group, members of which exhibit extensive abdominal pigmentation variation, both within and between species (Stalker 1953; Heed 1963; Heed and Russell 1971; Hollocher et al. 2000). D. polymorpha is one of the most polymorphic members of this group, with individuals that vary from having almost completely pigmented abdomens to having almost completely unpigmented abdomens (da Cunha 1949; Martinez and Cordeiro 1970). Although abdominal pigmentation is environmentally determined in some species (David et al. 1990; Gibert et al. 1996), early crossing experiments determined that the abdominal pigmentation polymorphism in D. polymorpha has a strong genetic basis. The trait was initially attributed to a single locus with two alleles (da Cunha 1949), but later experiments indicated the action of at least one additional modifier locus (Martinez and Cordeiro 1970). The variation exhibited by this species is due in part to differences in the width of the posterior pigment band, the character that omb patterns in D. melanogaster (Kopp and Duncan 1997).
We approached the role of omb in controlling pigmentation variation in D. polymorpha from two complementary angles. First, we asked if there is a correlation between omb haplotypes and abdominal pigmentation phenotypes of D. polymorpha. Second, we investigated whether there is a signature of selection in omb haplotypes from natural populations of D. polymorpha. Abdominal pigmentation is likely to be an ecologically relevant character and has been hypothesized to play roles in sexual selection, crypsis, and/or thermal regulation (Kettlewell 1973; Gibert et al. 1998; Majerus 1998; True 2003). Consequently, any gene contributing to this character should be constrained or promoted by selection. Our findings from both approaches are consistent with a role for omb in the evolution of abdominal pigmentation variation in this species.
MATERIALS AND METHODS
Isolation and sequencing of haplotypes at the omb locus:
Thirteen different species were used in this study. D. parthenogenetica, D. similis, D. nigrodunni, D. procardinoides, D. cardinoides, D. cardini, D. dunni, D. neomorpha, and D. polymorpha are all members of the cardini group, which is distributed throughout the Caribbean as well as the North, Central, and South American mainlands (Heed and Krishnamurthy 1959; Heed and Russell 1971). D. parthenogenetica, D. nigrodunni, D. procardinoides, D. melanica, D. arawakana, and D. dunni were obtained from the National Drosophila Species Resource Center, Tucson (stock nos. 15181-2221.00, 15182-2311.01, 15181-2241.00, 15030-1141.03, 15182-2261.00, and 15182.2301.00, respectively). D. cardinoides, D. cardini, D. neomorpha, and D. polymorpha were obtained from wild-caught collections in Brazil by J. A. Brisson in March through April of 2001 and March through May in 2002. D. virilis has been maintained in the laboratory of I. Duncan for a number of years. Sequences from D. pseudoobscura and D. melanogaster were obtained from their respective genome projects. Genomic DNA was extracted from individual flies using the DNeasy tissue kit (QIAGEN, Valencia, CA). omb haplotypes were obtained from all of these species and from 120 individuals of D. polymorpha collected from natural populations.
The omb locus in D. melanogaster consists of eight exons and encodes a mature transcript of 4.1 kb, as depicted in Figure 1
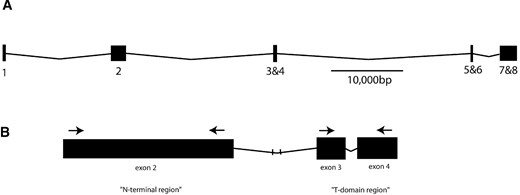
(A) The omb locus of D. melanogaster showing the distribution of exons (numbered) in boxes and introns as lines. (B) Areas of omb used in this study, including portions of the N-terminal domain and the T-domain. Arrows represent locations of primers used for PCR amplification.
(Pflugfelder et al. 1992b). We used the D. melanogaster omb sequence to design a number of primer pairs. One pair, 370for (5′-CCAGGTTCGCCAATGGGATG-3′) and 1355rev (5′-GGTGATGACCATTTCCGTGC-3′), successfully amplified an ∼1-kb N-terminal product in D. virilis, D. melanica, and D. polymorpha, homologous to exon 2 of D. melanogaster. This D. polymorpha sequence was then used to design the cardini group specific primers ombfor (5′-GACGACCCCATCGTCCTC-3′) and ombrev (5′-CACTGACTTCAGCGTCTCGT-3′). Standard PCR using KlenTaq1 (Barnes 1992), which has a very low error rate (5.1 × 10⁻⁵ errors/bp), was performed with 30 cycles of 30 sec at 95°, 30 sec at 50°, and 3 min at 72° followed by a 10-min final extension. For most species, amplified DNA was sequenced directly. However, to perform a more in-depth intraspecific study of the locus in D. polymorpha and to allow direct determination of haplotypes, we cloned amplified DNA into the pSTBlue-1 vector using the Acceptor Vector cloning kit (Novagen, Cambridge, MA). Cloned DNA was sequenced on both strands using the vector-specific primers T7 and U19 (Novagen) and the internal primers ombrev2 (5′-ATTCTGGAGCTGGCAATTATCG-3′) and ombfor2 (5′-AGACCCGGATGATGCGGTCC-3′). Products of the sequencing reactions were purified using CentriSep spin columns (Princeton Separations) and electrophoresed on a Basestation automated sequencer (MJ Research, Watertown, MA). Divergent sequences were reamplified and sequenced directly to check for PCR artifacts.
The degenerate primers Tboxfor (5′-TGCAGACAAATGTTYCCNCARATG-3′) and Tboxrev (5′-AAATGAAACAACYTTYTGCATCCA-3) were designed from an alignment of known omb orthologs in GenBank and used to amplify an ∼250-bp segment of the omb T-domain homologous to portion of exons 3 and 4 in D. melanogaster. These exons are separated by a short (65 bp) intron. Touchdown PCR was used from 65° to 41° followed by 28 cycles of 94° for 1 min, 55° for 1 min, and 72° for 2 min. Species other than D. polymorpha were sequenced directly using the Tboxfor and Tboxrev primers. Alleles from 10 individuals of D. polymorpha were cloned to determine possible haplotypes. All remaining individuals were sequenced directly and haplotype subtraction was used to determine haplotypes (Clark 1990). This was considered an appropriate technique since there was a high incidence of homozygosity and single-site heterozygosity.
For comparative purposes, we also used a segment of the 6-phosphogluconate dehydrogenase (pgd) locus on the X chromosome that encodes an enzyme involved in the pentose-phosphate shunt (Christensen and Lucchesi 1984). We used the exon-based degenerate primers pgdfor (5′-GGAGCCGACTCGCTNGARGAYATG-3′) and pgdrev (5′-CGCGGCCTCGTGNCCNCCNGGCAT-3′) designed from known pgd orthologs in GenBank to amplify an ∼600-bp region of an intron in pgd. The amplified DNA from females was cloned into the pSTBlue-1 vector using the Acceptor Vector cloning kit and sequenced using the vector-specific primers T7 and U19. Divergent sequences were reamplified and sequenced directly to check for PCR artifacts. DNA from males was amplified and sequenced directly.
Interspecific analyses:
For a wide phylogenetic perspective on variation at the omb locus, we sequenced the two omb regions in D. melanica, D. polymorpha, and D. virilis and obtained the D. pseudoobscura and D. melanogaster omb sequences from published work. DNA was translated into amino acid sequences for alignment. Sequences were aligned using the program PRETTYBOX (Genetics Computer Group, release 10.0). Isoelectric points were estimated using Seqman 4.00 (DNASTAR, Madison, WI).
To examine omb evolution among species of the cardini group, we amplified and sequenced the two omb regions for nine species: D. cardini, D. cardinoides, D. dunni, D. neomorpha, D. nigrodunni, D. parthenogenetica, D. polymorpha, D. procardinoides, and D. similis. Nucleotide sequences were aligned by hand. Several areas were unalignable due to microsatellite variation, and these areas were removed prior to analyses, leaving 654 included characters.
Analyses within D. polymorpha:
For initial investigations, haplotype tree estimation using statistical parsimony (Templeton et al. 1992) was implemented using the program TCS v. 1.13 (Clement et al. 2000) for the D. polymorpha N-terminal omb data set culled of microsatellite variation. Following production of a haplotype tree without microsatellites, we attempted to add the microsatellite information in coded form (for example, a microsatellite with four variants was coded as A, G, C, or T). Two microsatellite regions, S1 and S2, were successfully added in this manner to produce a second haplotype tree with more structure. Attempts to add the remaining microsatellites proved to be too ambiguous for reliably constructing haplotype relationships. The program DNAsp v. 3.5 (Rozas and Rozas 1999) was used to estimate heterozygosity (Θ) and nucleotide diversity (π) of the culled data set. Heterozygosity is derived from the proportion of segregating sites in the sequence (S; Watterson 1975), and nucleotide diversity is the average number of nucleotide differences per site between two sequences (Nei 1987).
Nested clade analysis (NCA) was used to examine the phylogeography of D. polymorpha N-terminal omb haplotypes (Templeton et al. 1995). The haplotype tree was used to define a series of hierarchically nested clades following the nesting rules given in Templeton et al. (1987) and Templeton and Sing (1993). The program GeoDis 2.0 (Posada et al. 2000) calculated the NCA measures for each clade in each level of nesting. A total of 10,000 random iterations were used to permute the observations within a nesting clade over geography to test the null hypothesis of no association of a haplotype in a cladogram with geographical location, as described in Templeton et al. (1995) and Templeton (2004).
Nested clade analysis was also used to examine the correlation between haplotypes and the abdominal pigmentation phenotype. Abdominal pigmentation phenotypes of D. polymorpha from wild-caught collections were scored on a scale of one through nine according to a scheme developed specifically for this species (Martinez and Cordeiro 1970). We used nested clade analysis to look for nonrandom distributions of phenotypic categories across nested clades (Templeton and Sing 1993). In this approach, the different levels of nesting define groups of haplotypes. The phenotypes of individuals in each nesting level are then compared to one another via exact permutational tests. Exact permutational tests were also used to test for a nonrandom distribution of microsatellite repeats across phenotypic classes and to test for linkage disequilibrium between microsatellite repeat regions.
Tests of selection:
We used DNAsp (Rozas and Rozas 1999) to implement a number of tests to determine whether selection has shaped genetic variation at the omb locus. Since most variation was in the form of single-site polymorphisms and thus there was little homoplasy in the data set, the infinite sites model was considered appropriate for tests of selection. First, we calculated Tajima's D statistic (Tajima 1989), a measure of whether the number of segregating sites at a locus is consistent with neutral expectations. Second, we calculated the D* and F* statistics of Fu and Li (1993). We also used an intraspecific contingency table test of homogeneity, comparing tip vs. interior polymorphisms, to test for selection (Templeton 1996). The two-by-two contingency table was analyzed using Fisher's exact test.
To investigate selection at the interspecific level, we again used a contingency test of neutrality (Templeton 1996) using data from both the intraspecific D. polymorpha omb gene tree and the cardini group interspecific gene tree. This method categorizes silent vs. replacement mutations into three classes. The tip and interior classes refer to mutations in an intraspecific data set. The final class, fixed, refers to mutations that differ among species. The table was analyzed using an exact permutational test using the algorithm of Roff and Bentzen (1989) permuted randomly 1000 times.
RESULTS
Sequences obtained:
Sequences of the N-terminal omb region were obtained for eight species of the cardini group and 120 individuals of D. polymorpha, as well as for D. melanica, D. melanogaster, D. pseudoobscura, and D. virilis. Sequences of the T-domain region were obtained for the same species, but only a subset (37) of D. polymorpha individuals were used. The pgd locus was sequenced for 88 individuals. These sequences can be found under GenBank accession nos. AY677667, AY677668, AY677669, AY677670, AY677671, AY677672, AY677673, AY677674, AY683324, AY683443, AY676329, AY676330, AY677630, AY677631, AY677632, AY677633, AY677634, AY677635, AY677636, AY677637, AY677638, AY677639, AY677640, AY677641, AY677642, AY677643, AY677644, AY677645, AY677646, AY677647, AY677648, AY677649, AY677650, AY677651, AY677652, AY677653, AY677654, AY677655, AY677656, AY677657, AY677658, AY677659, AY677660, AY677661, AY677662, AY677663, AY677664, AY677665, AY677666, and AY687192, AY687193, AY687194, AY687195, AY687196, AY687197, AY687198, AY687199, AY687200, AY687201, AY687202, AY687203, AY687204, AY687205, AY687206, AY687207, AY687208, AY687209, AY687210, AY687211, AY687212, AY687213, AY687214, AY687215, AY687216, AY687217, AY687218, AY687219, AY687220, AY687221, AY687222, AY687223, AY687224, AY687225, AY687226, AY687227, AY687228, AY687229, AY687230, AY687231, AY687232, AY687233, AY687234, AY687235, AY687236, AY687237, AY687238, AY687239, AY687240, AY687241, AY687242, AY687243, AY687244, AY687245, AY687246, AY687247, AY687248, AY687249, AY687250, AY687251, AY687252, AY687253, AY687254, AY687255, AY687256, AY687257, AY687258, AY687259, AY687260, AY687261, AY687262, AY687263, AY687264, AY687265, AY687266, AY687267, AY687268, AY687269, AY687270, AY687271, AY687272, AY687273, AY687274, AY687275, AY687276, AY687277, AY687278, AY687279.
Across-species comparisons of omb:
To determine broad patterns of evolution in both regions of omb, we aligned amino acid sequences from D. melanogaster, D. melanica, D. pseudoobscura, D. polymorpha and D. virilis (Figure 2)
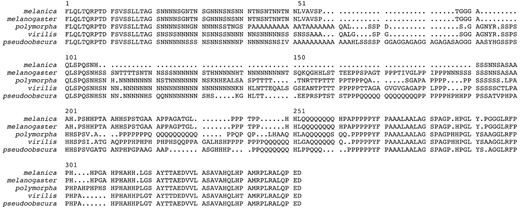
Alignment of N-terminal region omb haplotypes from five divergent species of Drosophila. Letters are the common amino acid designations, and periods represent gaps introduced for alignment.
. These species are representatives of most major clades in the Drosophila phylogeny (Remsen and O'Grady 2002). In the N-terminal alignment there is little similarity after the initial 20 amino acids. Nearing the end of this region (around amino acid 251 in Figure 2), amino acid similarity increases again as the sequence approaches the T-domain, which is immediately C-terminal to this region. There is also considerable length variation in the region, as exhibited most dramatically by D. melanica, which has 106 fewer amino acids than the longest sequence, that of D. pseudoobscura (Table 1)
Species for which the N-terminal region of omb was sequenced
Species | Species group | Number of amino acids | Estimated isoelectric point |
|---|---|---|---|
| D. melanogaster | Melanogaster | 280 | 7.264 |
| D. pseudoobscura | Obscura | 304 | 7.566 |
| D. melanica | Melanica | 198 | 7.438 |
| D. virilis | Virilis | 303 | 7.232 |
| D. ornatipennis | Calloptera | 275 | 7.437 |
| D. polymorpha | Cardini | 283 | 7.878 |
| D. similis | Cardini | 274 | 7.894 |
| D. nigrodunni | Cardini | 280 | 7.894 |
| D. neomorpha | Cardini | 272 | 7.894 |
| D. cardinoides | Cardini | 274 | 7.894 |
| D. cardini | Cardini | 288 | 7.894 |
| D. dunni | Cardini | 256 | 7.878 |
| D. procardinoides | Cardini | 284 | 7.894 |
| D. parthenogenetica | Cardini | 273 | 7.894 |
. Some of this variation is due to differences in the length of amino acid runs, with asparagine (N) runs being the most prominent. Despite length variation and amino acid changes, the estimated isoelectric point of the N-terminal portion of omb remains nearly constant among species (Table 1). The T-box region exhibited no amino acid variation and was well conserved at the nucleotide level as well, with 18 variable sites (of a total 178) among these highly divergent species.
Nucleotide diversity at omb within D. polymorpha:
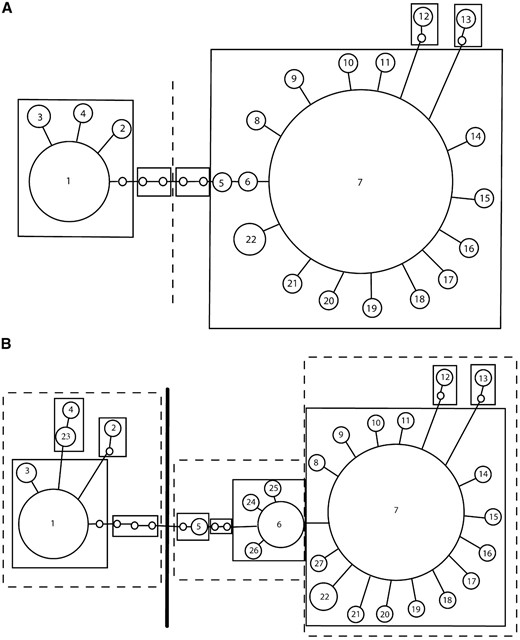
To analyze nucleotide variation in the omb N-terminal region of D. polymorpha, we performed separate analyses with a data set culled of microsatellites and another with information from two microsatellites included in coded form. After culling the microsatellites, 22 haplotypes and 23 polymorphic sites remained. To visualize the relationships among these haplotypes, we constructed a haplotype tree (Figure 3A)
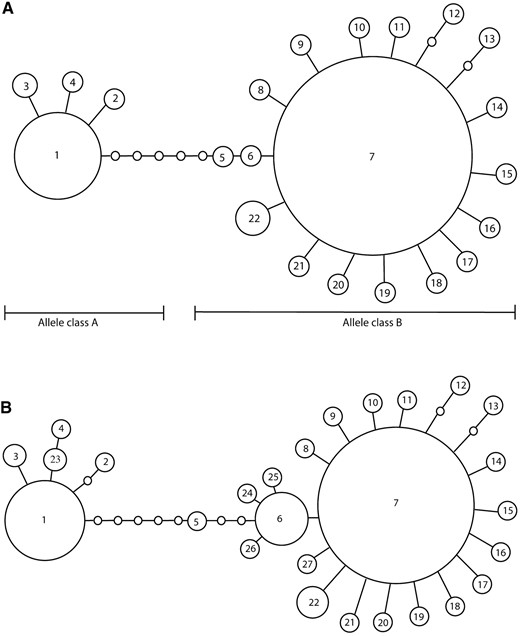
(A) Tree constructed from omb N-terminal haplotypes culled of microsatellite repeats and (B) tree constructed from omb N-terminal haplotypes including information from two microsatellite repeats. Each circle represents a single haplotype, the circle is sized relative to the number of individuals of each observed haplotype, each line is a single mutational step, and empty circles are unobserved haplotypes.
. Haplotypes separated by up to 11 steps had >95% probability of being connected in a parsimonious fashion (Templeton et al. 1992). The network illustrates that the haplotypes are biallelic, falling into two classes separated by six mutational steps. Allele class A has 4 haplotypes, allele class B has 18 haplotypes, and their corresponding measures of nucleotide diversity are reported in Table 2
Measures of omb nucleotide variation
All | Nonsynonymous | Synonymous | |||||
|---|---|---|---|---|---|---|---|
| bp | π | Θ | π | Θ | π | Θ | |
| All | 750 | 0.0042 | 0.0067 | 0.0031 | 0.0020 | 0.0074 | 0.0202 |
| Allele class A | 750 | 0.0004 | 0.0011 | 0.0000 | 0.0000 | 0.0016 | 0.0041 |
| Allele class B | 750 | 0.0007 | 0.0050 | 0.0000 | 0.0004 | 0.0024 | 0.0182 |
| T-box coding | 178 | 0.0000 | 0.0000 | 0.0000 | 0.0000 | 0.0000 | 0.0000 |
| T-box intron | 65 | 0.0127 | 0.0058 | NA | NA | NA | NA |
π (Nei 1987) is the average pairwise difference and Θ is the number of segregating sites per site (Watterson 1975). NA, not applicable.
. Twenty-six of the 120 individuals from 6 of the 19 populations exhibited an A-type allele.
In a second analysis, with information from two of the microsatellites included, 26 haplotypes and 25 polymorphic sites were observed. Again, haplotypes separated by up to 11 steps had >95% probability of being connected in a parsimonious fashion. The resulting network, which has more structure than the first, is presented in Figure 3B.
Five of the mutations that separate the two allele classes code for amino acid replacements and their locations within the sequence are illustrated in Figure 4
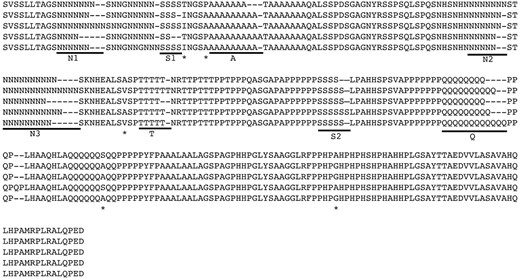
Alignment of five representative D. polymorpha omb N-terminal amino acid sequences. Underlined areas are variable microsatellite regions and asterisks mark polymorphic amino acid sites.
. They were, for the allele classes A and B, respectively: threonine and isoleucine, proline and alanine, alanine and valine, alanine and serine, and alanine and glycine. One of these changes is conservative (between alanine and valine); two are changes between hydrophilic polar and hydrophobic nonpolar amino acids (threonine and isoleucine, serine and alanine). The alanine to proline change, although conservative in the sense that both are hydrophobic nonpolar amino acids, is not conservative in the sense that they have very different structures. Finally, the alanine and glycine polymorphism is between a hydrophobic nonpolar amino acid (alanine) and a nearly neutral amino acid (glycine). These changes appear to be in complete linkage with each other such that a change at one site corresponds to a change in all of the other polymorphic sites. As such, all five sites exhibited statistically significant nonrandom associations with each other (P < 0.001). The amino acid replacements that characterize the differences between the allele classes are also in linkage disequilibrium with the microsatellite repeats (Figure 5)
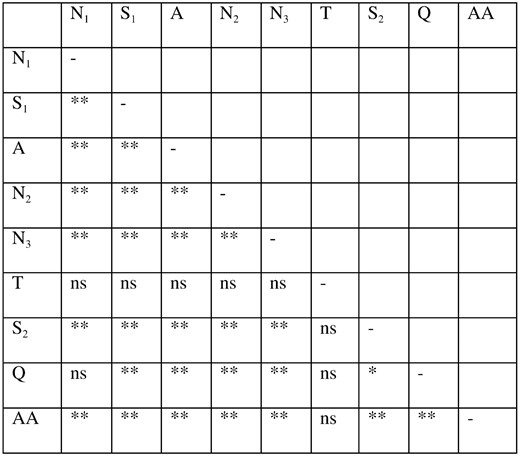
Linkage disequilibrium between microsatellite runs in the N-terminal region of omb in D. polymorpha. “AA” refers to the amino acids that characterize the distinction between allele classes A and B. The association between pairs marked with two asterisks is P < 0.01, those with one asterisk are 0.01 < P < 0.05, and “ns” indicates no association.
. Only one other amino acid substitution was found in this culled data set, in which a proline was replaced with an alanine.
We used the haplotype trees given in Figure 3 to implement nested clade phylogeographic analyses (Templeton et al. 1995) to look for associations between haplotypes and geography. Haplotypes were nested as illustrated in Figure 6
Nesting design used for the nested clade analyses for the haplotype tree created from the omb N-terminal sequences (A) culled of microsatellites and (B) with information from two microsatellites. Solid lines outline one-step clades. Broken lines outline two-step clades. The heavy dark line separates three-step clades.
. We found no significant inferences. Therefore, we are unable to reject the null hypothesis of no correlation between omb haplotypes and geographical location.
Within the coding region of the T-domain of omb (subsets of exons 3 and 4) we observed no nucleotide variation in 37 individuals sampled from 11 different populations. The small intron in this region exhibited two polymorphic sites and one indel of four nucleotides. These data were not considered in further analyses because of the lack of variation.
Correlation of omb haplotypes with abdominal pigmentation:
Our main focus was on variation at the omb locus within a single species of the cardini group, D. polymorpha. Our primary goal was to determine whether the polymorphism in abdominal pigmentation in this species is correlated with variation at the omb locus. We used nested clade analysis to define haplotype groups to test for associations with the pigmentation categories, with the nesting design illustrated in Figure 6 for both haplotype trees, one excluding and one including some microsatellite information. The genotype and phenotype matrix is available at http://www.genetics.org/supplemental. An association between pigmentation and haplotype group was found in both trees. The data set culled of microsatellites had two nesting levels, with homogeneity rejected at the one-step level (P = 0.019) and the two-step level (P < 0.001). Similarly, the data set including information from two microsatellite loci had three nesting levels, with homogeneity rejected at the two-step level (P = 0.003) and the three-step level (P = 0.003). The association we find is due to an excessive number of lightly pigmented individuals (phenotypes one to three) in haplotype class A and a relatively higher proportion of medium (phenotypes four through six) and dark (phenotypes seven through nine) pigmented individuals in haplotype class B (Table 3)
Distribution of pigmentation phenotypes across the two allele classes
Allele class A | Allele class B | |
|---|---|---|
| Light | 8 | 4 |
| Medium | 4 | 24 |
| Dark | 14 | 66 |
Allele class A | Allele class B | |
|---|---|---|
| Light | 8 | 4 |
| Medium | 4 | 24 |
| Dark | 14 | 66 |
Distribution of pigmentation phenotypes across the two allele classes
Allele class A | Allele class B | |
|---|---|---|
| Light | 8 | 4 |
| Medium | 4 | 24 |
| Dark | 14 | 66 |
Allele class A | Allele class B | |
|---|---|---|
| Light | 8 | 4 |
| Medium | 4 | 24 |
| Dark | 14 | 66 |
. We therefore conclude that there is an association between phenotypic categories and allele classes at the N-terminal region of the omb locus. In contrast, there was no association between nested haplotypes in the pgd tree and the pigmentation phenotypes (data not shown). Further, haplotypes at the pgd locus did not fall into two allelic classes.
The N-terminal region of omb is quite variable in length within D. polymorpha due to the presence of eight variable microsatellite runs. These runs resulted in length variation among individuals, ranging from 276 to 287 amino acids. Their distribution over the sequence is depicted in Figure 4, and the variation in the number of repeats at each run is reported in Table 4
Amino acid repeats in the N-terminal region of omb and number of individuals of each pigmentation phenotype bearing them
N1* | S1** | A* | N2** | N3* | T | S2** | Q* | ||||||||||||
|---|---|---|---|---|---|---|---|---|---|---|---|---|---|---|---|---|---|---|---|
| No. of
repeats | 4, 5 | 6, 7 | 8–12 | 2 | 4, 5 | 8–10 | 11–12 | 6, 7 | 8–10 | 5, 7, 8 | 9 | 10 | 11–14 | 4, 5 | 6, 7 | 4, 5 | 6, 7 | 5–8 | 9–12 |
| Light | 8 | 3 | 1 | 8 | 4 | 6 | 6 | 5 | 7 | 7 | 2 | 0 | 3 | 12 | 0 | 4 | 8 | 5 | 7 |
| Medium | 8 | 15 | 5 | 5 | 23 | 22 | 6 | 24 | 4 | 5 | 7 | 10 | 6 | 26 | 2 | 23 | 5 | 23 | 5 |
| Dark | 19 | 39 | 22 | 15 | 65 | 66 | 14 | 64 | 16 | 18 | 27 | 18 | 17 | 71 | 9 | 56 | 24 | 51 | 29 |
Amino acids are asparagine (N), serine (S), alanine (A), threonine (T), and glutamine (Q). Numbered subscripts designate distinct runs. Asterisks denote significant associations with the pigmentation phenotype of P < 0.01 (**) or 0.01 < P < 0.05 (*). For some microsatellites, repeat categories were combined to avoid groups with zero entries.
. Because the majority of these runs contained degenerate coding, we counted repeat number at the amino acid level.
We looked for an association between microsatellite repeat numbers and the pigmentation phenotypes of D. polymorpha. When all nine pigmentation categories are considered in the analysis, three of the eight microsatellite repeats at omb (N1, S1, and A) show a significant association with pigmentation. To increase statistical power, we collapsed the nine phenotypic categories into three categories of light (phenotypes one through three), medium (phenotypes four through six), and dark (phenotypes seven through nine), a common grouping of phenotypes for this species (da Cunha 1949; Machado et al. 2001). After this grouping, seven of the eight microsatellite repeats are associated nonrandomly with the three pigmentation categories (Table 4). Interestingly, the majority of the microsatellite repeats are in linkage disequilibrium with one another (Figure 5), indicating that the entire N-terminal region of omb is associated with the pigmentation phenotype, and therefore these tests are not independent.
We also found a microsatellite repeat at the pgd locus. This locus was sequenced for 88 individuals, a data set that mostly overlapped with the omb data set in terms of individuals used. In an additional 20 individuals, the sequence quality was inadequate for haplotype information, but sufficient for scoring microsatellite repeat number. This microsatellite repeat shows no association with the pigmentation phenotypes (Table 5)
Amino acid repeats in a microsatellite at the pgd locus and number of individuals of each pigmentation phenotype bearing them
pgd microsatellite | ||||
|---|---|---|---|---|
| No. of repeats | 5, 6 | 7 | 8 | 9, 10, 11 |
| Light | 0 | 4 | 5 | 1 |
| Medium | 0 | 4 | 7 | 3 |
| Dark | 5 | 22 | 32 | 25 |
pgd microsatellite | ||||
|---|---|---|---|---|
| No. of repeats | 5, 6 | 7 | 8 | 9, 10, 11 |
| Light | 0 | 4 | 5 | 1 |
| Medium | 0 | 4 | 7 | 3 |
| Dark | 5 | 22 | 32 | 25 |
Exact permutational test: P = 0.652.
.
Deviations from neutrality: excess of rare alleles and intraspecific replacement polymorphisms:
We looked for deviations from neutrality in the N-terminal region of omb with the D. polymorpha data using Tajima's (1989) and Fu and Li's (1993) tests. All three test statistics were negative (Tajima's D = −1.09, P > 0.10; D* = −4.47, P < 0.02, F* = −3.77, P < 0.02), indicating a lack of polymorphism except in the form of rare alleles (despite the presence of two major allele classes). We constructed a two-by-two contingency table by counting the number of replacement and synonymous mutational events on the tip and interior branches of the haplotype tree shown in Figure 3A. The contingency table is shown in Table 6
Contingency analysis of silent vs. replacement mutations
Silent | Replacement | |
|---|---|---|
| Tip (intraspecific) | 14 | 1 |
| Interior (intraspecific) | 2 | 5 |
| Fixed (interspecific) | 67 | 17 |
Silent | Replacement | |
|---|---|---|
| Tip (intraspecific) | 14 | 1 |
| Interior (intraspecific) | 2 | 5 |
| Fixed (interspecific) | 67 | 17 |
Permutational probability under the null hypothesis of homogeneity for intraspecific data is 0.003. Permutational probability under the null hypothesis of homogeneity for all data is <0.001.
, with the null hypothesis of homogeneity strongly rejected. This result indicates balancing or diversifying selection, reflecting the inordinately large number of replacement amino acid changes on interior branches of the haplotype tree.
We also performed a contingency test of neutrality (Templeton 1996) using the D. polymorpha intraspecific gene tree in combination with the interspecific cardini gene tree. This, too, was significant (Table 6) in rejecting the null hypothesis of homogeneity. Neutral theory would predict the same proportion of nonsynonymous to synonymous mutations within and between species. However, replacements were more common in the interior than the tip classes within D. polymorpha and more common among species than among tip haplotypes within D. polymorpha.
DISCUSSION
Variation at the omb locus:
At the distantly related species level (i.e., across most of the Drosophila phylogeny) nucleotide variation is so high in the N-terminal region of omb that it is unalignable. The amino acid sequences encoded also have few alignable regions. However, it is notable that despite this large amount of variation, two domains, at the beginning and end of the sequence considered here, are nearly perfectly conserved and therefore likely to be of functional importance. A transcription repression domain lies upstream of the T-domain of Tbx2, the mouse homolog of omb (Paxton et al. 2002). Whether or not a similar repression domain exists in omb will require functional studies. Despite showing extensive amino acid and length variation, the remaining portion of the N-terminal region studied retains similar estimated isoelectric points. In marked contrast, there was very little variation among distantly related species in the T-domain. All nucleotide variation in this region produced synonymous codons. This result is not surprising, given the functional significance of this region (i.e., its role in DNA binding).
The N-terminal domain contains within it a number of microsatellite runs. Microsatellite runs are common in the coding regions of important developmental genes, especially in the motifs flanking the DNA-binding domain (Suzuki 1989). Karlin et al. (2002) report that >80% of Drosophila proteins with multiple runs seem to function in the regulation of transcription. Among these are such well-known genes as Ultrabithorax, period, mastermind, and nonA (Beachy et al. 1985; Colot et al. 1988; Newfeld et al. 1993; Peixoto et al. 1993; Campesan et al. 2001). Further, Karlin et al. (2002) report that alanine, serine, and glutamine account for a significant proportion of the runs. At the omb locus, we see runs of these three amino acids as well as a threonine and three asparagine runs. These runs are in close proximity to the DNA-binding region, the T-domain, as noted by Pflugfelder et al. (1992a)(b) in their analysis of the omb locus in D. melanogaster. Length variation of these homopolymers may cause differences in structure that allow plasticity in protein-protein interactions (Newfeld et al. 1991). The multiple asparagine (N) runs are particularly interesting, since N runs avoid the secondary structures of α-helices and β-strands and may provide binding sites for protein-protein interactions (Brendel and Karlin 1989; Karlin et al. 2002).
Correlation between omb haplotypes and abdominal pigmentation:
As previously mentioned, genetic studies have led to the expectation that omb might contribute to variation in the width of the abdominal pigment band among individuals of Drosophila (Kopp and Duncan 1997). Indeed, here we report a significant association between the A and B haplotype classes and other haplotype clades and abdominal pigmentation variation. We also report a significant association between microsatellite variation within the N-terminal omb coding region and the pigmentation phenotype. Seven of eight variable microsatellites in this region had repeat numbers that were nonrandomly distributed across the three phenotypic categories of light, medium, and dark pigmentation. These correlations indicate that omb (or a regulatory region of omb or another locus in linkage disequilibrium with this region of omb) may play a role in natural variation in this trait. Further, because omb haplotypes did not correlate with geography as determined by phylogeographic nested clade analysis, the correlation observed here is not a by-product of geographic sampling.
The association between omb haplotypes and pigmentation variation would be greatly strengthened by linkage information from omb haplotypes segregating in an F2 generation. Unfortunately, the only lines we have in the laboratory are light lines that have a dominant light allele and a single dark line. These light lines were established from flies collected in the northern part of D. polymorpha's range, the only region in which the dominant light allele is known to exist (Heed and Blake 1963). Therefore, these are not appropriate for examining the polymorphism that we have detected in flies from southern Brazil, where the dominant light allele is not present. And, any results from these types of analyses would not be able to illuminate whether omb is the major locus underlying pigmentation variation for this species (da Cunha 1949) or a modifier locus (Martinez and Cordeiro 1970), because a cross between a light line with a dominant light allele and a dark line would produce only light or dark flies, never flies with intermediate levels of pigmentation. We therefore must estimate the amount of phenotypic variation explained by omb haplotypes on the basis of the data presented here. The average phenotype of an individual bearing an A-class allele is 6.0, while the average phenotype of an individual bearing a B-class allele is 6.9. The phenotypic differences between the two classes are thus on the order of one phenotypic class, suggesting omb may be a modifier locus.
Much recent effort has been applied to determining the number and identity of loci contributing to abdominal pigmentation variation either within or between species of Drosophila (Kopp et al. 2000, 2003; Llopart et al. 2002; Wittkopp et al. 2002, 2003b). One study specifically examined the potential contribution of omb to pigmentation evolution. Wittkopp et al. (2003b) used markers within candidate genes to look for associations with pigmentation divergence between D. americana and D. novamexicana. They found that a marker within the omb gene was not linked to any QTL for this trait. However, these species differ primarily in the degree of melanization of each segment (D. americana has a uniformly darkly melanized abdominal cuticle, and D. novamexicana has a uniformly lightly melanized abdominal cuticle) and not in the width of the pigment band. Thus, omb is not expected to be involved in differences between these species. However, omb may be important in determining pigmentation differences between D. yakuba (pigmented like D. melanogaster) and D. santomea (completely unpigmented), as Llopart et al. (2002) found that the X chromosome (omb is most likely on the X in the melanogaster species group) accounts for nearly 90% of the pigmentation differences between these species.
Biallelism at the omb locus:
Variation at omb is best described as biallelism, with two main haplotype clusters (Figure 3), referred to here as allele class A and allele class B. Allele class A is associated with very little variation (fewer haplotypes) compared to allele class B. These haplotype counts argue that allele class B is the older of the two classes. On the other hand, the amino acid states found in allele class A are identical to those found in the majority of the other species of the cardini group examined here. Thus, if placed within a phylogenetic context, it is apparent that allele class A is the ancestral state. However, the wide geographic spread (all populations sampled) and haplotype diversification (Figure 3) observed here for allele class B indicate that it has been in existence for some time. In fact, it was the only allele class found in 13 of the 19 populations, although the sparse sampling makes it possible that both alleles are found in the majority of the populations. It is not known whether the replacement substitutions that separate the two allele classes result in a functional change in the omb protein or whether they are in linkage disequilibrium with other changes in either the regulatory regions or the protein-coding region that are in some manner selectively advantageous.
Because molecular variation can be shaped by both demographic and selective processes, it is important to consider the demographic history of D. polymorpha. Certain scenarios could explain the biallelic structure observed in the N-terminal domain of omb. First, if D. polymorpha is fragmented into several smaller populations, genetic drift can cause populations to diverge from one another, resulting in a situation with very little polymorphism within populations compared to polymorphisms among populations. Second, the breakdown of a previous barrier between divergent populations or introgression from a related species may result in biallelism.
Insight into these scenarios is aided by previous work on the phylogeography of the species. D. polymorpha is a widespread species found throughout much of South America in a wide diversity of habitats and is therefore not prone to inbred, fragmented populations (Heed 1963; Sene et al. 1980; Tidon-Sklorz and Sene 1992; Rohde 1996b). The only structure among populations of the species from south and central Brazil (the same individuals used here), as determined by both a mitochondrial locus (cytochrome b and flanking regions) and a nuclear locus (pgd), is that of restricted gene flow via isolation by distance and one inference of a contiguous range expansion (J. A. Brisson, unpublished data). Therefore, we can exclude population fragmentation as a causative factor in the maintenance of biallelism at this locus. Further, omb haplotypes from all the closely related species to D. polymorpha displayed nucleotide differences significantly different from D. polymorpha haplotypes, making it unlikely that introgression from a related species is contributing to variation at the omb locus in D. polymorpha.
Finally, a biallelic structure can be maintained by a chromosomal inversion. Indeed, previous work on D. polymorpha indicates that inversion polymorphisms are widespread in this species (Rohde 1996a; De Toni et al. 2001). To test whether the A or B alleles are associated with inversions, we created heterozygotes for allele classes A and B and examined their chromosomal morphology. Inversions were observed on the X chromosomes, but not on the autosomes (data not shown). In our analysis, we have determined that omb is not on the X chromosome in D. polymorpha (wild-caught males display two unique haplotypes), as it is in D. melanogaster. Therefore, we conclude that an inversion polymorphism is not responsible for maintenance of the two haplotype classes of omb in D. polymorpha.
Evidence for selection at the omb locus:
Because omb is a candidate for abdominal pigmentation variation, we looked for the signature of selection at this locus within a single species, D. polymorpha. For Tajima's (1989) and Fu and Li's (1993) tests, we observed the pattern of a significantly large number of singleton mutations (rare haplotypes) in comparison to the neutral expectation. This pattern implies that a diversity-reducing event occurred in the past. In contrast, a contingency test of neutrality indicated balancing selection was acting to preserve both haplotype classes. Therefore, the history of selection at this locus within D. polymorpha appears to be selective sweeps within each allele class, while both classes are maintained by balancing selection.
The source of the balancing selection at omb within D. polymorpha, if it is indeed involved in the production of the pigmentation phenotype, could be the habitat of these generalist fruit flies. In southern Brazil, populations of D. polymorpha found in forested habitats have, on average, lighter pigmented abdomens than populations found in open, drier habitats (J. A. Brisson, unpublished data). Therefore, alternative alleles could be selected in different environments and thus in different populations, maintaining a balanced polymorphism across the species.
The contingency test also revealed a higher number of fixed (interspecific) amino acid replacements relative to intraspecific tip amino acid replacements, suggesting that directional selection is favoring amino acid changes among species. These results, combined with the intraspecific selection tests, suggest the following picture: within D. polymorpha nucleotide replacement variation at omb has occurred with some frequency, but has been reduced by purifying selection within each allele class while both allele classes are maintained by balancing selection. In contrast, interspecific comparisons suggest that directional selection has been responsible for fixing differences between species. This behavior is consistent with that expected for a gene underlying an ecologically relevant trait such as abdominal pigmentation. A closer examination of omb variation in different species of the cardini group will elucidate the history of selection at this locus.
In the T-domain, the lack of amino acid variation among divergent species indicates purifying selection. Within D. polymorpha, we observed no nucleotide variation at all in the T-domain coding region. This total lack of nucleotide polymorphism could be indicative of codon bias or functional constraint at the nucleotide level.
Footnotes
Communicating editor: G. Gibson
Acknowledgement
We thank two anonymous reviewers for their helpful comments on this work. J.A.B. is a Howard Hughes Medical Institute Predoctoral Fellow. This work was supported by National Science Foundation Doctoral Dissertation Improvement grant 0104977 to J.A.B.
References
Barnes, W. M.,
Beachy, P., S. Helfand and D. Hogness,
Bollag, R. J., Z. Siegfried, J. A. Cebrathomas, N. Garvey, E. M. Davidson et al.,
Brendel, V., and S. Karlin,
Brunner, A., R. Wolf, G. O. Pflugfelder, B. Poeck and M. Heisenberg,
Campesan, S., D. Chalmers, F. Sandrelli, A. Megighian, A. A. Peixoto et al.,
Carroll, S. B., J. K. Grenier and S. D. Weatherbee, 2001 From DNA to Diversity: Molecular Genetics and the Evolution of Animal Design. Blackwell Scientific, Oxford.
Christensen, A. C., and J. C. Lucchesi,
Clark, A. G.,
Clement, M., D. Posada and K. A. Crandall,
Colot, H. W., J. C. Hall and M. Roshbash,
da Cunha, A. B.,
David, J. R., P. Capy and J. P. Gauthier,
De Toni, D. C., F. De Oliveira and V. L. S. Valente,
Fu, Y. X., and W. H. Li,
Garcia-Bellido, A., 1983 Comparative anatomy of cuticular patterns in the genus Drosophila, pp. 227–255 in Development and Evolution: Sixth Symposium of the British Society for Developmental Biology, edited by B. C. Goodwin, N. Holder and C. C. Wylie. Cambridge University Press, Cambridge/New York.
Gibert, P., B. Moreteau, J. C. Moreteau and J. R. David,
Gibert, P., B. Moreteau, J. C. Moreteau, R. Parkash and J. R. David,
Gompel, N., and S. B. Carroll,
Grimm, S., and G. O. Pflugfelder,
Heed, W. B.,
Heed, W. B., and P. R. Blake,
Heed, W. B., and N. B. Krishnamurthy,
Heed, W. B., and J. S. Russell,
Hollocher, H., J. L. Hatcher and E. G. Dyreson,
Karlin, S., L. Brocchieri, A. Bergman, J. Mrazek and A. J. Gentles,
Kettlewell, B., 1973 The Evolution of Melanism: The Study of a Recurring Necessity; With Species Reference to Industrial Melanism in the Lepidoptera. Clarendon Press, Oxford.
Kispert, A., and B. G. Herrmann,
Kispert, A., B. Koschorz and B. G. Herrmann,
Kopp, A., and I. Duncan,
Kopp, A., and I. Duncan,
Kopp, A., I. Duncan and S. B. Carroll,
Kopp, A., R. M. Graze, S. Z. Xu, S. B. Carroll and S. V. Nuzhdin,
Lecuit, T., W. J. Brook, M. Ng, M. Calleja, H. Sun et al.,
Lee, T. J.,
Llopart, A., S. Elwyn, D. Lachaise and J. A. Coyne,
Machado, M. X., D. C. De Toni and P. R. P. Hofmann,
Martinez, M. N., and A. R. Cordeiro,
Nellen, D., R. Burke, G. Struhl and K. Basler,
Newfeld, S. J., D. A. Smoller and B. Yedvobnick,
Newfeld, S. J., A. T. Schmid and B. Yedvobnick,
Ohnishi, S. A. T. K. W.,
Paxton, C., H. H. Zhao, Y. Chin, K. Langner and J. Reecy,
Peixoto, A. A., S. Campesan, R. Costa and C. P. Kyriacou,
Pflugfelder, G. O., H. Roth and B. Poeck,
Pflugfelder, G. O., H. Roth, B. Poeck, S. Kerscher, H. Schwarz et al.,
Poeck, B., A. Hofbauer and G. O. Pflugfelder,
Posada, D., K. A. Crandall and A. R. Templeton,
Remsen, J., and P. O'Grady,
Robertson, A., D. A. Briscoe and J. H. Louw,
Roff, D. A., and P. Bentzen,
Rohde, C. a. V. L. S. V.,
Rohde, C. a. V. L. S. V.,
Rozas, J., and R. Rozas,
Sene, F. M., F. C. Val, C. R. Vilela and M. A. Q. R. Pereira,
Stalker, H. D.,
Suzuki, M.,
Tajima, F.,
Templeton, A. R.,
Templeton, A. R.,
Templeton, A. R., and C. F. Sing,
Templeton, A. R., E. Boerwinkle and F. Sing,
Templeton, A. R., K. A. Crandall and C. F. Sing,
Templeton, A. R., E. Routman and C. A. Phillips,
Tidon-Sklorz, R., and F. d. M. Sene,
Watterson, G. A.,
Wittkopp, P. J., K. Vaccaro and S. B. Carroll,
Wittkopp, P. J., S. B. Carroll and A. Kopp,
Wittkopp, P. J., B. L. Williams, J. E. Selegue and S. B. Carroll,
