


Abstract
Mutants of Physarum polycephalum can be complemented by fusion of plasmodial cells followed by cytoplasmic mixing. Complementation between strains carrying different mutational defects in the sporulation control network may depend on the signaling state of the network components. We have previously suggested that time-resolved somatic complementation (TRSC) analysis with such mutants may be used to probe network architecture and dynamics. By computer simulation it is now shown how and under which conditions the regulatory hierarchy of genes can be determined experimentally. A kinetic model of the sporulation control network is developed, which is then used to demonstrate how the mechanisms of TRSC can be understood and simulated at the kinetic level. On the basis of theoretical considerations, experimental parameters that determine whether functional complementation of two mutations will occur are identified. It is also shown how gene dosage-effect relationships can be employed for network analysis. The theoretical framework provided may be used to systematically analyze network structure and dynamics through time-resolved somatic complementation studies. The conclusions drawn are of general relevance in that they do not depend on the validity of the model from which they were derived.
COMPLEMENTATION is the production of a wildtype phenotype when two recessive mutant alleles are united in the same cell (Griffiths et al. 1999). Genetic complementation tests can be performed either by crossing of two homozygous mutant strains of an experimental organism or by fusion of cells of two mutants through heterokaryon formation as it occurs, e.g., in fungi. In such heterokaryons, two nuclear populations mix and although the individual nuclei originating from the two parent strains do not fuse, their gene products certainly mix, providing the biochemical basis for the complementation effect. Using the photosensory control of sporulation in Physarum polycephalum as an example, we have shown that production of a wild-type phenotype by heterokaryon formation may depend on the time-dependent physiological state adopted after pathway activation in one of the mutant fusion partners and suggested that such effects can be used to systematically analyze the architecture and dynamics of molecular and genetic networks (Starostzik and Marwan 1998; Marwan and Starostzik 2002). In the present work I provide a theoretical framework for the evaluation and design of time-resolved somatic complementation experiments.
P. polycephalum is a protist that in the course of its life cycle forms multinuclear giant single cells, so-called plasmodia that can be grown to almost any desired size (Burland et al. 1993). The plasmodial nuclear population is perfectly synchronous regarding cell cycle and differentiation (Guttes et al. 1961; Rusch et al. 1966). Since plasmodia of identical fusion type spontaneously fuse upon physical contact (Poulter and Dee 1968), heterokaryons from cells of otherwise different genotype can be easily obtained and used to analyze signaling events by time-resolved somatic complementation (TRSC; Starostzik and Marwan 1998). Since plasmodia of almost any relative size may be fused with each other, network components can be easily titrated and the relative dosages of the corresponding genes can be fine tuned. In an earlier study, complementation of plasmodial strains by fusion was successfully performed with temperature-sensitive mutants impaired in growth, viability, and nuclear replication (Laffler et al. 1979).
Its life cycle makes P. polycephalum a genetic organism (Burland et al. 1993). Under natural conditions, mating of two haploid uninuclear myxamoebae results in the formation of a diploid zygote that develops into a diploid plasmodium. In contrast, amoebae that carry the gadAh mutation can develop apogamically into a haploid multinuclear plasmodium (Wheals 1970; Anderson and Truitt 1983; Figure 1A). After mutagenesis of gadAh amoebae, haploid mutant plasmodia can be obtained and screened for both dominant and recessive mutations without the need to generate homozygous diploids (Cooke and Dee 1975).
Plasmodia have an unlimited replicative potential and grow as long as nutrition is available. Starving plasmodia become competent for the induction of sporulation by visible or UV light, heat shock, or other stimuli (Sauer et al. 1969). Light stimuli are perceived independently by a blue light photoreceptor or by phytochrome, which is the photoreceptor for far-red light (Starostzik and Marwan 1995b; Lamparter and Marwan 2001). Starvation and photoreceptor activation or heat shock are integrated in parallel pathways (Figure 1B; only the farred-dependent pathway is shown). Gain of sporulation competence by starvation involves sporulation-promoting factors like Ca2+ and malate that confer autocrine signaling (Renzel et al. 2000), the induction of nitric oxide synthase (NOS), and the activation of a guanylate cyclase through a nitric oxide (NO)-dependent pathway (Golderer et al. 2001).
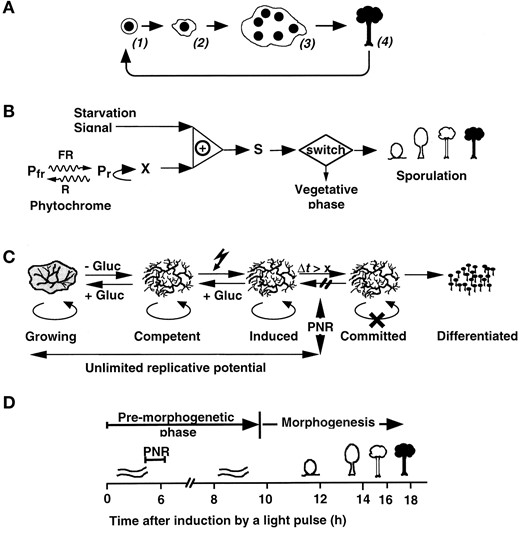
—Plasmodial development and sensory control of sporulation in Physarum polycephalum. (A) Scheme of the life cycle of P. polycephalum during apogamic development. Spores (1) germinate to give a haploid, mononuclear amoeba (2), which propagates by mitotic cell division. At high population density, amoebal cells may develop into a haploid, multinuclear plasmodium (3). Following growth and starvation, the plasmodium can be induced to sporulation by visible light. Several hours after commitment the plasmodial protoplasmic mass splits and develops into many individual fruiting bodies. Mature fruiting bodies (4) finally release ripe, haploid spores (1). Note that the life cycle of the wild type usually is diploid and mating of two haploid amoebae then is a prerequisite for plasmodial development and allows genetic analyses. However, to a low extent, viable spores can also be recovered from a very small population of homozygous diploid nuclei in an otherwise haploid plasmodium (Laffler and Dove 1977). (B) Sensory control of sporulation by starvation and far-red light. Sporulation of starved, competent plasmodia is triggered by a short pulse of far-red light (FR) through photoconversion of the phytochrome photoreceptor (Pfr) into its active state (Pr). If Pr is reconverted to Pfr by red light before a sufficient amount of the X-signal is formed, the plasmodium will not sporulate. If Pr and the starvation signal together are present at least for some hours, the plasmodium is committed to sporulation by accumulation of a sufficient amount of morphogenetic signal (S). The morphogenetic signal can be assayed through its ability to cause sporulation of incompetent plasmodia. Note that only the phytochrome-dependent pathway is shown. This scheme was adapted from Starostzik and Marwan (1995a). (C) Plasmodia pass through several physiological stages prior to sporulation. When the nutrient source is exhausted, plasmodia stop growing and develop sporulation competence during several days of starvation. Competent plasmodia are induced if exposed to visible light. After induction it takes several hours (Δt) until a plasmodium loses its unlimited replicative potential (symbolized by the oval arrows) and is irreversibly committed to sporulation. Growing, competent, or induced plasmodia (or small explanted pieces of them) resume growth if supplied with nutrients like glucose. Beyond the point of no return (PNR) committed plasmodia do not resume growth upon transfer to glucose-containing medium; instead the visible developmental program of sporulation is initiated several hours later. (D) After induction of sporulation there is a premorphogenetic phase without any visible changes in the plasmodial morphology. Morphogenesis starts at ∼10 hr after induction when the plasmodial strands break up into small nodular structures (nodulation stage). Each nodule culminates and differentiates into a melanized fruiting body that is made up of different cell types. Finally, haploid single nuclear spores are formed in the sporangium by meiotic cleavage of the multinuclear protoplasmic mass. Plasmodial commitment (PNR) occurs in the middle of the premorphogenetic phase. This scheme was adapted from Starostzik and Marwan (1998).
When induced by a short light pulse (dependent on the photon exposure; several minutes can be sufficient) it takes on average 4–6 hr until competent plasmodial cells lose their unlimited replicative potential and become irreversibly committed to sporulation (Figure 1C). Until that so-called point of no return, quenching the starvation signal by feeding glucose can still prevent irreversible commitment and no visible response to the otherwise inductive light stimulus occurs (Chapman and Coote 1982; Figure 1, B and C). In committed cells a cascade of differentially regulated genes that contribute to the many new proteins required for fruiting body formation is expressed (Putzer et al. 1984; Martel et al. 1988). About 4 hr after passing the point of no return, visible morphogenesis starts by cleavage of the plasmodial strands into nodular structures that culminate and finally form the fruiting body that contains the ripe, haploid spores (Figure 1D; Guttes et al. 1961; Nishibayashi et al. 1987). After being released, these spores can germinate under suitable conditions to give amoebae that again can develop into a plasmodium (Figure 1A).
We have shown experimentally that TRSC may occur by fusion of induced with noninduced plasmodia that carry different mutational defects in the sporulation control network (Figure 2A). When a mutant strain that carries a dominant negative block in the light-dependent sporulation control (pho-1) is irradiated (★) and subsequently fused to a plasmodium (vac-1) carrying a block through recessive mutation at another step of the same pathway, the heterokaryon pho-1★ + vac-1 does not sporulate because of the dominant negative effect of the pho-1 mutation (Figure 2, left). When in contrast the plasmodium carrying the recessive mutation is irradiated and after a delay time Δt fused with the nonirradiated dominant negative mutant (vac-1★ + pho-1), the probablilty that the heterokaryon will sporulate continuously increases with Δt elapsed between light stimulation of the recessive mutant and the fusion event (Marwan and Starostzik 2002). It was concluded that the time-dependent loss of the dominant negative effect of pho-1 is caused by bypassing the dominant negative mutation by the signaling processes that occur in the fusion partner carrying the recessive mutation (Figure 2B, right). How can a dominant negative mutation be bypassed? If fusion occurs at an early stage the heterokaryon does not sporulate because no signaling intermediate downstream of the dominant negative block has been activated and signaling hence cannot proceed along the pathway. However, if plasmodia fuse after signaling in the light-induced recessive mutant has already proceeded beyond the step that correspondingly is blocked in the dominant mutant, the resulting heterokaryon in fact can sporulate. This is because the recessive block that prevents the light-induced plasmodium from sporulation on its own is removed by contributing the wildtype gene product from the dominant negative mutant. In the heterokaryon, the dominant negative block still persists, but does not block the ongoing downstream events. Since complementation will work only if the dominant negative block is upstream of the recessive one, this type of experiment indicates the regulatory hierarchy of genes and their products within the network.
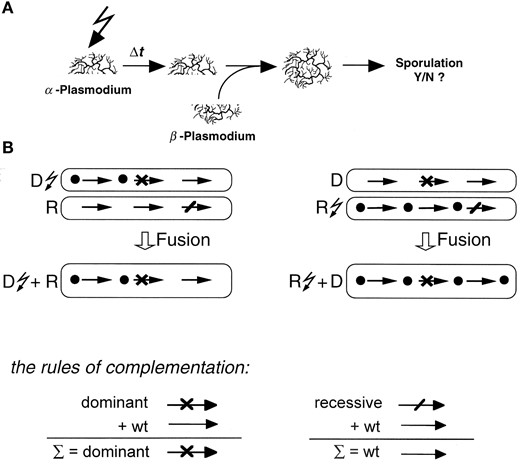
—Time-resolved somatic complementation by fusion of two mutant plasmodia. (A) Experimental procedure. The α-plasmodium is exposed to a short pulse of far-red light (flash symbol) and is further incubated in the dark for a certain delay time Δt. The exposed plasmodium is then fused to a second (β-)plasmodium that has not been exposed to any light. After fusion, the heterokaryon is maintained in the dark until the developmental decision is visible. (B) Scheme of the time course of signaling processes occurring before and after fusion of two plasmodial mutant cells. Dots indicate the activation of successive signaling intermediates in the α-plasmodium before fusion and in the resulting heterokaryon. Blocks due to dominant negative mutations (×) persist in the presence of the corresponding wild-type gene product contributed by the fusion partner, while recessive blocks (/) disappear. Signaling ends successfully only if the dominant block is upstream of the recessive (right) and if signaling in the α-plasmodium carrying the recessive mutation has bypassed the dominant block in the β-plasmodium before fusion (open arrow) occurs. There is no sporulation of the heterokaryon if the dominant negative mutant is irradiated (left).
To provide a theoretical framework for the interpretation of complementation effects and for the experimental design in network analysis, we consider the kinetics of mutant complementation as it occurs when the cytoplasms of two cells mix. We first develop a kinetic minimal model of the sporulation control network that accounts for the experimental results obtained through physiological characterization of wild-type plasmodia. In turn, the properties of in silico mutants of this model network and their behavior during TRSC experiments are analyzed. By computer simulation we show how the regulatory hierarchy between genes can be determined and how the experiments are designed that allow for this conclusion. Although the simulations were performed using the kinetic model for sporulation control, these conclusions do not depend on the validity of the model from which they were derived.
RESULTS
Kinetic model of sporulation control: Starving plasmodia that are exposed to a far-red light pulse pass through several well-defined physiological states. Immediately after an inductive far-red pulse that photoconverts the Pfr photoreceptor to its active Pr form (Figure 3), the induction may be reverted by a pulse of red light that reconverts Pr to Pfr. This photochromic behavior is typical for phytochrome-type photoreceptors. Reversible photoconversion of the phytochrome photoreceptor by farred and red has been detected spectroscopically (Lamparter and Marwan 2001) and becomes obvious by the suppression of sporulation of plasmodia that are subsequently exposed to a red pulse (Starostzik and Marwan 1995a,b). However, with increasing delay time elapsed between the inductive far-red and the subsequently delivered red pulse, the reversibility of the far-red light induction of sporulation is gradually lost until the red pulse does not cause any measureable effect. This indicates that the photoactivated phytochrome (Pr), before being reverted to Pfr by the subsequent red pulse, has caused the formation of a downstream intermediate (X-signal) to an extent sufficiently high to irreversibly commit the plasmodium to sporulation (Starostzik and Marwan 1995a).
![—Kinetic model for the sensory control of sporulation in Physarum polycephalum. Two inputs, far-red light and glucose, control the developmental switch circuit through formation of the sporulation signal S. Functional elements are indicated to make the structure of the network more easily comprehensible. Photoreceptor- and glucose sensor-dependent pathways are integrated by a mechanism behaving like a logic AND gate (Starostzik and Marwan 1994). The output of this type of boolean logic element is true only if two input signals are present. The behavior of the toggle switch has been described by Gardner et al. (2000). Transcription of gene S is repressed by the product of gene V in a cooperative manner while the product of gene S represses the transcription of V. According to Gardner et al. (2000), the changes in concentrations of S and V within the toggle switch circuit are d[S]/dt =α1/(1 + [V]β) – S and d[V]/dt =α2/(1 + [S]γ) – V, where α1 and α2 are the synthesis rates of S and V, respectively, in the absence of any repressor and β and γ are the Hill coefficients for the repression of the synthesis rates by V and S gene products, respectively.](https://oup.silverchair-cdn.com/oup/backfile/Content_public/Journal/genetics/164/1/10.1093_genetics_164.1.105/4/m_gen6718.f3.jpeg?Expires=1716460970&Signature=tnlMCUP4kib9b-mlvpw7U46SLYBv2odyvdfKyesGzRDJCbzbTyh05ORiB0I-YnqC56GZPJiLMteFWnvJ6x4SaCUqM78ZW11QzOT07Ti4hRO1Cvoj4uXJcWZWXLyGFm5BqxZVM4d~5gMeE7nsThDvrD9A1~SV~FqbfSgayGo18I9gA4ACTpW0cHurHLYp-~M7g6C8-nEHwx1Iuig6GRiBa0Uo0imLv8le79YulERBqMoZ422fTF~39uzOsRQoARP28X755zYfp2Io7B1qp5bTBnQ2JEvNV~dyAJz7DQrfb6je0xV2sNgcRQS1zIJasUG4hDTQSsWdjgkSlxyA63XH5Q__&Key-Pair-Id=APKAIE5G5CRDK6RD3PGA)
—Kinetic model for the sensory control of sporulation in Physarum polycephalum. Two inputs, far-red light and glucose, control the developmental switch circuit through formation of the sporulation signal S. Functional elements are indicated to make the structure of the network more easily comprehensible. Photoreceptor- and glucose sensor-dependent pathways are integrated by a mechanism behaving like a logic AND gate (Starostzik and Marwan 1994). The output of this type of boolean logic element is true only if two input signals are present. The behavior of the toggle switch has been described by Gardner et al. (2000). Transcription of gene S is repressed by the product of gene V in a cooperative manner while the product of gene S represses the transcription of V. According to Gardner et al. (2000), the changes in concentrations of S and V within the toggle switch circuit are d[S]/dt =α1/(1 + [V]β) – S and d[V]/dt =α2/(1 + [S]γ) – V, where α1 and α2 are the synthesis rates of S and V, respectively, in the absence of any repressor and β and γ are the Hill coefficients for the repression of the synthesis rates by V and S gene products, respectively.
Plasmodia that have passed the point where sporulation can no longer be prevented by a red pulse can still be prevented from sporulating by refeeding with glucose. Suppression of sporulation by glucose is possible only until the point of no return has been passed and the plasmodium has lost its unlimited replicative potential and is irreversibly committed to sporulation (Figure 1C and see below).
In committed plasmodia, the entire cytoplasmic mass synchronously and completely develops into fruiting bodies. This synchronous all-or-none behavior holds under experimental conditions where the induction to sporulation occurs stochastically. If starved plasmodia are exposed to a nonsaturating inductive light pulse that causes sporulation of only a certain percentage of a plasmodial population, the developmental decision is all or none. The same holds for far-red light-induced plasmodia that are exposed to red light or feeding with glucose at time points where part of the population is already committed to sporulation. This behavior indicates the existence of a developmental switch that is active throughout the entire plasmodium and that has to be considered as an essential component of any kinetic model of sporulation control.
The experimental results described above can be simulated by the following kinetic model of the sporulation control network (Figure 3). Far-red light converts the physiologically inactive Pfr form of phytochrome into the active Pr form. Pr decays thermally into an inactive form (Lamparter and Marwan 2001). Alternatively, Pr catalyzes the formation of the active X-signal (Xa) from its inactive precursor (Xi). Xa is reconverted to its inactive form Xi independently of Pr (antagonistic activity of a kinase and a phosphatase could be a molecular equivalent). Xa causes the formation of preS from prepreS. preS finally is converted to the sporulation signal S, which is formed in addition to that portion of sporulation signal that is continually turned over in the toggle switch circuit. (A biochemical equivalent could be the formation of S from an inactive covalently modified derivative or the transcription of the S mRNA from an alternative promoter. Note that the true biochemical mechanism is not relevant for the line of argumentation.) The formation of S from preS is catalyzed by Ya (X, Y, and Pr could be kinases or phosphatases). Ya is constitutively present in starving plasmodia but is inactivated once glucose is added. Addition of glucose hence inhibits the formation of S from preS and thereby may block sporulation of far-red-stimulated plasmodia.
Since the molecular mechanism of the switch is not yet known, we use a simple toggle switch for modeling. The toggle switch displays a theoretically well-understood bistable behavior and has been implemented artificially in Escherichia coli cells, where it assumes its predicted triggerable bistability (Gardner et al. 2000). In plasmodia that are growing (i.e., not starving) or in starving plasmodia that have not been induced by farred light, a constantly high concentration of V keeps the plasmodium in the vegetative stage and the transcription of the sporulation signal S is repressed by V. If starved plasmodia are induced by a far-red light pulse of sufficient intensity, formation of S from preS inhibits the transcription of gene V. Inhibition either is transient or triggers the toggle switch. In the latter case, the switch assumes a state where S is high and the transcription of gene V is continuously repressed. Switching from high V, low S to low V, high S results in the transition from the vegetative stage to sporulation, respectively. As shown in Figure 4, the kinetic model qualitatively and quantitatively simulates the threshold-like response of plasmodia to far-red light. The model also accounts for the response of far-red-induced plasmodia to red light and to glucose (Figure 4; for details see below). The set of differential equations describing the model is given in Table 1 and the parameter values used for simulation of the experimental results are listed in Table 2.
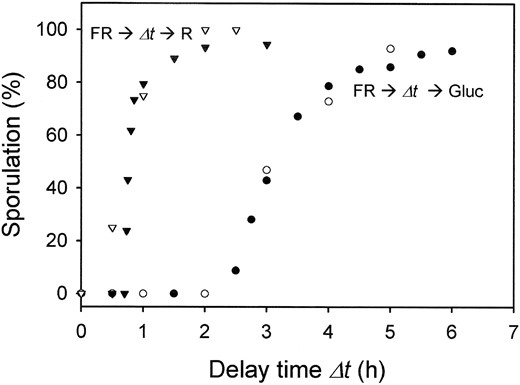
—Suppression of sporulation of far-red light-exposed plasmodia by a subsequent red light pulse (▾, ▿) or feeding of glucose (•, ○) at different delay time Δt after the far-red pulse. Experimental data are taken from Starostzik and Marwan (1995a; open symbols) and simulated results (solid symbols) are shown. A total of 600 plasmodia were simulated for each data point.
In experiments where the effectiveness of light or other factors in causing sporulation is titrated, the readout is the percentage of plasmodia that sporulate in response to the treatment. The above-mentioned all-or-none behavior of the plasmodia is due to a stochastic phenomenon. To generate a stochastic readout in the model, the concentration of at least of one of the components had to be taken from a probability distribution. Exponential distribution of Ya in individual plasmodia gave the best result in Monte Carlo simulations. Whether S or V finally wins after a pulse of light or addition of glucose then depends on which particular value of Ya is randomly taken for the individual plasmodium from the probability distribution, while all other parameters are kept constant. To simulate the response of a plasmodial population, the model is run many times (once for each individual plasmodium) for a given parameter set and the percentage of runs where S finally wins (sporulation) is related to the total number of model runs and
Differential equations describing the kinetic model for the sensory control of sporulation in Physarum polycephalum shown in Figure 3
Kinetic simulations were performed by numerical integration of the differential equations using the Runge-Kutta algorithm implemented by the ModelMaker 4.0 software (Cherwell Scientific, Oxford).
thus gives the simulated percentage of sporulated plasmodia in response to a given treatment.
The experimental result that in those far-red light (FR)-induced plasmodia, where the signaling processes have proceeded so far that sporulation cannot be prevented by red light (R) any more (at 2 hr after the far-red pulse), feeding with glucose still completely prevents sporulation (Figure 4; Starostzik and Marwan 1995a), puts a strong constraint on the minimum number of steps between Xa and S. To simulate the kinetics of the FR → Δt → glucose experiment, while also meeting the FR → Δt → R kinetics, at least one step (preS) between S and its Xa-controlled precursor (prepreS) had to be incorporated into the model.
The bistable behavior of the toggle switch in response to far-red light is shown in Figure 5A. After induction by far-red light, the level of S increases by formation of extra S from preS. Whether or not addition of glucose will prevent sporulation depends on whether a sufficiently high amount of S has been formed to suppress the transcription of V to an extent that the switch is triggered (and S wins over V). If this is not the case, the rise in S is only transient and S decays to its lower steady-state level (above zero). If glucose is delivered so late that a certain threshold level of S has been passed (Figure 5B, inset), although formation of S from preS (phase a in Figure 5B) drops (phase b), the switch is nevertheless triggered and continuous formation of S through expression of gene S (phase c) causes a new
Model parameters used for simulation
| Parameter | Value | Parameter | Value |
|---|---|---|---|
| [Pfr] | 10 | k d | 0.1 |
| [Pr] | 0 | k ia | 0.1 |
| [Xi] | 6 | k ai | 0.8 |
| [Xa] | 0 | kx | 0.2 |
| [prepreS] | 200 | ky | 1 |
| [preS] | 0 | k G | 0.1 |
| [S] | 0 | α 1 | 30 |
| [V] | 50 | α 2 | 50 |
| [Ya] | 0.9 | ||
| I fr σ fr ϕ fr | 0.1 | ||
| I r σ r ϕ r | 0 |
The initial values at time zero are given. In each simulation, the toggle switch was preequilibrated for 5 hr before stimulation of the plasmodia. Pulses of far-red light were 0.25 hr and those of red light 0.33 hr in length. Glucose concentration was either 0 or 1.
bistable state of the switch. As shown in Figure 4, model calculations mimic qualitatively and quantitatively the experimental data obtained on far-red light-exposed plasmodia that were subsequently exposed to red light or glucose.
Gene dosage-effect curves: We have developed a kinetic minimal model that explains the plasmodial response to far-red light, the time-dependent loss of photorevertability of the induction by red light, and the time-dependent loss of the potential of glucose to suppress the developmental decision to sporulate. Experimentally we have recently shown that by fusing a plasmodium carrying a recessive mutation with a plasmodium that exhibits a dominant negative effect in a heterokaryon (see Introduction for details), the sequence of regulatory events controlled by the two genes can be determined if the complementation testing is performed in a time-dependent manner (Marwan and Starostzik 2002). Now we investigate whether our model can be used to simulate such an experiment, i.e., the fusion of a dominant negative and a recessive mutant plasmodium. As a prerequisite we need to generate an in silico mutant that exhibits a dominant negative effect. A mutation may behave dominant negative for different reasons (see discussion for details). The mechanistically simplest way is that a loss-of-function mutation (and those are most frequently obtained in the lab) displays a phenomenon called “haplo-insufficiency,” which characterizes the fact that half of the wild-type level of a gene product is not sufficient to maintain a wild-type phenotype. In silico mutation of which of our model components could cause a haplo-insufficient phenotype? To answer this question, we simulated the percentage of sporulating plasmodia in response to a saturating far-red light pulse (in the absence of glucose) as a function of the gene product concentration and obtained dosage-effect curves with different shapes for the different components. Two examples are shown in Figure 6. While the dosage dependence of Ya is Michaelis-Menten type, Xi displays a strong nonlinear dependence. According to those curves, the reduction of the dosage of gene X and hence its product from wild-type level to 50% of wild type could reduce the percentage of sporulating plasmodia from close to 100% to zero, while reduction of the dosage of the Y protein would either cause no effect on the phenotype or reduce the number of sporulating plasmodia at maximum by 50%. Notably, the simulation demonstrates that a protein that acts downstream of a protein that has a highly nonlinear and threshold-type dosage effectiveness (Xa) and at the same time upstream of a highly nonlinear element (the toggle) can still reflect its mechanism of action by producing a hyperbolic (Michaelis-Menten type) dosage-effect curve at the final output (i.e., sporulation). We now use loss-of-function mutations in these two genes (X and Y) for simulation of the TRSC experiment.
![—Kinetics of sporulation signal formation in response to network activation. (A) Time course of the sporulation signal in a starved, competent plasmodium in response to a far-red pulse of various intensities (photon exposure). Numbers indicate the relative pulse intensity (×10–2). Farred pulses below threshold (2, 4) cause a small and transient increase in the concentration of S, which is due to the decay of preS before it returns to the dark level (0). Above threshold (6–10), additional S is formed through the toggle switch circuit and a new bistable steady state (high S, low V) is assumed, which is now independent of either far-red light or glucose. (B) Quenching of the sporulation signal in farred light-exposed plasmodia by glucose. The time course of the sporulation signal in response to a saturating far-red pulse (relative photon exposure Ifrσfrφfr = 0.4) was calculated and the addition of glucose at different time points (1–10 hr) after the far-red pulse was simulated. Until 2 hr after far-red exposure the sporulation signal is completely quenched by glucose. At later times (3–10 hr) quenching of preS decay by glucose still occurs but not to an extent required to suppress switching. The time course of S for the addition of glucose at 3 hr after the farred pulse is shown in the inset [numbers on the abscissa indicate the time elapsed after the FR pulse (hours)]. Before glucose is added (a) S is formed by light-induced decay of preS and to a small extent also through the toggle switch circuit. After addition of glucose (b) decay of preS is suppressed and S decays more quickly than it is formed, until S finally wins (c) and the toggle is switched.](https://oup.silverchair-cdn.com/oup/backfile/Content_public/Journal/genetics/164/1/10.1093_genetics_164.1.105/4/m_gen6718.f5.jpeg?Expires=1716460970&Signature=aJZap2lwGvjHnomrN-wr1zrxDq6bso1Wz2beuIoHO5EywuErxRRlPypNsM86BNCoXu3gwByecClo~RPUhqWcbkj-wchUqWas9PTLnTqmlercqAbH5oil9fp3dnvoP8-UtPzSQB1ktG3UAgcApT5Po5lMJKyIr1cc-ZRozCAqMNLmAr7MC14JU~iTI-Bfotwa2-C72UjuvKnwS63Hw7m~CBXrjf9dhe8U6Y2gIn8xSh6HNnKuOWcwf5qb5oy8GIGBKf8YppA33LLHVkMhMVU1gA7ZNtvcIXYRRwKsC6-EjRA2ybroSbYmi5RySTZcfcbVGBQHEFGAiJpgsjXf3Jqs9g__&Key-Pair-Id=APKAIE5G5CRDK6RD3PGA)
—Kinetics of sporulation signal formation in response to network activation. (A) Time course of the sporulation signal in a starved, competent plasmodium in response to a far-red pulse of various intensities (photon exposure). Numbers indicate the relative pulse intensity (×10–2). Farred pulses below threshold (2, 4) cause a small and transient increase in the concentration of S, which is due to the decay of preS before it returns to the dark level (0). Above threshold (6–10), additional S is formed through the toggle switch circuit and a new bistable steady state (high S, low V) is assumed, which is now independent of either far-red light or glucose. (B) Quenching of the sporulation signal in farred light-exposed plasmodia by glucose. The time course of the sporulation signal in response to a saturating far-red pulse (relative photon exposure Ifrσfrφfr = 0.4) was calculated and the addition of glucose at different time points (1–10 hr) after the far-red pulse was simulated. Until 2 hr after far-red exposure the sporulation signal is completely quenched by glucose. At later times (3–10 hr) quenching of preS decay by glucose still occurs but not to an extent required to suppress switching. The time course of S for the addition of glucose at 3 hr after the farred pulse is shown in the inset [numbers on the abscissa indicate the time elapsed after the FR pulse (hours)]. Before glucose is added (a) S is formed by light-induced decay of preS and to a small extent also through the toggle switch circuit. After addition of glucose (b) decay of preS is suppressed and S decays more quickly than it is formed, until S finally wins (c) and the toggle is switched.
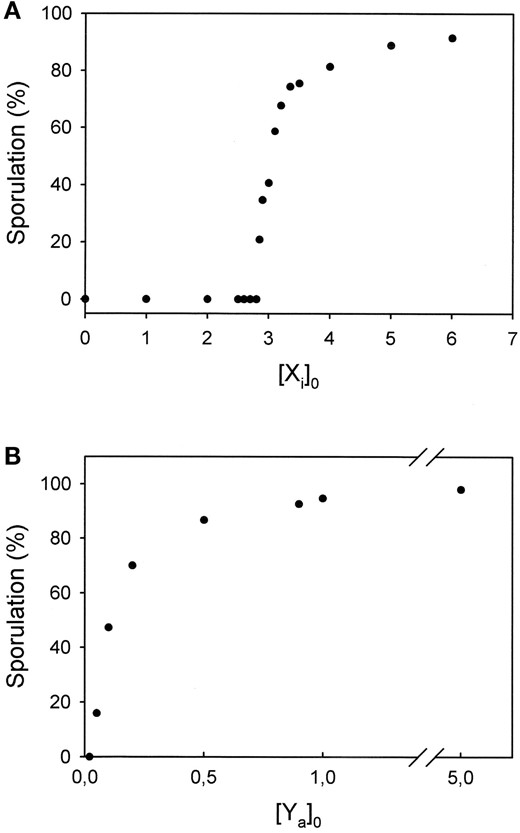
—Simulated response of starved, competent plasmodia with different cellular concentrations of Xi (A) or Ya (B) before application of a saturating far-red pulse.
Modeling TRSC by fusion of two plasmodia: The basic scheme of a TRSC experiment is shown in Figure 2A. One plasmodium is exposed to a stimulus light pulse. A certain delay time Δt after the pulse, the light-exposed plasmodium (termed as the α-plasmodium) is fused with a nonexposed plasmodium (β-plasmodium). After the two cytoplasms have mixed, the developmental decision, i.e., whether sporulation of the heterokaryon occurs or not, is evaluated. Experimentally, we have shown that complementation of the mutational defects of two plasmodia affecting different elements of the sporulation control network depends on (1) to what degree the mutations are dominant or recessive, (2) which of the two plasmodia is irradiated, and (3) the time interval Δt elapsed between irradiation and fusion (Marwan and Starostzik 2002).
What happens kinetically in terms of signaling if two mutant plasmodia, one light induced and one not irradiated, fuse? How do the signaling processes proceed while the cellular content of the light-activated plasmodium mixes with the noninduced plasmodium and how do the different mutations in the signaling pathways of the two plasmodia interfere with these processes? For simplicity let us first consider a situation where two plasmodia that have not been stimulated by light fuse. When the contents of the two plasmodia are identical, the concentration of each individual compound does not change upon cytoplasmic mixing. Now assume that one plasmodium expresses green fluorescent protein (taken for a wild-type gene product) and the other red fluorescent protein (taken for a mutant gene product); then the green fluorescent protein (GFP) evenly spreads over the fused plasmodium as does red fluorescent protein (RFP) and once mixing is complete, both proteins are equally distributed in both plasmodial halves and are only half as concentrated as before fusion occurred (provided the two plasmodia have been of equal size). In a first approximation to this, the two plasmodia are formally treated as two compartments, the contents of which mix with a first-order kinetics, which means that the probability of one molecule traveling from one plasmodial half to the other depends on the number of molecules present in this half. The flow rate of any component Xj from one plasmodial compartment (α)to the other (β) is then d[Xjα]/dt =–kmix[Xjα] + kmix[Xjβ], where [Xjα] is the concentration of the compontent Xj in the plasmodial compartment α, from which it is transported into the compartment β, and [Xjβ] is the concentration of the component Xj that has been transported into the plasmodium β and that now equilibrates with the α-plasmodium, until the two cytoplasms are completely mixed (and d[Xjα]/dt = 0; Figure 7). The rate constant kmix accounts for the active and vigorous cytoplasmic streaming that drives mixing.
In such a system, there are two types of flows between the pools of each individual compound. One type of flow is due to physical mixing of the two cytoplasms (Figure 7, solid arrows), and the other (open arrows) is due to the ongoing biochemical interactions during signaling. During a TRSC experiment the two types of flows are superimposed. How realistic the simulation is depends on how precisely the mixing kinetics of the cytoplasms are met (see discussion).
The sequence of regulatory events indicated by fusion of plasmodia carrying dominant and recessive mutations: Dominant upstream recessive: As shown by the gene product dosage-effect curves (Figure 6), in silico deletion of X is expected to exhibit a dominant negative effect in TRSC experiments while deletion of Ya should be recessive. For simulation of TRSC these two mutations were chosen. When X– was irradiated and fused with Y– (X–★ + Y–), the heterokaryon did not sporulate, independent of the time elapsed between irradiation and fusion (Figure 8). Before fusion, the active Pr photoreceptor species is formed by the far-red pulse, but there is no activation of the downstream signaling steps because X is completely missing due to the loss-of-function mutation. After fusion of the two plasmodia has occurred, the concentration of X is not sufficiently high to allow the formation of S with a rate that could trigger the toggle switch and hence the plasmodium does not sporulate.
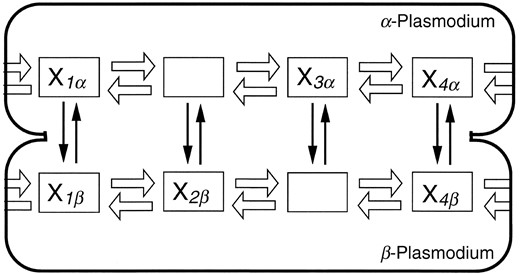
—Scheme illustrating the change in concentration of signaling intermediates during a time-resolved somatic complementation experiment. Open arrows indicate biochemical reactions, solid arrows indicate the physical flow of components between the two fused plasmodia due to cytoplasmic mixing. Empty open rectangles indicate signaling components deleted by mutation, which are resupplied through fusion of α- and β-plasmodia, thus allowing the signaling pathway to end successfully.
If the recessive Y– mutant is irradiated and subsequently fused with the nonirradiated dominant X– mutant (Y–★ + X–), whether the plasmodium sporulates depends on the delay time Δt elapsed between irradiation and fusion. If fusion occurs at an early time, the wild-type gene product X is withdrawn by the nonirradiated X– mutant so that the formation of preS is reduced and as a result, S cannot be produced at a sufficiently high rate to allow switching. If plasmodia fuse later, then preS in the irradiated plasmodium has already been formed to a certain extent although the subsequent step, formation of S catalyzed by Ya (which is deleted in the mutant), did not occur. When the irradiated plasmodium (Y–★) is now fused with the nonirradiated (X–) plasmodium, the dominant block of preS formation through withdrawal of X still builds up. However, at the same time, addition of Ya provided by the X– mutant allows the pool of preS that has accumulated prior to fusion to be converted to S. The resulting pulse in S concentration triggers the toggle switch and causes sporulation. As shown in Figure 8, the dominant negative effect of X– is gradually lost with increasing Δt, as reflected by the increasing probability that the heterokaryon will sporulate. The kinetics of the curves are similar to the bypass of the dominant negative pho-1 mutation by the wild-type gene product of either wildtype or sporulation-deficient vac-1 mutant plasmodia (Marwan and Starostzik 2002) and referred to in the Introduction.
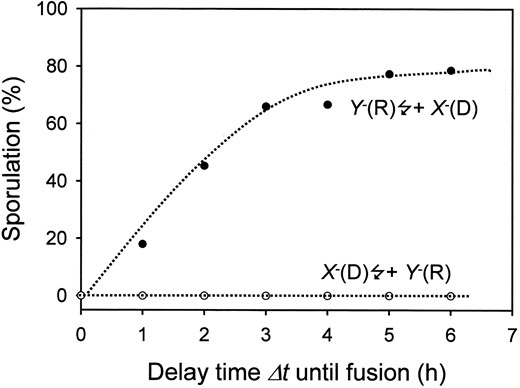
—Simulation of a time-resolved somatic complementation experiment by fusion of two plasmodia, one carrying a dominant (X–) and the other a recessive (Y–) in silico null mutation of the genes encoding the components X and Y of the model shown in Figure 3. A total of 150 plasmodia were simulated for each data point. Dominance (D) and recessiveness (R) of the mutations are indicated in parentheses for each experimental regime. Dotted lines were drawn to guide the eye.
Recessive upstream dominant: As expected from the previous results, there will be no sporulation if the dominant mutation is downstream of the recessive one. To simulate this situation, an in silico mutant deleted in the phytochrome photoreceptor (recessive according to the gene dosage-effect curve) was fused with the dominant X– mutant. According to the model calculation, the resulting heterokaryons did not sporulate irrespective of which of the two mutant plasmodia was irradiated before fusion and irrespective of the delay time Δt between irradiation and fusion (result not shown). The simulation accounts for the experimental result obtained by fusing a nonirradiated wild-type plasmodium (i.e., no Pr present) with a pho-1 plasmodium, which causes no sporulation, or an irradiated pho-1 plasmodium fused to wild type, which causes no sporulation as well (Marwan and Starostzik 2002).
As summarized in Table 3 there is only one situation in the combination of dominant and recessive mutations where complementation may occur: namely, when the dominant mutation affects a signaling component upstream of that inactivated by a recessive mutation. If
Predicted effect of the relative hierarchy of two steps blocked by dominant (D) or recessive (R) mutation in two mutant strains on somatic complementation capability
| Situation | Experiment | Sporulation | Conclusion |
|---|---|---|---|
| D upstream R | D★ + R | No | |
| R★ + D | Yes = f(Δt) | ||
| R upstream D | R★ + D | No | |
| D★ + R | No |
| Situation | Experiment | Sporulation | Conclusion |
|---|---|---|---|
| D upstream R | D★ + R | No | |
| R★ + D | Yes = f(Δt) | ||
| R upstream D | R★ + D | No | |
| D★ + R | No |
Light stimulation of a mutant plasmodium is indicated by a star.
no complementation is observed upon irradiation of a plasmodium carrying a recessive mutation and subsequent fusion with a plasmodium that contributes a dominant block, the recessive block is either upstream of the dominant block or downstream but the complementation experiment for some unknown reason might not work. In this case no firm conclusion is possible, unless the dominant or recessive properties of the two mutations are changed experimentally (see discussion).
DISCUSSION
We have provided a theory of TRSC and used it for computer simulation of complementation experiments. The computer model was developed to facilitate both the interpretation of experimental results and the design of experiments for molecular network analysis. The theoretical considerations demonstrate how TRSC opens a way for the systematic analysis of the architecture and dynamics of molecular and genetic networks within a living cell. The corresponding experimental work is done with plasmodia of P. polycephalum at the moment, but the approach certainly could be taken in any system where the activity of genes or their products can be controlled in a time-resolved manner.
To simulate TRSC and to demonstrate how it can be employed for the systematic analysis of network structure and function, we first developed a kinetic model for the photosensory control of sporulation. The model is minimal in the sense that the number of elements upstream of the toggle switch could not be further reduced without destroying its capability to simulate the experimental data. The model is composed of functional elements that have been detected experimentally and that were interconnected to simulate the experimental results qualitatively and quantitatively. The model can now be used as a seed for the interpretation of experimental results on mutants altered in the sporulation control network through a reverse modeling approach. Although the kinetic model was used for simulation of TRSC experiments, the general conclusions drawn regarding the application of TRSC for network analysis do not depend on the validity of the model. This is an important point since, with ongoing experimental work, the elements of the model step by step will be replaced by the products of identified genes and the model structure certainly will get more and more complex and must be corrected in an iterative way. This is obviously true for the toggle switch circuit. At present, no information on the molecular mechanism of switching the developmental program of plasmodia is available, although mutants disturbed in the natural allor-none behavior of the developmental decision have now been obtained (A. Sujatha and W. Marwan, unpublished results). However, the all-or-none behavior of sporulation control in wild-type plasmodia as well as the fact that a small piece of a committed plasmodium can commit a large competent plasmodium when the two are fused (Hildebrandt 1986; Starostzik 1995) clearly suggests the existence of a circuit involving an autocatalytic or cooperative mechanism. This conclusion is supported by the fact that we were not able to simulate the sensory control of sporulation just by the formation of a sporulation signal in a linear sequence of catalytic events without involving a cooperative and autocatalytic step.
Modeling of TRSC as a tool for network analysis: By simulation we have demonstrated how the sequence of regulatory events tagged by a dominant and a recessive mutation can be determined through TRSC. Although the underlying concept, i.e., bypassing of a dominant negative block in a recessive plasmodium before cytoplasmic mixing, seems as straightforward as classical epistasis tests seem to be, establishing these simple relationships and putting them together is presumably not sufficient to reconstruct the architecture of a network and may even lead to wrong conclusions, since the kinetic effects of deleting a component in a complex network can be complicated and are not always accessible through linear logic or intuition. Therefore conclusions drawn from TRSC experiments should always be checked for consistency with previous conclusions by computer simulation. Vice versa, TRSC experiments providing valuable information on the structure and dynamics of the network should be identified by modeling and the model could even predict the existence of mutants or define screening conditions for finding them.
To be an efficient tool the simulation should meet the kinetics of cytoplasmic mixing as closely as possible. In this work we have used first-order kinetics as a first approximation, which was sufficient to demonstrate basic effects in TRSC and to simulate experimental results that have been obtained by complementation of pho-1 with vac-1 (Marwan and Starostzik 2002) and with other mutants (C. Starostzik and W. Marwan, unpublished results). Although two fused plasmodia exchange their content driven by vigorous active cytoplasmic streaming through rhythmic contraction of actomyosin filaments embedded in the cortical plasm, these plasmodia are certainly not two stirred compartments that are linked by a permeable diaphragm. Instead there is a concentration gradient over each plasmodium while mixing takes place and the kinetics depend on the relative and absolute size of both plasmodia, on whether they are fused side by side or sandwich-wise, and on other factors like cytoplasmic streaming rate. Therefore it is desirable to measure the mixing kinetics during each experiment by using transgenic lines expressing fluorescent proteins of different color and to feed these data back into the model. Mixing can then be modeled by replacing the two compartments (Figure 7) by a two-dimensional array of compartments, if side-by-side fusion is modeled. Side-by-side fusion could possibly provide even more information than sandwich-wise fusion if simultaneous with mixing the expression of luciferase under the control of the promoter of one of the early differentially regulated genes is measured. Concentration dependencies obtained from such experiments could put additional constraints on a kinetic model of the sporulation control network.
Gene dosage-effect curves: The possibility of fusing plasmodia of any relative size with each other provides an easy way for fine-tuning the gene dosage of any mutation. When the output, sporulation or gene expression, is measured, gene dosage-effect curves may provide interesting mechanistic information through their shape (see below) and in addition they may be used as tools to perform TRSC experiments to establish the regulatory hierarchy between two dominant or two recessive mutations. The meaning of the terms dominant and recessive in the context of TRSC is somewhat different from their meaning in classical genetics. Whether a mutation is recessive or dominant or somewhere in between in the classical sense depends on the phenotype that results in a heterozygous diploid, where the gene dosage of the wild type is 50%. The degree of dominance or recessiveness in the heterozygous situation in fact depends on the dosage-effect curve of the mutated or the wildtype gene (Figure 9). Biochemical mechanisms showing how loss of gene function can lead to a dominant phenotype, a frequent phenomenon called haplo-insufficiency as compared to dominant negative effects exhibited by mutated gene products with altered properties, have been discussed recently (Veitia 2002). Whether or not a mutation behaves dominant or recessive in a TRSC experiment depends on the experimental conditions and is not necessarily identical to the behavior of a diploid obtained by crossing.
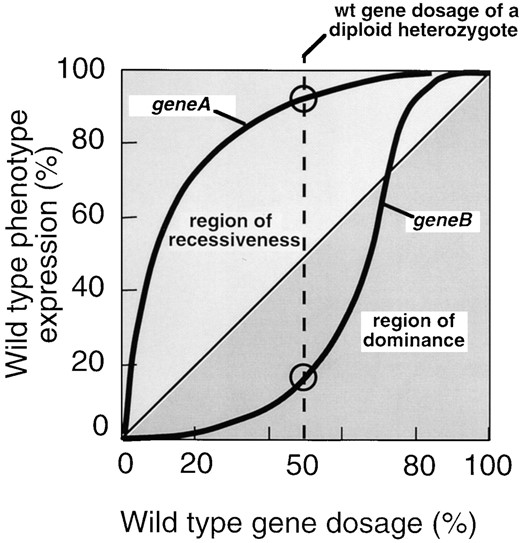
—Scheme explaining dominance, semidominance, or recessiveness of a mutant allele in a diploid heterozygote on the basis of gene dosage-effect relationships. When the degree of wild-type phenotype expression is plotted against the gene dosage (wild-type level corresponds to 100%), a gene dosage-effect curve results, the shape of which may differ from gene to gene. Examples for two hypothetical genes A and B are shown, the null mutations of which are recessive (A–) or dominant (B–) in the heterozygous situation. To which degree a given null mutation is dominant or recessive depends on the degree of phenotype expression at 50% wild-type gene dosage as determined by the gene dosage-effect curve.
If TRSC is to be used to establish the regulatory hierarchy between two dominant mutations, one of the mutations should be made recessive (see Table 3). In contrast, if the hierarchy between two recessive mutations is of interest, a situation should be created where haploinsufficiency results.
Two dominant mutations: On the basis of the gene dosage-effect curve, the mutant plasmodium is fused with wild type. The relative size of the two plasmodia is then adjusted in a way that sufficient wild-type gene product is supplied so that the resulting heterokaryon still shows its phenotype on one hand, but behaves like a recessive mutant in the TRSC experiment.
Two recessive mutations: Again on the basis of the gene dosage-effect curve (to be determined experimentally by titrating mutant with wild-type plasmodia), the gene product deleted in one of the recessive mutants is reduced in the plasmodium to be used for TRSC and carrying a recessive second site mutation to an extent that the first mutation behaves dominant or semidominant in the experiment. In other words, TRSC is carried out with a mutant where loss of function of gene A is recessive together with a double mutant that carries a loss of function of gene B but at the same time a reduced level of gene product A as compared to the wild type. As a consequence, the deletion of gene A then should behave dominant or semidominant in the TRSC experiment. Experimentally, such a strain would be constructed as follows: A mutant deleted in gene A is crossed with a mutant deleted in gene B to give a strain with double deletion A– B–. Next, a plasmodium of the double mutant is fused with a plasmodium that is deleted only in gene B but wild type in gene A. The relative size of the two plasmodia is adjusted in a way that the level of the gene product A is at the value required for the experiment.
How do the entities gene dosage and gene product concentration relate to each other? Certainly, the cellular concentration of a gene product due to potential regulatory effects at the transcriptional, translational, or post-translational level in some cases may not be proportional to the dosage of the gene encoding it (the toggle switch is an example). Nevertheless, by reducing the gene dosage gradually to zero, the effectiveness of potentially compensating regulatory mechanisms will be exhausted, thereby allowing the desired gradual change in gene product concentration from a wild-type level down to zero.
Footnotes
Communicating editor: S. W. Schaeffer
Acknowledgement
This work was supported by the Deutsche Forschungsgemeinschaft and by the Fonds der Chemischen Industrie.
LITERATURE CITED
