


Abstract
We measured different cellular parameters in the methanogenic archaeon Methanococcus jannaschii. In exponential growth phase, the cells contained multiple chromosomes and displayed a broad variation in size and DNA content. In most cells, the nucleoids were organized into a thread-like network, although less complex structures also were observed. During entry into stationary phase, chromosome replication continued to termination while no new rounds were initiated: the cells ended up with one to five chromosomes per cell with no apparent preference for any given DNA content. Most cells in stationary phase contained more than one genome equivalent. Asymmetric divisions were detected in stationary phase, and the nucleoids were found to be significantly more compact than in exponential phase.
SINCE the recognition of Archaea as the third domain of life based on ribosomal RNA comparisons (Woese and Fox 1977), archaeal organisms have been extensively studied. When complete genome sequences were obtained (Bult et al. 1996; Klenk et al. 1997; Smith et al. 1997; Kawarabayasi et al. 1998), it became apparent that the replication, transcription, and translation machineries of archaea are similar to those of eukaryotic organisms, while the genes involved in metabolic processes show more similarity to their bacterial counterparts. However, the products of more than half of the open reading frames in each genome-sequenced organism are yet to be assigned putative functions. Archaea are characterized by further features besides their characteristic ribosomal RNA sequences: the lipid composition (ether glycerolipids) and organization (bi- or monolayer) of the cytoplasmic membrane and also particular modes of energy metabolism, such as methanogenesis and bacteriorhodopsin-driven photosynthesis (Jones et al. 1987).
Among the major cellular functions that remain to be characterized in archaea are chromosome replication, nucleoid segregation, and cell division, and the coordination of these processes with cellular growth. The genes identified from the complete genome sequences suggest that archaeal replication might be eukaryotic-like in nature. Gene products involved in chromosome segregation show similarities to both eukaryal and bacterial proteins, while the cell division apparatus may predominantly be of bacterial type. Because the archaeal cell cycle appears to contain a mixture of features from both bacteria and eukaryotes (reviewed by Bernander 1998), it is possible that archaea may contribute to a better understanding of the evolution of these processes. As eukaryotes might have originated from a fusion event between a bacterium and an archaeon (Gupta and Golding 1996; Martin and Müller 1998; Moreira and Lopez-Garcia 1998), eukaryal cell-cycle characteristics may be derived from those of an archaea-like ancestor.
We have previously focused on the cell cycle of hyperthermophilic organisms from the genus Sulfolobus, which belongs to the crenarchaeotal branch within the archaeal domain (Bernander and Poplawski 1997; Poplawski and Bernander 1997). These organisms exhibit an unusual cell cycle with a short prereplication period and a long postreplication period. Another unusual feature is that in stationary phase the cells rest with two fully replicated chromosomes.
Here, we have extended these studies to include Methanococcus jannaschii, an autotrophic hyperthermophilic methanogen belonging to the euryarchaeotal branch within the Archaea domain (Jones et al. 1983; Woese et al. 1990). The first strain was isolated 15 yr ago from a sediment at the base of a submarine hydrothermal vent on the East Pacific Rise. The cells are irregular cocci that exhibit blue-green fluorescence due to the presence of coenzyme F420 (Jones et al. 1983), with generation times as low as 30 min when grown at 85° and pH 6. The cell wall is composed of an S-layer of hexagonally arranged protein subunits (Whitman et al. 1990). Finally, M. jannaschii was the first archaeon whose genome was completely sequenced (Bult et al. 1996). It consists of a small circular chromosome (1.66 Mb) and two plasmids.
In this study, we have measured DNA content and cell size distributions, both in the exponential and stationary growth phases, for cells grown under different conditions. A light-microscopy analysis of cell morphology, nucleoid conformation, and nucleoid distribution is also presented.
MATERIALS AND METHODS
Strains, media, and growth conditions: M. jannaschii type strain DSM 2661 was obtained from the Deutsche Sammlung von Mikroorganismen und Zellkulturen, Braunschweig, Germany. Cultures were grown at 80° in 120-ml serum bottles containing 20 ml of MGG medium (Huber et al. 1982) supplemented with 0.2% yeast extract, 0.2% peptone, and 0.1% sodium acetate (final concentrations) under a pressurized atmosphere (250 kPa) consisting of H2 and CO2 (80/20% v/v). A preculture kept at room temperature was diluted 200-fold into prewarmed supplemented MGG and incubated until a cell concentration of 1 to 2 × 10⁷ cells/ml was reached. This culture was used as inoculum (0.5% v/v) for the experiment, and samples were collected at different growth phases. To prevent cell lysis, which resulted from a decrease in the gas pressure when the cultures approached stationary phase, the pressure was restored by adding fresh H2/CO2 gas. Growth was monitored by cell counting in a Thoma counting chamber (depth 0.02 mm).
Alternatively, large-scale cultures were grown at 85° in nonsupplemented MGG medium in an enamel-protected fermenter (100 liters; HTE Bioengineering, Wald, Switzerland) under continuous flow stripping with H2/CO2 (2 liters/min). The prewarmed anaerobic medium (100 liters) was inoculated with an exponential culture grown in serum bottles (starting concentration ∼1 × 10⁵ cells/ml).
The doubling times were 140 min in the serum bottles and 55 min in the fermenter.
Sampling, cell fixation, and enzymatic treatments: Aliquots from the cultures were fixed in ice-cold ethanol (70% final concentration), and the samples were stored at 4°. The samples were stable for more than 6 mo without apparent changes in the flow cytometry or microscopy results. As the method of cell fixation is known to influence bacterial nucleoid structure (Kellenberger 1990), an alternative fixation procedure was tested. The cells were fixed by mixing 2 ml of culture with 6 ml of a 3% formaldehyde solution in phosphate-buffered saline (PBS; pH 7.4). The mixture was kept at 4° for 2 hr, centrifuged at 10,000 rpm for 15 min, and washed twice in PBS. The pellets were resuspended in the same buffer, fixed in ethanol (70% final concentration), and kept at 4° until use.
The cells were centrifuged (18,000 rpm, 20 min), and enzymatic treatments were then performed at 37° for 1 hr in Tris buffer containing 10 mm MgCl2 and enzymes at the following concentrations: proteinase K, 50 μg/ml (2.15 units/ml); DNase I, 15 units/ml; RNase A, 100 μg/ml (8.25 units/ml). After the incubation, the cells were centrifuged, resuspended, and stained for flow cytometry (below). For the microscopy studies (below), the enzymes were added to the 4′,6-diamidino-2-phenylindole (DAPI) containing agar just before it was poured on the microscope slides. The cells were added and the slides were incubated in the dark for 2 hr at room temperature before microscopy analysis.
Flow cytometry: Sample preparation, DNA staining (MEB staining: mithramycin A + ethidium bromide), and flow cytometry were performed essentially as described by Bernander and Poplawski (1997). All solutions were filtered through 0.2-μm-pore-size filters to decrease light scatter background noise, vortexing was avoided to prevent cell lysis, and the samples were kept on ice in all steps. Cell concentration and sample quality were checked by microscopy before flow cytometry analysis.
The samples were analyzed in a Bryte HS flow cytometer (Bio-Rad, Richmond, CA). The instrument was modified by the installation of a mercury arc lamp to increase the sensitivity. Instrument calibration was performed with plastic beads (Bio-Rad) of uniform size (1.5 μm in diameter) and fluorescence. The resolution and sensitivity were checked by running Escherichia coli samples with known properties before the archaea samples. A light scatter threshold was used except when there was substantial overlap between the light scatter signals and background noise, in which case a fluorescence threshold was used. A resolution of 512 channels was used, and between 20,000 and 200,000 cells were analyzed in each sample. The data were plotted using FCSPress software (Ray Hicks).
Microscopy: For the microscopy studies, DNA staining was performed essentially as described by Poplawski and Bernander (1997). The cells were poured on microscope slides covered with an agar surface containing DAPI. The samples were analyzed in a Nikon Optiphot-2 microscope, using simultaneous phase and fluorescence illumination. Images were digitalized with a cooled charge-coupled device camera (Sony Instruments, Parkridge, NJ) connected to a computerized image analysis system (software and hardware from Bergströms Instruments). The digitalized images were printed with a Sony UP-860ICE video printer or processed using Adobe Photoshop 3.0 software.
When quantification was performed, a minimum of 1000 cells were analyzed in duplicate samples. Quantification of DNA fluorescence signals was first tested on exponentially growing E. coli cells treated with rifampicin. The fluorescence distribution obtained by microscopy corresponded well to that obtained by flow cytometry, although the peaks were somewhat broader (not shown).
RESULTS
Control experiments: Careful control experiments were needed for two main reasons. First, the cell wall of M. jannaschii consists solely of nonglycosylated S-layer proteins, which renders cells fragile, especially in low osmolal solution (Whitman et al. 1990). Thus, a microscopy control of the cell morphology after fixation was essential. Second, the cells contain the coenzyme F420, a fluorescent molecule that has a major absorption peak at 420 nm (Cheeseman et al. 1972). This is in the wavelength range (395 to 440 nm) used to excite the MEB stain in the flow cytometry, and this component could therefore potentially interfere with fluorescence measurements. Furthermore, the fixed cells were treated with nucleases to show that the fluorescence parameter indeed represented DNA.
A control sample demonstrated that M. jannaschii cells remained intact after fixation and staining (Figure 1, top row) and displayed similar shape and size characteristics as previously reported (Jones et al. 1983). They occurred as irregular cocci with a width of 1 to 1.5 μm, either singly or in pairs. In flow cytometry analysis, the fluorescence signals could be separated from background noise despite the small genome size. A minor overlap with the background was evident in the light scatter distribution.
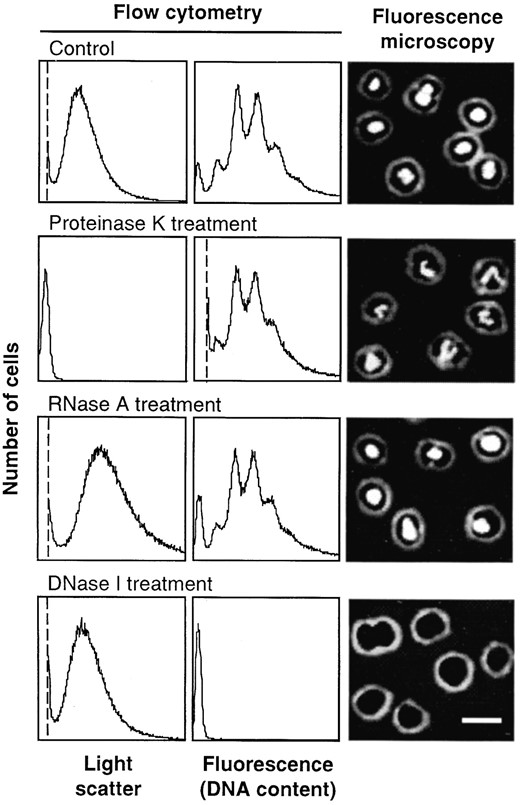
—Enzymatic treatments of fixed M. jannaschii cells. Cells from stationary phase were fixed in ethanol, washed, resuspended in buffer, and treated with the indicated enzymes. The enzymatic treatments were performed either in liquid or on microscope slides, and the cells were stained with MEB (flow cytometry) or DAPI (epifluorescence microscopy). In the flow cytometry distributions, the leftmost peak corresponds to background noise. The position of the noise peak depends upon which parameter was used to set the threshold, above which signals should be recorded. A light scatter threshold was used in all samples except the proteinase K treatment. Thresholds are indicated by vertical dotted lines. The remaining peaks represent the distribution of cells within a population according to their light scatter or fluorescence (in arbitrary units corresponding to instrument channel numbers). Bar, 2 μm.
After treatment with proteinase K (Figure 1, second row), the light scatter was reduced to background level while the fluorescence signals were largely unaffected. When the incubation with proteinase K was performed after the cells had been placed on the agar slides used for microscopy, the size and shape of the cells were retained. The same treatment performed in buffer resulted in cell swelling and partial cell lysis (data not shown). The intensity of the fluorescence foci was not significantly affected by the proteinase treatment, but the nucleoids became more irregularly distributed within the cells.
RNase treatment had little effect on the fluorescence signals in either flow cytometry or microscopy (Figure 1, third row), except that the light scatter signals increased somewhat in strength.
DNase I treatment abolished the fluorescence signals both in the flow cytometry and microscopy analyses without affecting the light scatter (Figure 1, bottom row).
We conclude that the fluorescence signals represented cellular DNA and that fluorescence from coenzyme F420 did not interfere significantly because no residual fluorescence was detected after the DNase treatment. The light scatter signals reflected cellular protein content and are considered to be roughly proportional to cell size in the experiments described below.
The same control experiments were performed on exponential samples with similar results (data not shown).
Comparison of cells from exponential and stationary phase: M. jannaschii cultures were grown in supplemented MGG medium in serum bottles, resulting in a generation time of ∼140 min. In exponential growth phase, broad distributions with no distinct peaks were obtained for both the light scatter (Figure 2A) and fluorescence parameters (Figure 2E), indicating that there was a considerable variability in cell size and DNA content within the population. In stationary phase, the light scatter signals were substantially reduced in strength and a narrower distribution was obtained (Figure 2B). The average DNA content decreased dramatically as compared to the exponentially growing cells, and distinct peaks became resolved in the DNA content distribution (Figure 2F). Five peaks could be distinguished, although extensive overlap with neighboring peaks occurred (the leftmost peak in Figure 2F is background).
Cells from the exponential and stationary phases were mixed and analyzed by microscopy. In phase-contrast illumination, a considerable reduction in cell size was apparent for the stationary phase cells (Figure 2C). However, in contrast to Sulfolobus cells (Poplawski and Bernander 1997), no major difference in intracellular density (transparency) was apparent between the exponential and stationary phase cells.
In epifluorescence illumination (Figure 2D), the strength of the fluorescence signals decreased in stationary phase and the structure of the nucleoids changed (for a more detailed description, see Figure 5). Importantly, the intensity of the fluorescence foci was found to vary significantly between different cells in the population.
Estimation of the number of genome equivalents in stationary phase M. jannaschii cells: The peaks in the DNA content distributions from the stationary phase cells could in theory correspond to either 1, 2, 3, 4, and 5 genome equivalents, or to 2, 3, 4, 5, and 6 (in which case the one-chromosome peak would be hidden in the background peak), or to 1, 2, 4, 8, 16, etc. Furthermore, the peaks could represent either cells containing different numbers of chromosomes, or aggregates of one to five cells containing 1 genome equivalent each. The following experiments were designed to differentiate between these possibilities.
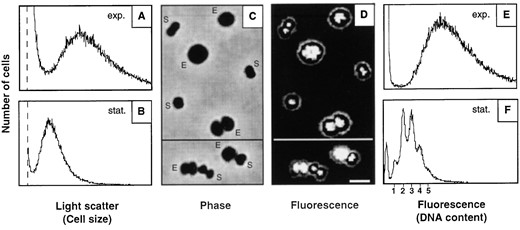
—Comparison between exponential and stationary phase cells. Samples were collected from the exponential (A and E) and stationary (B and F) growth phases. The samples were also mixed and visualized by phase-contrast (C) or combined phase-contrast and epifluorescence microscopy (D). E, cells from exponential phase; S, cells from stationary phase. The scale is identical in A and B, and in E and F. See legend to Figure 1 for explanation of leftmost peak in the flow cytometry panels. Thresholds are indicated by vertical dotted lines. Bar, 2 μm.
Genome size can be estimated by flow cytometry by comparing cells of known genome content (Bernander and Poplawski 1997). We compared the peaks obtained with the stationary phase M. jannaschii cells with peaks from exponentially grown Sulfolobus acidocaldarius cells. This organism was chosen because it is also a hyperthermophilic archaeon and has a GC content comparable to that of M. jannaschii, and the intracellular organization of the DNA, which affects the binding of intercalating DNA stains, may therefore be similar to that of M. jannaschii. The two peaks in the S. acidocaldarius DNA content distribution (Figure 3A) correspond to DNA contents of 2.7 and 5.4 Mb, respectively (Bernander and Poplawski 1997). By comparison, the first peak in the M. jannaschii DNA content distribution could correspond only to cells containing a single genome equivalent (1.66 Mb). Although the scales were slightly displaced between the two species, a good correlation was obtained when the peaks in the M. jannaschii DNA content distribution were assumed to represent one, two, three, four, and five chromosomes (Figure 3B).
To determine whether the peaks represented single cells with different numbers of chromosomes or aggregated cells, the samples were analyzed by combined phase-contrast and fluorescence microscopy (Figure 3C). Two samples (from different cultures) were analyzed: in both, >80% of the population occurred as single cells. Doublets were also detected: ∼5% of the population contained a single nucleoid and ∼10% contained two nucleoids (an aggregate of two individual cells or a single cell with two nucleoids). Few aggregates of three or more cells were present. This ruled out the possibility that cell aggregation could be responsible for the peaks observed in the flow cytometry analysis. Also, if most cells contained a single chromosome, the 80% single cells detected should have resulted in a dominating first peak in the fluorescence distributions, but this was not the case (Figures 2F and 3B).
We quantified the intensity of the fluorescence signal in individual cells by epifluorescence microscopy in combination with image analysis. Five peaks were obtained, similar to the flow cytometry results, and their relative heights were also similar to those in the flow cytometry distributions (compare Figure 3D with 3B).
We conclude that the majority of the individual cells in stationary phase M. jannaschii cultures contained between 1 and 5 genome equivalents. Furthermore, this indicates that the exponentially growing cells contained even larger amounts of DNA, from 3 up to perhaps 10 to 15 genome equivalents per cell (compare Figure 2E with 2F).
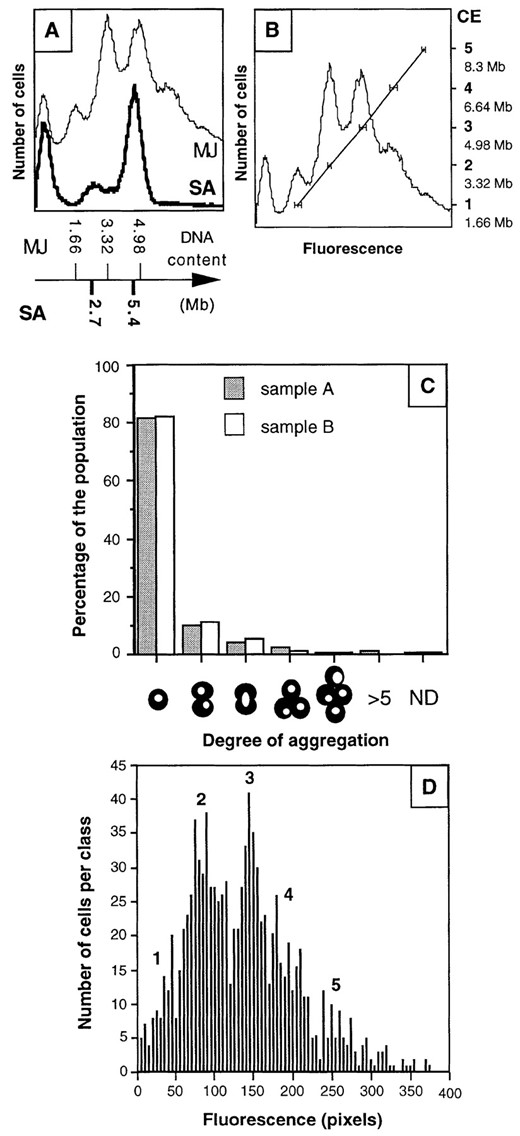
—Determination of the genome content of M. jannaschii cells in stationary phase. (A) Comparison of fluorescence distribution and DNA content between M. jannaschii (fine line) and S. acidocaldarius (thick line) by flow cytometry. The samples were run in immediate succession in the flow cytometer, and peak positions were then plotted against the known genome sizes. (B) Correlation between fluorescence (peak position) and DNA content (number of genome equivalents). The position of each peak was determined from seven different fluorescence distributions representing three stationary samples. The mean peak position for each peak was then plotted against the assumed DNA content of the cells (CE, chromosome equivalent). See legend to Figure 1 for explanation of leftmost peak in each part. (C) Use of epifluorescence microscopy to determine the degree of cell aggregation in two stationary phase samples. The nucleoids were visualized to differentiate aggregates of two cells (two nucleoids visible) from doublets with only one nucleoid. (D) Quantification of fluorescence signals from individual cells by epifluorescence microscopy. The fluorescence was measured by image analysis as the number of pixels within the area covered by the nucleoid in each cell. The values were sorted into classes from 1 to 361 pixels, which was the maximum value measured. The numbers in boldface indicate the estimated number of genome equivalents within the cells.
Changes in cell size and DNA content in batch cultures grown in serum bottles: When E. coli batch cultures in rich medium approach stationary phase, both cell size and DNA content start to decrease long before the cultures leave the exponential phase (Åkerlund et al. 1995). To investigate whether M. jannaschii cells behave similarly, cultures were grown in serum bottles in supplemented MGG medium. Multiple serum bottles were inoculated in parallel, and samples were taken from different bottles at different times (Figure 4A). The rate of increase in cell concentration slowed down at concentrations ∼1 × 10⁸ cells/ml (Figure 4A). This was partly due to cell lysis, as revealed by microscopy analysis. The pressure had at this point decreased from 2.8 to 1.6 bar. To prevent lysis, repressurization of the serum bottles was performed at a cell concentration of ∼1 × 10⁸ cells/ml. This treatment allowed the culture to reach stationary phase at a cell concentration of one order of magnitude higher (∼1 × 10⁹ cells/ml).
In all exponential samples, the same broad DNA distribution was obtained, with a DNA content that started to decrease when the cultures were still in exponential growth (Figure 4B, right column). The fluorescence signals decreased gradually in strength while defined peaks corresponding to fully replicated chromosomes started to appear (Figure 4B, panel 8). The cells continued to divide because cells with fewer and fewer genome equivalents gradually appeared and the number of cells with higher DNA contents continued to fall (Figure 4B, panels 10 and 12). However, even at the end, the majority of the cells contained two or more chromosomes.
This pattern did not change further after prolonged incubation (14 additional hr; not shown).
Changes in cell size and DNA content in a batch culture grown in a fermenter: A culture was grown in non-supplemented MGG medium in a fermenter with a constant flow of H2 and CO2 under pressure. Sudden changes in pressure and gas phase composition were thus avoided.
Similar reductions in cell size and DNA content took place in the fermenter-grown culture as was observed in the serum-bottle cultures (compare Figure 4B with 4D; note that the light scatter and fluorescence scales are directly comparable) despite the differences in medium composition (presence or absence of organic nutrients), growth temperature (85° vs. 80°), gas phase composition (constant or not), and pressure (constant or not). Remarkably, both the cell size and DNA content distributions were virtually identical to those of the serum-bottle grown cultures despite the fact that the doubling time was 2.5-fold shorter (55 min in the fermenter, 140 min in the serum bottles).
In the fermenter-grown culture, significant cell lysis did not occur, probably as a result of the constant composition and pressure of the gas phase. Therefore, the period of incubation and analysis could be extended. The cell concentration in stationary phase initially decreased, stabilized, and then increased again at ∼15 hr after entry into stationary phase (Figure 4C). In parallel, the proportion of cells containing a single genome equivalent increased (Figure 4D, panel 8).
Nucleoid structure and cell division: The nucleoid structure of ethanol-fixed cells from exponentially growing cultures was analyzed by light microscopy after staining with DAPI (Figure 5A). Individual cells with different nucleoid structures and different morphologies were selected from a collection of micrographs. The cells were classified into three categories. Classes I and II contained cells without visible constrictions, either rounded (I) or elongated (II), while class III contained cells exhibiting slight or marked constrictions. Category III represented ∼40-45% of the cell population.
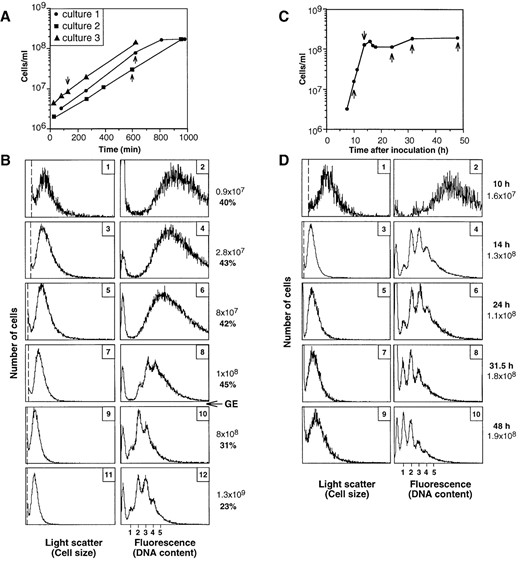
—M. jannaschii grown in supplemented MGG medium in serum bottles (A and B) or in nonsupplemented MGG medium in a fermenter (C and D). (A and C) Growth curves. Samples described in B and D are indicated by arrows. (B and D) Flow cytometry profiles. The cell concentrations (plain text; cells per milliliter), the percentage of cells exhibiting constriction (B), or the time points (D) are given to the right (boldface numbers). The last three samples in B (panels 7-12) were from a single bottle whose pressure was restored at the time point indicated by an arrow and the letters GE (gas exchange). See legend to Figure 1 for explanation of leftmost peak in each panel. Thresholds are indicated by vertical dotted lines.
In most cells, the nucleoid occupied a large part of the cell and was found to be organized into a thread-like network. This was particularly evident in elongated cells (class II). This network was still present in cells with constrictions, with the DNA occupying the constriction site even at late constriction (Figure 5A, class III). At the end of the constriction event, daughter cells that apparently contained unequal amounts of fluorescence could be detected (Figure 5A, class III). In a small proportion of the cell population (<5%), the nucleoid occurred as an unstructured, rounded focus. This nucleoid conformation was only detected in cells belonging to class I or III (Figure 5A).
Similar nucleoid structures were observed when the cells were grown in the fermenter (Figure 5B) and were independent of whether ethanol or formaldehyde (Figure 5C) fixation was used.
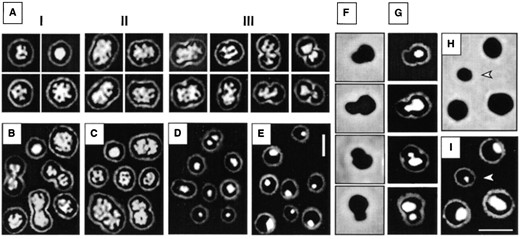
—Nucleoid structure and asymmetric division as revealed by DAPI staining of M. jannaschii cells. Exponential cells were grown in supplemented MGG in serum bottles (A) or in a fermenter (B and C) and fixed either with ethanol (A and B) or with formaldehyde (C). Cells with different morphologies are presented: rounded (I), elongated (II), and with different degrees of constriction (III). B and C are composite photographs of cells from different fields representing stages I-III. Cells were grown to stationary phase in MGG medium in a fermenter and fixed with ethanol. Cells from early (D) and late (E) stationary phase are shown. (F and G) Asymmetric division ocurring in stationary phase. (F) Phase-contrast illumination. (G) DAPI staining of the same cells as in F. (H) Phase-contrast and (I) DAPI staining of cells from a later sample (14 additional hours), including a small cell with a low DNA content (indicated by an arrow). Bar, 2 μm (in E for A-E and in I for F-I).
In cells in early stationary phase (between 14 and 24 hr after inoculation; Figure 4C), the nucleoids were less structured and occurred as rounded fluorescent foci centrally located in the cells (Figure 5D). Later in stationary phase, they appeared even more compact and were usually located at the side of the cell, apparently close to the membrane (Figure 5E).
Asymmetric divisions: In stationary phase, cells exhibiting asymmetric divisions were observed under both growth conditions tested (Figure 5, F and G). The asymmetry was twofold: the two daughter cells differed not only in size due to the formation of a noncentrally located constriction (Figure 5F) but also in DNA content, the smaller cell harboring the lower DNA content (Figure 5G). During these asymmetric divisions, constrictions were visible while no DNA was present in the smaller cell. Presumably, part of the DNA was moved from the larger to the smaller daughter cell prior to cell separation.
The proportion of such asymmetrically dividing cells decreased in late stationary phase, a reduction that occurred in parallel to the increase in cell numbers (Figure 4C) and in the proportion of cells with one genome equivalent (Figure 4D, panels 8 and 10). After the cell numbers increased, small cells with a low DNA content (a small fluorescent focus) were observed (Figure 5, H and I).
DISCUSSION
We used flow cytometry and fluorescence microscopy to analyze the DNA content, nucleoid structure, and cell division characteristics of M. jannaschii. The cells were found to contain multiple copies of the chromosome, with a DNA content that varied from 1 to 5 in stationary phase and from ∼3 to 15 genome equivalents per cell in exponential phase and was similar at significantly different growth rates. In stationary phase, asymmetric divisions occurred, a process by which the number of cells with one genome equivalent appeared to increase. The nucleoids were highly structured in exponential phase, exhibiting a thread-like network. This structure changed in stationary phase, in which the cells harbored compact nucleoids.
The DNA content in M. jannaschii cells was unexpectedly high in exponential phase as well as in stationary phase. The binding of ethidium bromide is affected by the level of DNA organization, which can differ at different growth phases. However, this could not account for the wide range of DNA content detected by flow cytometry and for the differences in DNA fluorescence between cells visualized by microscopy after staining with the nonintercalating DAPI dye.
Multiple chromosomes occur in bacteria belonging to different genera: Borrelia hermsii (8 to 16 genome equivalents per cell; Kitten and Barbour 1992), Deinococcus radiodurans (4 to 10 genome equivalents per cell; Hansen 1978), Desulfovibrio gigas (9 to 17 genome equivalents per cell; Postgate et al. 1984), and Azotobacter vinelandii (∼80 chromosomes per cell, estimated by different methods including flow cytometry; Sadoff et al. 1979; Nagpal et al. 1989; Maldonado et al. 1994). Therefore, this tendency is not restricted to a particular cell morphology nor to life in hyperthermal environments.
M. jannaschii enters into the resting stage with a majority of the cells harboring more than one genome equivalent. This is the case for all archaea analyzed to date: Sulfolobus (Bernander and Poplawski 1997), Pyrococcus abyssi (Marie et al. 1996), P. furiosus, and Archaeoglobus fulgidus (L. Malandrin, unpublished results). Comparisons with hyperthermophilic bacteria (Thermotoga, Aquifex) and with nonthermophilic archaea have to be performed to investigate whether this may represent an archaeal or a thermophilic feature.
The linear number of genome equivalents per cell in stationary phase, from one to five, suggests a different replication and/or division pattern than for E. coli. In stationary phase, E. coli cells end up with one or two (slow growth) or two, four, or eight genome equivalents per cell (fast growth;Åkerlund et al. 1995). This 2n pattern is a consequence of the fact that when multiple replication origins are present within a single E. coli cell, initiation of replication occurs simultanously at all origins (coordinated initiations). The phenotype observed for M. jannaschii is reminiscent of the asynchrony phenotype observed in dam, dnaA, and seqA mutants of E. coli (Helmstetter 1996; Skarstad et al. 1996). This phenotype is characterized by DNA histograms showing additional peaks at positions corresponding to three, five, six, or seven chromosomes. Several hypotheses could account for the phenotype observed in M. jannaschii.
First, replication initiation could occur simultaneously at all origins, but asymmetric nucleoid segregation may result in two daughter cells with an unequal number of chromosomes. Second, initiation of replication might be noncoordinated and so might start nonsimultaneously on the different chromosomes. In this case, nucleoid segregation would also be asymmetric but only as a consequence of the asynchronous initiation. Because the DNA content in exponential phase was higher than in stationary phase, the resulting pattern is probably further complicated by overlapping rounds of replication. This mechanism is used by certain bacteria to avoid the production of anucleate cells when the doubling time is shorter than the time required for the replication of the entire chromosome (Cooper and Helmstetter 1968; Helmstetter 1996). The replication rate is not known for M. jannaschii but may be slower than in bacteria due to the presence of histones that compact the DNA (Bult et al. 1996).
The asynchrony phenotype has been observed in wild-type strains of two other hyperthermophilic archaea: P. abyssi (Marie et al. 1996) and P. furiosus (L. Malandrin, unpublished results). These species share another feature with M. jannaschii: they are among the fastest-growing hyperthermophilic species (doubling time <30 min in P. furiosus). Thus, the asynchrony phenotype in archaea may be associated with the capacity to grow fast.
Fluorescence microscopy was used to confirm the flow results and to analyze nucleoid structure and partition. The main characteristic of the nucleoids in exponential phase was the high level of organization resulting in a thread-like network. Nucleoid structure is the result of compaction and expansion forces (Woldringh et al. 1995). Macromolecular crowding (Zimmerman 1993), positive DNA supercoiling (Forterre et al. 1996), and the presence of histones (Bult et al. 1996) are forces that may contribute to compaction of M. jannaschii DNA. Archaeal histones compact DNA in vivo into nucleosome structures (Pereira et al. 1997). Another putative compaction force could be generated by the Smc proteins (structural maintenance of chromosomes) because an Smc protein homologue has been found in the M. jannaschii genome (Bult et al. 1996; Elie et al. 1997). An expansion force could be the process of coupled transcription, translation, and translocation, which can transiently anchor DNA loops to the cytoplasmic membrane. In M. jannaschii, the complex nucleoid structure resulting from these compaction and expansion forces is probably enhanced by the high number of chromosomes per cell (up to 15), while the coccus morphology of the cells may render the cell membrane less accessible to a centrally located nucleoid.
In terms of nucleoid structure and distribution, M. jannaschii differed from Sulfolobus (hyperthermophilic crenarchaea) not only in the complexity of the nucleoid organization but also in the chromosome partitioning pattern (Poplawski and Bernander 1997). In Sulfolobus, the nucleoids are well separated and located at opposite sides of the cell before and during the division process. In M. jannaschii, the DNA often remained close to the constriction site.
The nucleoids had a very compact structure in stationary phase, and a change in nucleoid location occurred in late stationary phase. The more compact state of the nucleoid may be due to a decreased transcriptional and translational activity in stationary phase. In Methanothermus fervidus, the relative proportion of the nucleosomal histones varies with the growth phase such that the more DNA-compacting histone reaches its highest concentration in stationary phase (Sandman et al. 1994). Whether a similar mechanism could account for the variation in nucleoid compaction in M. jannaschii remains to be investigated.
Asymmetric divisions were visible in stationary phase, producing cells of different sizes and DNA contents. The extent of these divisions in exponential phase was more difficult to assess due to the smaller difference in the number of genome equivalents in the two daughter cells (for example, four and five in exponential phase as compared to one and two or one and three in stationary phase) and to the thread-like nucleoid network.
In conclusion, DNA replication, nucleoid structure, and partition exhibit different features in the two archaeal genera studied to date. Whether the results obtained for M. jannaschii will be representative for the euryarchaeota remains to be determined by analyzing the cell cycle of an increased range of archaea.
Acknowledgement
We are indebted to Karl Stetter for providing access to growth facilities and for valuable discussions and critical reading of the manuscript. We thank Andrzej Poplawski for patient initiation and helpful assistance with the microscopy techniques and Kerstin Roth for excellent technical assistance in growing cells. This work was supported by grants from the Swedish Foundation for Strategic Research, the Swedish Natural Science Research Council, the European Molecular Biology Organization, and the Fonds der Chemischen Industrie.
Footnotes
Communicating editor: C. J. Daniels
LITERATURE CITED
