


Abstract
Determining the genetic basis of environmental adaptation is a central problem of evolutionary biology. This issue has been fruitfully addressed by examining genetic differentiation between populations that are recently separated and/or experience high rates of gene flow. A good example of this approach is the decades-long investigation of selection acting along latitudinal clines in Drosophila melanogaster. Here we use next-generation genome sequencing to reexamine the well-studied Australian D. melanogaster cline. We find evidence for extensive differentiation between temperate and tropical populations, with regulatory regions and unannotated regions showing particularly high levels of differentiation. Although the physical genomic scale of geographic differentiation is small—on the order of gene sized—we observed several larger highly differentiated regions. The region spanned by the cosmopolitan inversion polymorphism In(3R)P shows higher levels of differentiation, consistent with the major difference in allele frequencies of Standard and In(3R)P karyotypes in temperate vs. tropical Australian populations. Our analysis reveals evidence for spatially varying selection on a number of key biological processes, suggesting fundamental biological differences between flies from these two geographic regions.
DETERMINING the processes maintaining genetic variation within species is a basic goal of biological research and a central problem of evolutionary genetics. Indeed, the relative contributions to segregating variation of (1) low-frequency, unconditionally deleterious mutations, (2) intermediate-frequency, small-effect variants maintained by mutation and genetic drift, and (3) adaptive mutations maintained by positive selection—e.g., spatially varying or negative frequency-dependent selection—remain unknown in any species. Thus, it is also unclear whether different processes predominate in different species, perhaps resulting from differences in population size, ecology, or genetics.
One approach for identifying adaptive variants segregating within species is to investigate systems in which there are major phenotypic variants likely influenced by natural selection and that have relatively simple genetics. This is what has traditionally been thought of as ecological genetics. For example, pigmentation variation in vertebrates (e.g., Nachman et al. 2003) is a good example of a trait for which the relatively small number of candidate genes allows the phenotypic effects of natural variants to be directly tested. For major phenotypic variants having a simple genetic basis but no candidate genes, genetic analysis can be used to isolate alternative alleles underlying the phenotypic difference. Examples include diapause variation and foraging behavior in Drosophila melanogaster (Osborne et al. 1997; Schmidt et al. 2008), traits relating to social behavior and copulatory plug formation in Caenorhabditis elegans (de Bono and Bargmann 1998; Palopoli et al. 2008), and several phenotypes in sticklebacks (Colosimo et al. 2004; Miller et al. 2007; Chan et al. 2010). Besides their simple genetics, such biological examples have the advantage that the targeted traits may have plausible connections to fitness variation in nature (though this is not always the case). In spite of the practical advantages associated with phenotypic variation resulting from simple genetics and alleles of large effect, such variation may not speak very strongly to the general properties of adaptive polymorphisms in natural populations, which may often be characterized by complex genetics or small-effect alleles.
A complementary approach uses population-genetic analysis to identify individual polymorphic variants/genes that may have been influenced by positive selection. This approach offers at least two advantages. First, it can be made genomic in scope and therefore may provide a less-biased view of the genes and phenotypes influenced by positive selection. There is no comparably comprehensive “omic” concept for phenotypic analysis, because the universe of phenotype space is difficult to define, difficult to measure, and highly dimensional (Lewontin 1974). Second, alleles having relatively small effects or effects not associated with easily defined phenotypes can be identified. A population-genetic approach is a particularly powerful discovery tool when joined with high-quality genome annotation, generating many new hypotheses about the genetic and phenotypic variation influenced by positive selection within species and providing vast opportunities for the downstream functional investigation of such variation.
One population-genetic approach for identifying positively selected polymorphisms is to search the genome for sites exhibiting large allele-frequency differences between recently separated populations or those experiencing high rates of gene flow (Lewontin and Krakauer 1975). Because even low levels of gene flow effectively homogenize neutral allele frequencies (Wright 1931; Maruyama 1970; Slatkin 1981), alleles under spatially varying selection are expected to appear as outliers with respect to allele-frequency differences across populations. This strategy may be particularly effective when allele frequencies change gradually along a cline, such as with latitude or altitude.
Some of the best-studied cases of latitudinal clines maintained by spatially varying selection are those of D. melanogaster. The majority of work on these clines has investigated various phenotypic traits, chromosome inversion polymorphisms, and enzyme-coding genes (Sezgin et al. 2004), as well as several other genes harboring clinal variants (Costa et al. 1992; McColl and McKechnie 1999; Schmidt et al. 2000; Duvernell et al. 2003). The cline along the east coast of Australia has received considerable recent attention due to the efforts of Ary Hoffmann and collaborators (e.g., Hoffmann and Weeks 2007). The fact that similar clines are often observed on different continents strongly implicates natural selection rather than demography as the cause of clinal variation (Oakeshott et al. 1981, 1983; Singh and Rhomberg 1987; Singh 1989; Singh and Long 1992; Gockel et al. 2001; Kennington et al. 2003; Hoffmann and Weeks 2007). Importantly, although cosmopolitan chromosome inversion polymorphisms exhibit latitudinal clines (with inversion frequency increasing in more tropical populations), many observations convincingly show that inversions explain only a fraction of clinal variation, even for genes located in inverted regions (Voelker et al. 1978; Knibb 1982; Singh and Rhomberg 1987; Frydenberg et al. 2003; Umina et al. 2006). Indeed, many clinally varying genes are not physically near inversions (Voelker et al. 1978; Singh and Rhomberg 1987; Sezgin et al. 2004; Turner et al. 2008).
We recently extended the genetic characterization of population differentiation from D. melanogaster clines by comparative genomic hybridization analysis of population samples from opposite ends of well-described clines in Australia and North America (Turner et al. 2008). That study generated new information on genomic differentiation, but the crude nature of the data limited the scope of the analysis and the strength of the conclusions that could be drawn. Here we revisit the issue of geographic differentiation between opposite ends of a known D. melanogaster cline, using next-generation sequencing to characterize genomic variation in flies from Queensland and Tasmania, Australia. These data are used to generate hypotheses regarding the biological differences between flies from these regions and to assess the population-genetic properties of sequence differentiation between these geographic regions.
MATERIALS AND METHODS
Sequencing, assembly, and data filtering:
Population samples from the east coast of Australia were collected in 2004 (Anderson et al. 2005). Twenty isofemale lines from Queensland (Cairns, lat. 16.907, and Cooktown, lat. 15.476) and 19 isofemale lines from Tasmania (Hillwood, lat. 41.237, and Sorell, lat. 42.769) were used. Two females were collected from each Queensland line (n = 40 flies). These flies were pooled in a single tube and made into DNA. Similarly, two females were collected from each Tasmania line (n = 38 flies), pooled in a single tube, and made into DNA. Each of the two DNA samples was then sequenced using Solexa/Illumina technology (Bentley et al. 2008). Base calls and quality scores were determined using the Solexa GAPipeline v0.3.0. Output files were in fastq format. Reads were mapped against the D. melanogaster reference genome R5.8 (Adams et al. 2000), using Maq v0.6.8 (Li et al. 2008). Prior to mapping, we split fastq files into separate files with 1 million reads per file. The reads are available in the NCBI Sequence Read Archive under accession no. SRA012285.16.
Several Maq functions were used for data formatting. Solexa quality scores were converted to Sanger quality scores using Maq function sol2sanger and converted from fastq files to binary fastq (bfq) using the Maq function fastq2bfq. Bases 1–36 of each read were used; the expected heterozygosity parameter (“−m” flag) was 0.005. Mapped reads were merged using mapmerge. The functions maq assemble and maq pileup were then used to produce pileup files. Finally, pileup files were split by chromosome arm for downstream analysis. Individual base calls with Maq quality scores <10 were excluded, as were positions with only a singleton variant in the entire Australian sample. We explored the value of increasing the Maq quality threshold to 20, but the reduction in coverage was too costly, given the amount of data. Because we excluded singletons and focused on genomic outliers, errors should not be an important factor with respect to our biological conclusions. We excluded genomic positions with <6 or >20 sequence reads in either population, because these sites are associated either with very low power to reject the null hypothesis or with the confounding phenomenon of differentiated copy-number variation.
Because a primary goal of our study was to generate biological, gene-centric hypotheses regarding the nature of selection, most analyses excluded regions of the genome adjacent to centromeres and telomeres associated with low heterozygosity, as determined from genome sequences of a Raleigh sample of inbred lines sequenced as part of the Drosophila Population Genomics Project (DPGP.org). These regions of reduced heterozygosity are expected to be associated with lower power to detect differentiation, and because they experience reduced rates of crossing over, the physical scale of differentiation may be quite large, limiting opportunities for identifying potential targets of selection. The coordinates corresponding to regions of normal recombination used in our analyses are 2L, 844,225–19,946,732; 2R, 6,063,980–20,322,335; 3L, 447,386–18,392,988; 3R, 7,940,899–27,237,549; and X, 1,036,552–20,902,578. The regions excluded are roughly consistent with the non- or low-recombining portions of the genome identified in prior studies (e.g., Singh et al. 2005).
Ancestral sequence reconstruction:
For the purposes of unfolding the site frequency spectrum in our samples, ancestral states were inferred using maximum likelihood (ML) (Yang et al. 1995) [provided by PAML v4.3 (Yang 2007)], assuming the reference phylogeny (Drosophila 12 Genomes Consortium 2007), the HKY nucleotide substitution model (Hasegawa et al. 1985), and gamma-distributed among-site rate variation (Yang 1996). ML reconstruction posterior probabilities were calculated using the empirical Bayesian approach described in Yang et al. (1995); the posterior probability of ancestral base bi, given data xj at alignment position j, is given by
Population genetic estimation of pooled sample reads:
Although the pooling strategy provides an economical picture of sequence polymorphism, it is associated with atypical sampling properties. Here we provide results for bias-corrected estimators of heterozygosity and other canonical population genetic summary statistics.
Estimators of θ:
As above in our treatment of heterozygosity, we need to correct estimators of the neutral mutation parameter θ = 4Nu for a pooled sampling strategy. Some recent work on this problem was done by Futschik and schlotterer (2010), who consider the case of pooled samples when the pool is large in comparison to sequence coverage. Here and in File S1, we derive results for corrected estimators that are accurate in the case where coverage is of similar size to the pooled sample. Importantly, we can derive the expected site frequency spectrum of a pooled sequencing experiment.
Outlier approach:
The relative merit of a model-based inference from theory or simulations vs. an empirical genomic-based outlier approach for detecting targets of positive selection is an ongoing discussion in the literature (Beaumont and Nichols 1996; Akey et al. 2002; Beaumont and Balding 2004; Teshima et al. 2006; Voight et al. 2006; Pickrell et al. 2009). For the following reasons, we chose to use an empirically based outlier approach for identifying candidate targets of selection: (1) the challenges associated with generating a realistic null model for our D. melanogaster cline are substantial, (2) we have relatively few data from which to estimate model parameters, (3) there is little doubt that many of the highly differentiated genomic regions from the east Australian cline result from selection, and (4) the empirical approach represents a simple, transparent treatment of the data. The many consistent biological signals we report here support the value of this approach, although they do not speak to its optimality.
Because the true length distribution of differentiated regions is unknown, two main approaches were used to identify such regions. Mean FST values were calculated for 1-kb nonoverlapping windows across the normally recombining regions of the genome. The top 1% or top 2.5% of these windows were considered “differentiated” for most analyses. For some analyses, the 5% tail was used (see Figure S1a and results section below). To identify differentiation on a scale >1 kb, we aggregated 1-kb windows in our top 1% tail. We considered any region of at least five consecutive windows that were not in the top 10% of mean 1-kb FST as “undifferentiated” between Queensland and Tasmania. Any region between two undifferentiated regions that had at least one 1-kb window in the top 1% FST was considered an independent differentiated region. We additionally investigated very small-scale differentiation by considering the top 0.1% of individual-position FST values not occurring in the top 10% 1-kb windows as potential outlier variants. Unless otherwise noted, all analyses were restricted to outliers occurring in normally recombining regions.
Genome annotations were taken from FlyBase R5.24 (Tweedie et al. 2009). Genome positions were annotated as coding sequence (CDS), 3′- and 5′-UTR, intron, regulatory, and “other.” Because regulatory regions are underrepresented in the FlyBase annotation, additional regulatory annotations were retrieved from the OregAnno database (Griffith et al. 2008) and a recent genome-wide scan for transcription-factor binding sites (MacArthur et al. 2009). Polymorphisms within coding sequence were additionally annotated as either nonsynonymous or synonymous.
Gene Ontology (GO) annotations (Ashburner et al. 2000) were obtained from FlyBase R5.24 (Tweedie et al. 2009). For each GO annotation, the number of genes within all 1-kb normally recombining windows with that annotation were identified. GO-category enrichment was determined using a hypergeometric test that compared the proportion of genes with a given GO annotation to the proportion of genes in the 2.5% most-differentiated 1-kb windows with that GO annotation. All GO categories with fewer than four genes were excluded, as four genes are the minimum number for which a significant hypergeometric result is possible at α = 0.05. After controlling the false discovery rate using the method of Storey (2002), enriched GO categories with false discovery rate (FDR)-corrected P-values <0.05 were determined. Similar GO-category enrichment analyses were performed using individual outlier genomic positions. Of course, differentiation at specific genes could have profound phenotypic consequences without leaving a statistically significant signature of GO enrichment.
Copy-number variation was evaluated by calculating the mean coverage for nonoverlapping 1-kb windows across Queensland and Tasmania genomes. For each window, we calculated the ratio of Queensland/Tasmania coverage and normalized these ratios by the mean coverage ratio across each chromosome arm. The top 1, 2.5, and 5% most-extreme windows were considered highly differentiated in copy number (see Figure S1b). Gene Ontology enrichment analyses were conducted as described above.
Structure prediction:
RNA secondary structures were inferred using the Vienna RNA package v1.8.2 (Hofacker 2003) with default parameters. Protein domain architecture was inferred using a sequence search of the PFam database (Coggill et al. 2008; Finn et al. 2010). Homology-based 3D structural modeling was performed using MODELER 9v7 (Eswar et al. 2008). Structures were inferred for predicted proteins from a consensus sequence for Queensland and Tasmania genes Irc and NtR. Searching the Protein Data Bank (Berman et al. 2000) using melanogaster protein sequences returned structures 3ERH (Sheikh et al. 2009) and 2QC1 (Dellisanti et al. 2007) as the best matches to the predicted proteins of Irc and NtR, respectively. Queensland and Tasmania consensus protein sequences were aligned to each structural template using MAFFT v6.611 with the E-INS-i option (Katoh et al. 2002; Katoh and Toh 2008). Five structural models of each sequence were constructed and evaluated using the MODELER objective function as well as DOPE and GA341 assessment scores (Eramian et al. 2008). Results are shown for the best overall models. Sequence not alignable to the structural template was excluded.
RESULTS
After filtering, the average genome coverage was 11.6× in Queensland and 8.2× in Tasmania. Coverage varied little across chromosome arms (Figure 1). The Queensland/Tasmania coverage ratio was highly consistent, varying from 1.20 to 1.45 across all regions examined. In addition, coverage in normally recombining regions was nearly equivalent across chromosome arms: the X chromosome had the greatest coverage (11.3 and 8.0 in Queensland and Tasmania, respectively), while chromosome 2L had the lowest (10.4 and 7.3). After filtering, the mean coverage and mean number of SNPs per 1-kb window were 604.7 bp and 9.4, respectively.
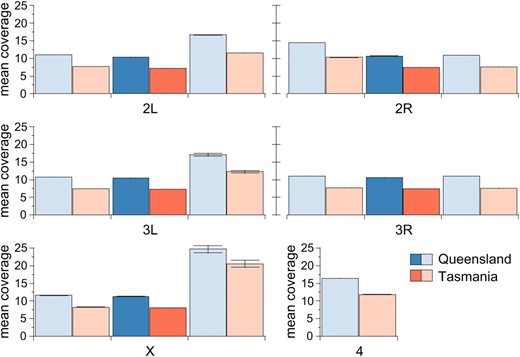
Genome-sequence coverage is equivalent across chromosome arms in normally recombining regions and more variable in low-recombining regions. Mean sequencing coverage is plotted for Queensland (blue) and Tasmania (red) populations. Dark colors indicate regions of normal recombination; lighter colors indicate low-recombining centromeric and telomeric regions. Bars give standard error.
Genomic patterns:
Mean FST across the entire genome was 0.112 ± 8.23 × 10⁻⁵. The distribution of 1-kb window FST estimates has a long right tail (see Figure S1a); the 5, 2.5, and 1% thresholds for this tail are FST = 0.23, FST = 0.27, and FST = 0.32, respectively. Among-arm variation in FST was significantly heterogeneous (Kruskal–Wallis rank sum test: P < 2.2 × 10⁻¹⁶; see also Table S1); the rank order of mean FST across chromosome arms was 3R (0.124) > 2L (0.116) > 3L (0.111) > 2R (0.107) > X (0.097). Previous studies demonstrated that In(3R)P vs. Standard represents a nearly fixed difference between Queensland and Tasmania (corresponding to FST close to 1.0), which is considerably greater differentiation than that observed for other cosmopolitan inversions in these populations (Knibb et al. 1981). This suggests that the In(3R)P cline is a main cause of the elevated FST for 3R. Two aspects of the data support this proposition. First, the region spanned by In(3R)P was significantly more differentiated than the rest of 3R (0.129 vs. 0.113, Wilcoxon's rank sum test: P < 2.2 × 10⁻¹⁶; see Figure 2c and Figure S2). Second, the physical scale of differentiation was significantly greater on chromosome arm 3R, which exhibited slightly fewer very small differentiated regions (<2 kb) and significantly more large regions of high FST (>10 kb) compared to the other arms (Fisher's exact test, P = 0.000378, Figure 2b). Note that FST of nucleotide variation in the region spanned by In(3R)P was dramatically lower than estimates of FST of the inversion itself, based on previous studies of these populations (Knibb et al. 1981; Knibb 1982; Umina et al. 2005), suggesting extensive recombination in the history of this arrangement.
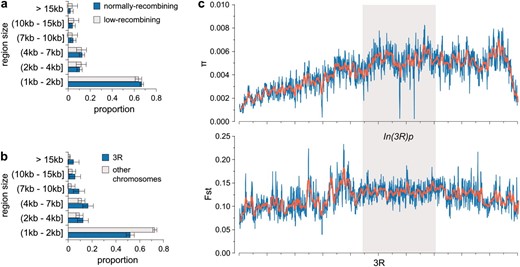
Size of differentiated regions is similar in areas of normal and low recombination and larger on chromosome 3R. We calculated mean FST in nonoverlapping 1-kb windows across the D. melanogaster genome. Groups of windows in the top 1% tail of the FST distribution were grouped together into larger differentiated regions separated from one another by at least five consecutive windows with mean FST in the bottom 90% tail (see materials and methods). (a) We plot the size distribution of these differentiated regions for normally recombining (blue) and low-recombining (gray) areas of the genome. Bars indicate standard error. (b) We plot the size distribution of differentiated regions found in normally recombining regions of chromosome 3R (blue) and the size distribution of differentiated regions in normally recombining regions of other chromosome arms (gray). (c) We plot mean FST (bottom) and mean polymorphism (π, top) across chromosome 3R. Blue lines indicate average values over 25-kb windows slid every 10 kb; red lines show 200-kb windows slid 50 kb at a time. The gray box indicates the location of the cosmopolitan 3R-Payne inversion.
In(2L)t also shows clinal variation, though not as steep as that of In(3R)P (Knibb et al. 1981). There was also a significant difference in FST for the region spanned by In(2L)t (0.116) vs. the rest of the arm (0.109) (Wilcoxon's rank sum test: P < 2.2 × 10⁻¹⁶); however, it appears that most of the difference is explained by the region of low differentiation in the uninverted region adjacent to the centromere (see Figure S2). The other two autosomal arms similarly showed only very slightly higher FST (3L) or no difference in FST (2R) for regions spanned by cosmopolitan inversions (there is no such inversion on the X chromosome). Much of the difference between standard and inverted regions for arms other than 3R is explained by reduced heterozygosity and differentiation in centromere-proximal regions that are not included in the inversions (see Figure S2).
Despite the filtering of regions corresponding to reduced heterozygosity as defined by DPGP, we observed that regions near centromeres (and some telomeres) showed low levels of differentiation, which corresponds to regions of reduced heterozygosity (see Figure S2). This suggests that some centromere- and telomere-proximal euchromatic sequence experiencing reduced crossing over may remain in our filtered data. However, the physical scale of differentiated regions was similar in normally vs. low-recombining regions of the genome (Figure 2a).
We detected significant heterogeneity in levels of nucleotide diversity
The largest differentiated euchromatic region spanned 854 kb at the tip of the X chromosome (Figure 3a), a region of low heterozygosity documented in several studies (Aguade et al. 1989; Begun and Aquadro 1995; Langley et al. 2000). Interestingly, previous studies suggested that the scale of linkage disequilibrium in this region of the genome is not dramatically reduced, in spite of reduced levels of crossing over (Begun and Aquadro 1995; Langley et al. 2000). This suggests that differentiation at the tip of the X region corresponds to a mosaic linkage-disequilibrium structure of relatively low small-scale linkage disequilibrium interspersed with scattered large-scale linkage disequilibrium. The largest differentiated segment in the middle of a chromosome arm was a 752-kb region of chromosome 2R (Figure 3b). Interestingly, Cyp6g1, an insecticide resistance gene (Daborn et al. 2002; Schmidt et al. 2010) known to be under recent strong selection, is located in this region and is an excellent candidate for the observed differentiation. Other areas of extended differentiation were observed in the euchromatic portion of the X chromosome (a 245-kb region from 18,055 to 18,300 kb) and toward the proximal end of chromosome 2L (a 131-kb region from 20,172 to 20,303 kb).
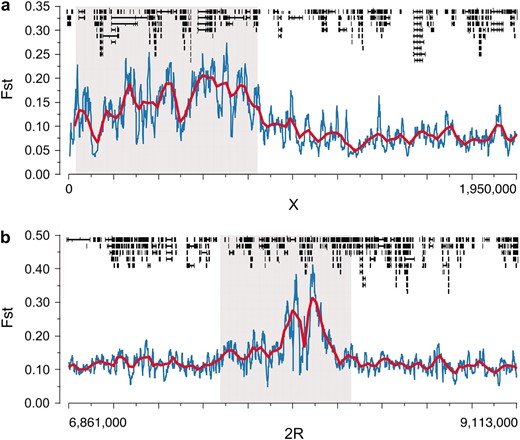
Largest highly differentiated regions occurred at the tip of the X chromosome (a) and in the middle of chromosome 2R (b). Highly differentiated regions are indicated in gray. We plot mean FST across each chromosomal region, blue lines indicating 10-kb windows with 1-kb slides and red lines indicating 50-kb windows with 20-kb slides. Annotated genes are drawn across the top of each panel.
The majority of differentiation between the Queensland and Tasmania populations occurs on a small physical scale (see Figure 2, a and b, and Table S1). In fact, FST-outlier regions (see materials and methods) were defined by single 1-kb windows in most cases, and most such windows localize to single genes. This small-scale differentiation facilitates effective identification of candidate genes influenced by spatially varying selection. Figure 4 shows one example in which a 1-kb windows in the top 2.5% FST tail localizes to Sfmbt, a chromatin-binding protein involved in gene regulation (Grimm et al. 2009). Differentiation in this gene is primarily attributable to two fixed substitutions in the middle of the gene. Interestingly, Sfmbt has been shown through yeast two-hybrid studies to physically interact with seven other genes (Yu et al. 2008), two of which—CG33275 and CG17018—are also highly differentiated between Queensland and Tasmania (1-kb FST = 0.26 and 0.45, respectively). Two additional genes predicted to interact with Sfmbt on the basis of known interactions between human homologs—Hdac3 and Stam—are also highly differentiated (1-kb FST = 0.28 and 0.33, respectively).
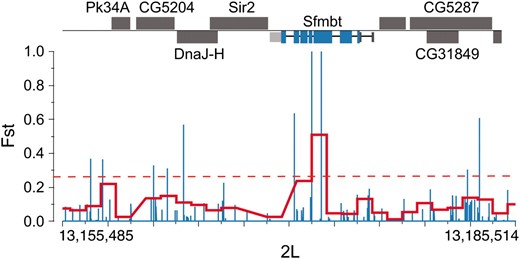
Regions of high population differentiation localize within the Sfmbt gene on chromosome 2L. We plot individual-position FST (blue) and mean FST within 1-kb windows (red) across the chromosome. The red dotted line indicates FST cutoff for the top 2.5% of 1-kb windows. Individual genes are drawn across the top (black); exons are in blue, 3′-UTRs in light gray, and 5′-UTRs in dark gray.
A genome browser displaying 1-kb windows and their associated FST estimates is available at http://altair.dartmouth.edu/ucsc/index.html. Significantly differentiated regions showed substantial overlap with outlier regions previously identified in similar Australian samples, using comparative genomic hybridization (Turner et al. 2008). For example, the proportions of Turner et al.'s outlier regions at FDR = 0.001 that overlap at least one 1-kb window in our 2.5 or 5% FST tail were 34 and 58%, respectively.
Differentiation across genome annotations:
Among CDS, intron, 5′-UTR, 3′-UTR, regulatory, and unannotated parts of the genome, mean FST was highest for 3′-UTR (Fisher's exact test, P = 0.0007346), in spite of the lower power associated with the small size of the UTR sequence. Moreover, 3′-UTRs were consistently overrepresented in the tail of highly differentiated 1-kb windows (Figure 5). In contrast, coding sequence and introns were consistently underrepresented in the most-differentiated genomic regions. Regions not annotated as either genic or regulatory were also highly enriched in the most-differentiated regions, although less so than 3′-UTRs. Interestingly, regulatory regions and 5′-UTRs were moderately overrepresented in highly differentiated autosomal regions but underrepresented on the X chromosome.
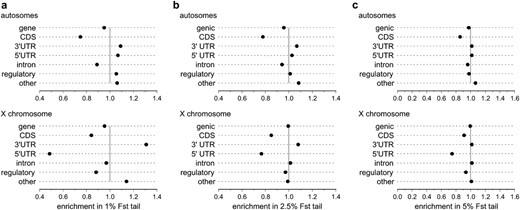
3′-UTRs and unannotated regions are overrepresented in the most-differentiated genomic regions. We calculated the enrichment for each annotation type in the 1% (a), 2.5% (b), and 5% (c) tail of 1-kb FST regions, relative to each type's distribution across all 1-kb windows in the normally recombining portion of the genome. Results are shown separately for autosomes and the X chromosome. An enrichment score of 1.0 (indicated by a solid vertical line) indicates no enrichment or depletion; values >1 indicate an overabundance of that type in the FST tail, whereas values <1 indicate underabundance.
To investigate general biological patterns associated with the observed 3′-UTR differentiation, FST was calculated for each 3′-UTR, which was followed by a Gene Ontology enrichment analysis for the genes associated with the top 1% most-differentiated 3′-UTRs. This analysis revealed no significant enrichments, which was not unexpected given the limited functional annotations associated with most of the genes. However, a number of highly differentiated 3′-UTRs were associated with either transcriptional regulators or genes involved in protein phosphorylation, supporting an important role for regulatory evolution in Queensland vs. Tasmania differentiation. Other genes with highly differentiated 3′-UTRs code for proteins involved in energy metabolism, development, or seminal fluid (see Table S2).
An example of a gene exhibiting highly localized 3′-UTR differentiation is Hex-t2, a testis-specific hexokinase (Duvernell and Eanes 2000). Figure 6 shows that there is a small region of elevated differentiation toward the 3′ end of Hex-t2, with peak differentiation occurring in the 3′-UTR. Within this differentiated region are two polymorphic sites in the Queensland population (a U/A polymorphism at position 75 in the UTR and an A/G polymorphism at position 55) that are fixed for the minor allele in Tasmania. Computational prediction of the RNA secondary structure of this 3′-UTR suggests that the Tasmania fixations induce a marked change in RNA secondary structure, consistent with potential functional importance.
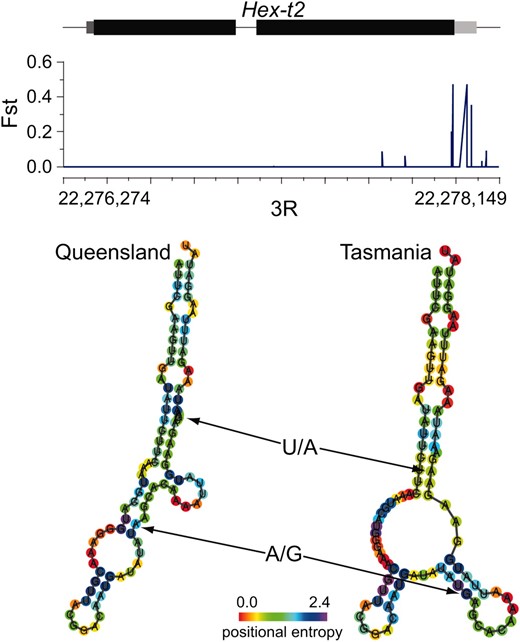
Elevated differentiation between Queensland and Tasmania populations localizes to the 3′-UTR of the Hex-t2 gene. We plot the FST of individual genomic positions against the structure of the Hex-t2 gene. Exons are drawn in black, the 5′-UTR is dark gray, and the 3′-UTR is light gray. The bottom panel shows predicted secondary structures of Queensland and Tasmania 3′-UTR regions. Queensland positions indicated by arrows are polymorphic, with the major allele at left; corresponding positions in Tasmania are fixed for what is the minor allele in Queensland.
Protein-coding differentiation:
Despite the fact that many outlier FST windows fall within exons, coding sequence was not overrepresented in the 1-kb window FST tail. However, because the windowing analysis does not account for the possibility of different physical scales of selection in DNA sequence space and protein space, alternative methods of characterizing protein differentiation were explored. First, mean FST for nonsynonymous variants in each gene in the normally recombining portion of the genome was calculated, with the top 1% of individual-gene nonsynonymous FST considered as coding for highly differentiated proteins. This analysis favors smaller genes/proteins, for which differentiation is likely to be gene/protein-wide. Alternatively, large multidomain proteins might show significant differentiation only in specific functional domains. To investigate this possibility, the PFam database (Finn et al. 2010) was used to annotate known functional domains for all D. melanogaster genes. Mean nonsynonymous FST was calculated separately for each domain in a gene, with the maximum domain FST being recorded for each gene.
Table S3 and Table S4 list the top candidate genes from these analyses, which suggest a number of interesting protein-coding genes for further study. For example, Figure 7a shows elevated differentiation around a fixed amino acid difference at position 47 in the disulfide oxidoreductase gene Txl. A threonine residue in Tasmania that is conserved throughout Drosophila has changed to alanine in Queensland, leading to elevated FST throughout the first exon. The alanine allele has also been observed in African melanogaster populations (DPGP.org). This may represent a more unusual case of recent selection in tropical populations (Queensland and Africa) rather than temperate adaptation.
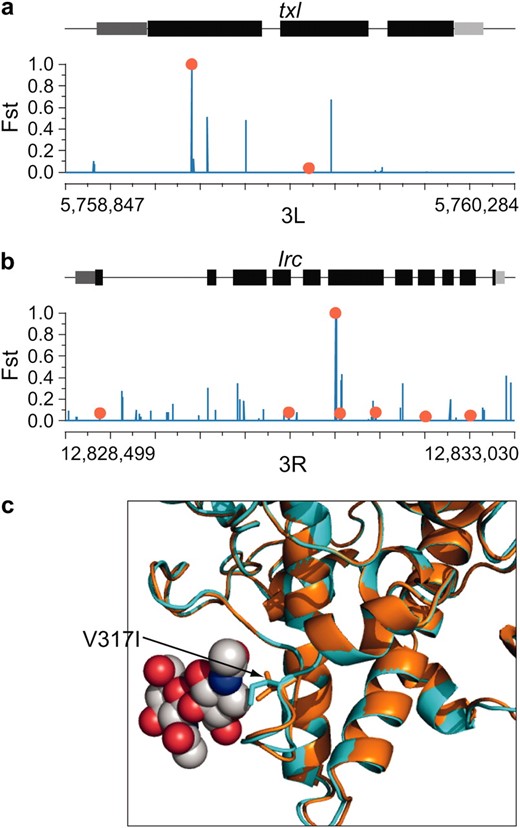
Elevated nonsynonymous FST in two melanogaster protein-coding genes. We plot individual-position FST along the gene structure. Exons are drawn in black, the 5′-UTR is dark gray, and the 3′-UTR is light gray. Nonsynonymous polymorphisms are shown in red; synonymous and noncoding polymorphisms are shown in blue. (a) A nonsynonymous fixed difference between Queensland and Tasmania is associated with elevated FST at the txl gene. (b) Elevated FST at a fixed protein-coding change in Irc. (c) Structural homology models of Queensland (orange) and Tasmania (turquoise) Irc; the V317I substitution is potentially involved in direct ligand interaction.
We also observed elevated FST around a nonsynonymous fixed substitution in Irc (Figure 7b), an immune-related catalase required to protect flies from microbial infection (Ha et al. 2005a,b). Although the observed V317I substitution in Tasmania is conservative and occurs in a disordered loop region, this position is in direct ligand contact in the protein structure, suggesting a potential functional role in modulating molecular interactions (Figure 7c). Alternatively, these changes could be affecting pre-mRNA processing. The two fixed substitutions in Tasmanian Irc are the nonsynonymous V317I change at the 5′ end of exon 6 and a synonymous G → A substitution 11 bases downstream. These changes could be involved in splicing regulation, as RNA secondary structure prediction suggests that they could produce a radical reorganization of pre-mRNA structure (see Figure S4).
One of the most differentiated protein domains in the genome is the ligand-binding domain of the NtR gene, an extracellular ligand-gated ion channel. Figure 8a shows a large number of polymorphisms across NtR, along with a cluster of three amino acid variants in the ligand-binding domain. The most differentiated of these variants is an I/V polymorphism for which the major allele in Queensland (I, frequency = 0.73) is the minor allele in Tasmania (frequency 0.1); FST for this site is 0.51. The remaining amino acid polymorphisms in this domain are an L/F polymorphism (FST = 0.14) and an E/D polymorphism (FST = 0.19). While L is the major allele in both populations at the first position, the E/D Queensland polymorphism is fixed for D in Tasmania. Structural homology modeling suggests that this E/D polymorphism occurs in the main immunogenic region (MIR) of the protein (Figure 8b). This region constitutes a loop sandwiched between β2 and β3 that binds autoimmune antibodies in myasthenia gravis patients in the homologous human muscle acetylcholine receptor (Tsouloufis et al. 2000; Dellisanti et al. 2007). The fact that the I/V polymorphism is found in close proximity to this region suggests the possibility that differentiation at NtR could affect interactions with other molecules, possibly those relating to the immune system.
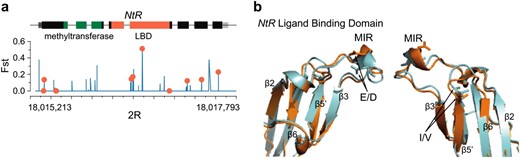
Elevated nonsynonymous differentiation in NtR localizes to the major immunogenic region (MIR) of the ligand-binding domain (LBD). (a) We plot positional FST across gene structure, with exons drawn in black, 5′-UTR in dark gray, and 3′-UTR in light gray; methyltransferase and ligand-binding domains are indicated by green and red, respectively. Nonsynonymous polymorphisms are shown by red circles. (b) We plot highly differentiated E/D and I/V polymorphisms on the predicted 3D structure of the NtR LBD. In both cases, the major allele in Queensland (E, I) is shown in orange, and the major allele in Tasmania (D, V) is shown in turquoise.
Biological patterns underlying genic differentiation:
The extensive genetic interactions and pleiotropic effects of laboratory mutations in Drosophila genes make it challenging to reliably infer from differentiated genes the phenotypes that may be targets of selection. Nevertheless, the small physical scale of differentiation makes it worthwhile to explore general patterns in the data as a means of generating hypotheses regarding pathways and phenotypes that might experience spatially varying selection in Australian melanogaster populations. Our approach was to test for enrichment of GO terms among the genes that overlapped a 1-kb window in the upper 2.5% tail of the distribution, which corresponds to FST > 0.27. These analyses were supplemented by inspection of genetic interactions annotated in FlyBase. We also point to plausible candidates in the 5% tail where appropriate.
Several high-FST windows overlapped genes functioning in central Drosophila signaling pathways, including the JAK-STAT pathway, the torso pathway, the EGFR pathway, and the TGF-β pathway. In the JAK-STAT pathway the ligand upd2 (1-kb FST = 0.70) and STAT (Stat92E, 1-kb FST = 0.32) both showed elevated FST, as did CycE (1-kb FST = 0.25) and Ptp61F (1-kb FST = 0.28), which regulate that pathway. Other modifiers of JAK-STAT signaling that overlapped high-FST windows included crb (1-kb FST = 0.35), tkv (1-kb FST = 0.39), Mad (1-kb FST = 0.35), and Stam (1-kb FST = 0.33). Highly differentiated genes in the torso signaling pathway (which regulates several processes, including metamorphosis and body size) included tup (1-kb FST = 0.41), Gap1 (1-kb FST = 0.26), pnt (1-kb FST = 0.60), tld (1-kb FST = 0.25), and csw (1-kb FST = 0.26). Differentiated genes in the EGFR signaling pathway included vn (1-kb FST = 0.27), argos (1-kb FST = 0.23), sprouty (1-kb FST = 0.29), Star (1-kb FST = 0.29), and ed (1-kb FST = 0.30). Genes in the TGF-β pathway were also overrepresented among high-FST windows and included dally (1-kb FST = 0.39), Mad, and tkv (1-kb FST = 0.39). The gene dpp, which is centrally located in this pathway, also contained a region of high differentiation (1-kb FST = 0.24). Finally, the hypothesis that ecdysone signaling experiences spatially varying selection is supported by highly differentiated windows overlapping the ecdysone receptor, EcR (1-kb FST = 0.25); the eclosion hormone gene Eh (1-kb FST = 0.33); Moses (1-kb FST = 0.41); taiman (1-kb FST = 0.37); and the ecdysone-induced protein-coding genes Eip63E (1-kb FST = 0.33), Eip74EF (1-kb FST = 0.31), Eip75B (1-kb FST = 0.30), and Eip93F (1-kb FST = 0.44). It is worth noting that substantial crosstalk exists between some of these pathways and that other genes associated with key pathways such as Notch show evidence of differentiation in our data.
These results support the existence of pervasive spatially varying selection acting at key genes throughout multiple Drosophila signaling pathways. It is highly plausible that several candidates influence clinal variation in body size, metabolism, and additional important life history traits (see Table S5 for a complete list of enriched GO terms). Many genes implicated in body-size variation were highly differentiated, including InR [1-kb FST = 0.26 (Paaby et al. 2010)], dally (1-kb FST = 0.39), Orct2, and Pi3K21B at the tip of 2L, which contains a highly differentiated 1-kb window (FST = 0.28) but was not included in most of our analyses because of its location at the distal end of the chromosome arm. Interestingly, many body-size candidate genes revealed by our analysis are located on chromosome arm 3R, which is consistent with previous genetic analyses showing that most of the body-size variation associated with the Australian cline is inseparable from In(3R)P in mapping crosses (Rako et al. 2006, 2007). Our data—including evidence of extensive recombination between standard and In(3R)P arrangements—suggest that the differentiated genes that are located on 3R are particularly promising targets for investigating the genetic basis of body-size variation in D. melanogaster.
A large number of GO terms related to developmental processes are enriched for FST outliers. The associated genes contribute to many phenotypes, including external morphology (e.g., wing and eye), nervous system development, ovarian follicle development, larval development, and embryonic development. The Toll signaling pathway, which contains a number of immune system genes, is enriched. The immunity gene sick is also in the 5% tail of FST windows. Olfactory behavior and olfactory learning are enriched in 1-kb outlier tails. In addition, a number of FST-outlier nonsynonymous SNPs not located in outlier windows are found in olfactory or gustatory receptors or odorant-binding proteins. Several ionotropic receptors, a new class of odorant receptors, appear in the 5% FST tail of 1-kb windows. It is interesting to note the evidence that thermal stress disrupts odor learning in flies (Wang et al. 2007) via developmental effects on the mushroom body, in light of the observation that “mushroom body development” is among the enriched GO terms in our analysis. A number of ion channel-related genes appear among the outlier 1-kb windows, leading to enrichment of GO categories: calcium-, potassium-, and sodium-ion transport. “Calcium ion binding” is the second most significantly enriched molecular function and includes several Cadherins as well as Calmodulin. Selection associated with variation in the visual environment between Queensland and Tasmania is suggested by the enrichment of GO terms such as “phototransduction.”
Although circadian rhythm genes are not overrepresented among the FST outliers, several genes relating to circadian biology are found among the most differentiated 1-kb windows. The cryptochrome gene, which regulates circadian rhythm, is highly differentiated (FST = 0.30), as are couch potato (FST = 0.23) and timeless (FST = 0.20), which have already been implicated in spatially varying selection in D. melanogaster (Sandrelli et al. 2007; Tauber et al. 2007; Schmidt et al. 2008). Another interesting candidate is norpA, a phospholipase C gene required for thermal synchronization of the circadian clock (Glaser and Stanewsky 2005). This gene is in the 2.5% FST tail and highly differentiated across its entire length (see Figure 9a). Four of its seven interacting partners annotated in FlyBase are also in the 2.5% tail (see Table S7). Additionally, norpA is known to regulate splicing in the 3′-UTR of per, a central circadian-clock gene in Drosophila (Collins et al. 2004; Majercak et al. 2004) that shows a highly localzed 3′-UTR elevation in FST in our data (Figure 9b). Together, these results strongly suggest a cluster of correlated differentiation occurring across several genes at the interface between thermal and light entrainment of the circadian clock.
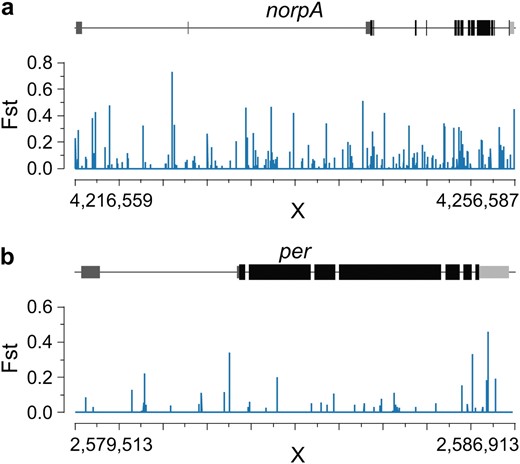
Coordinated differentiation in norpA (a) and the 3′-UTR of per (b), a known target of norpA splicing regulation. We plot individual-position FST along the gene structure. Exons are drawn in black, the 5′-UTR is dark gray, and the 3′-UTR is light gray.
Finally, transcription and chromatin regulation appear to be under widespread selection, as seven related biological process GO terms are enriched among the FST outlier windows. Additionally, “transcription factor” is the second most significantly enriched GO molecular function term. Particularly interesting differentiated genes include Trl, HDAC4, additional sex combs, Enhancer of polycomb, histoneacetlytransferase Tip60, Ino80, JIL-1, 14-3-3ε, and Sfmbt.
Copy-number variation:
Differences in copy number between Queensland and Tasmania were investigated using an outlier approach analogous to that used for FST. The normalized ratio of Queensland/Tasmania coverage for 1-kb nonoverlapping windows was calculated across the genome (see materials and methods), with the top 1% most-extreme estimates considered highly differentiated regions. Note that frequency variation and ploidy-level variation are confounded in this analysis. Relative to the genome-wide average of copy-number differentiation, slightly more than half (55%) of the 1-kb windows had more coverage in the Queensland population. However, significantly more (62.5%) of the highly differentiated windows showed increased copy number in the Tasmania population (P = 2.2 × 10⁻¹⁶), suggesting that duplication events could be important for local adaptation in Tasmania.
The largest region exhibiting significant copy-number variation (CNV) is a 107-kb region of chromosome 3R (Figure 10), which spans a small number of protein-coding genes including the last few exons of timeout and the entire Ace gene. Ace codes for an acetylcholinesterase associated with pesticide resistance (Menozzi et al. 2004), which was previously identified as a differentiated CNV between these populations (Turner et al. 2008). Interestingly, Ace expression has been shown to vary over the circadian cycle (Hooven et al. 2009), and acetylcholinesterase levels are highly correlated with pesticide resistance (Charpentier and Fournier 2001).
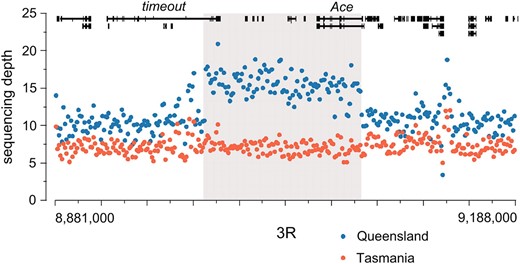
A large region of increased copy number in Queensland occurs on chromosome 3R. We plot the average number of sequence reads for each 1-kb window across this region, both for the Queensland (blue) and for the Tasmania (red) populations. Genes in this region are drawn across the top. The gray box indicates the inferred region of increased copy number in Queensland.
Gene Ontology enrichment analysis of genes found in highly differentiated CNV regions revealed categories similar to those observed for our FST enrichment analysis (see Table S6), including transcription factors and ion-channel genes. Across both GO-enrichment analyses, 185 unique GO terms were enriched, 66 of which (36%) were found in both analyses. Interestingly, despite the large degree of overlap between GO enrichment terms in the FST and CNV analyses, the specific genes associated with each enriched GO category did not overlap to a large degree. Of the 719 genes in the copy-number 1% outlier set and the 551 genes in the corresponding FST outlier set, only 72 (6%) were found in both (as expected given the upper bound of coverage included in the FST analysis). This suggests the possibility that selection may often result in recruitment of alleles resulting from both nucleotide and copy-number differences. Several terms enriched in the CNV GO analysis did not appear in the FST GO enrichment, including “circadian rhythm,” “sex determination,” “courtship and mating behavior,” “female meiosis chromosome segregation,” and “chorion-containing eggshell formation” (which was also detected by Turner et al. 2008).
DISCUSSION
A large body of evidence supports the idea that much of the phenotypic and genetic differentiation along the Australian D. melanogaster latitudinal cline is driven by spatially varying selection (Oakeshott et al. 1981, 1983; Singh and Rhomberg 1987; Singh 1989; Singh and Long 1992; Gockel et al. 2001; Kennington et al. 2003; Hoffmann and Weeks 2007). Here we have presented the first genome-sequence-based analysis of population differentiation associated with this cline. Although our analysis included only populations from each end of the cline, it is likely that the set of highly differentiated genomic regions between these cline endpoints is considerably enriched for targets of spatially varying selection. Indeed, the fact that the most highly differentiated genomic regions show much more negative Fay and Wu's H estimates in Tasmania is consistent with the hypothesis that the observed differentiation is associated with recent strong selection in temperate populations (Sezgin et al. 2004). The dramatic enrichment of several GO terms among the genes overlapping differentiated regions also supports the notion that selection plays a major role, because it is difficult to envision a neutral demographic process that could result in such enrichment patterns.
Two main lines of evidence support the proposition that gene regulation is an important target of spatially varying selection in these populations. First, 3′-UTRs and unannotated sequence are the most overrepresented sequence classes among the outlier 1-kb FST windows. 3′-UTRs, which exhibit the strongest enrichment in our analysis, play an important role in gene regulation (Lai 2002; Kuersten and Goodwin 2003; de Moor et al. 2005; Stark et al. 2005; Chatterjee and Pal 2009; Mangone et al. 2010). Recent studies have found substantial cis-acting effects on regulatory variation in Drosophila (Hughes et al. 2006; Lawniczak et al. 2008; Lemos et al. 2008; Graze et al. 2009; McManus et al. 2010); our results raise the intriguing possibility that variation in 3′-UTRs may make a significant contribution to adaptive cis-acting regulatory variation. The overrepresentation of noncoding DNA among FST outlier windows is consistent with previous population genetic results supporting the importance of noncoding sequence for adaptive divergence over longer timescales in D. melanogaster (Andolfatto 2005). It will be interesting to investigate these currently unannotated regions in the context of ongoing efforts to improve the annotation of the D. melanogaster genome (Celniker et al. 2009). The second line of evidence supporting the importance of selection on gene regulation along the cline is the finding that transcription- and chromatin-related genes are among the most differentiated in the genome, which is consistent with previous analyses of these populations (Levine and Begun 2008; Turner et al. 2008) and with genomic inferences on the importance of recurrent directional selection on proteins regulating chromatin and transcription in D. simulans (Begun et al. 2007).
Although the protein-coding sequence was underrepresented among the most extremely differentiated 1-kb windows, one should not conclude that amino acid variants are unimportant for selection along the cline, as a large number of outlier windows overlap coding sequence. It is interesting to consider possible population-genetic explanations for why CDS is underrepresented. The timescale of differentiation between Queensland and Tasmanian populations is very small, perhaps on the order of 1000 generations (Hoffmann and Weeks 2007). Because the mutation rate per base pair is small, much of the selective response during the initial colonization of Australia was likely the result of frequency changes of alleles already segregating in ancestral populations rather than from invasion into the populations of new mutations that occurred subsequent to colonization. Whole-genome surveys of polymorphism in Drosophila suggest that nonsynonymous sites are severalfold less polymorphic than synonymous or noncoding sites (e.g., Begun et al. 2007; Sackton et al. 2009). Thus, on a per-site basis compared to noncoding variants, amino acid variants are considerably less available to selection on standing variation following a radical change of the environment. The physical scale of differentiation predicted under the selection-on-standing-variation model depends on the amount of linkage disequilibrium associated with the site destined to experience selection after the environment changes. Surveys of linkage disequilibrium in normally recombining regions from large samples of cosmopolitan D. melanogaster consistently find that sites in strong linkage disequilibrium tend to be within 2 kb of each other (Miyashita and Langley 1988; Palsson et al. 2004; Macdonald et al. 2005). This is consistent with the scale of geographic differentiation observed in our data and with the hypothesis that much of the observed differentiation between temperate and tropical populations is the result of recent strong selection on standing variants. Genomic data on the frequency distribution of variation and the scale of linkage disequilbrium from populations along the Australian cline and from African and European populations should provide the resources necessary for addressing issues relating to the geographic origins, frequencies, and fitnesses of variants experiencing selection in Australia.
One of the general findings from our analysis is that many genes and pathways centrally important to Drosophila biology appear to experience spatially varying selection. The fact that laboratory mutations in these genes and pathways tend to be highly pleiotropic is, in the conventional thinking, associated with reduced mutation rate to beneficial alleles. It is important to realize, however, that it is the individual mutation—rather than the gene—that is more or less pleiotropic. The distribution of pleiotropic effects of natural variants is likely to be quite different and dramatically smaller than those of laboratory mutations. Moreover, the large population sizes of Drosophila suggest that drift may be relatively unimportant and that variants that reach appreciable frequencies may have special genetic and population-genetic properties. Thus, the candidate variants identified here may have very small pleiotropic effects, in spite of the fundamental biological roles of the corresponding genes. Alternatively, natural alleles that were pleiotropic along the axes favored by correlated natural selection would be strongly favored, and these too could constitute a considerable fraction of the variants in fundamental signaling pathways that show differentiation between these populations.
The genomic results regarding the dramatic biological differences between these fly populations raise the obvious question—unanswerable with these data—as to the phenotypic and fitness effects of the selected mutations and how the distribution of such effects may vary across biological functions and positions in genetic pathways. For example, one class of selected mutations may contribute to phenotypic differences between temperate and tropical flies, while a second—potentially larger—class exhibiting genotype × environment interactions may exhibit latitudinal clines, because different genotypes are required to produce a single optimal phenotype in different environments (e.g., Levine et al. 2011). Larger genomic data sets and functional analyses should produce much sharper inferences regarding the specific polymorphisms, pathways, and biological functions that have diverged under selection between temperate and tropical populations and further reveal the genetic and population-genetic principles of adaptation in this model species.
Footnotes
Supporting information is available online at http://www.genetics.org/cgi/content/full/genetics.110.123059/DC1.
These authors contributed equally to this work.
Footnotes
Communicating editor: M. W. Nachman
Acknowledgements
We thank Ary Hoffmann for generously sharing flies and A. Hoffmann and P. Schmidt for their thoughts on clinal variation in Drosophila. We thank Michael Nachman, J. Anderson, and two anonymous reviewers for comments that improved this manuscript. We also gratefully acknowledge Charis Cardeno, Kristian Stevens, Melissa Eckert, and Thaddeus Seher for technical assistance and Phil Nista for early contributions to the analysis. This work was funded by National Institutes of Health grants GM071926 and GM084056 (to D.J.B.), by the Drosophila Population Genomics Project (Chuck Langley, PI), and by Dartmouth College and the Neukom Institute (A.D.K.).
References
Beaumont, M., and R. Nichols,
Begun, D. J., and C. F. Aquadro,
Charpentier, A., and D. Fournier,
Coggill, P., R. D. Finn and A. Bateman,
Collins, B. H., E. Rosato and C. P. Kyriacou,
Colosimo, P., C. Peichel, K. Nereng, B. Blackman, M. Shapiro et al.,
Finn, R. D., J. Mistry, J. Tate, P. Coggill, A. Heger et al.,
Katoh, K., and H. Toh,
Knibb, W. R.,
Lemos, B., L. O. Araripe, P. Fontanillas and D. L. Hartl,
Levine, M. T., M. Eckert and D. J. Begun,
Lewontin, R. C.,
Nachman, M., H. Hoekstra and S. D'Agostino,
Schmidt, P., C. Zhu, J. Das, M. Batavia, L. Yang et al.,
Schmidt, P. S., D. D. Duvernell and W. F. Eanes,
Storey, J.,
Tsouloufis, T., A. Mamalaki, M. Remoundos and S. J. Tzartos,
Tweedie, S., M. Ashburner, K. Falls, P. Leyland, P. McQuilton et al.,
