


Abstract
We previously reported that corticosteroid-binding globulin gene (Cbg) may be the causal gene of a quantitative trait locus associated with cortisol levels, fat deposition, and muscle content in a pig intercross. Sequence analysis of parental animals allowed us to identify four amino-acid substitutions. Here we have examined if any of these single amino acid substitutions could be responsible for the difference in CBG binding and affinity for cortisol between the parental breeds, using in vitro assays of Cbg variants after transfection of mammalian cells. Additionally, the Cbg coding region was analyzed in samples from a synthetic pig line to study association between polymorphism and CBG biochemical properties, carcass composition, and meat quality. Both in vitro transfection assays and the association studies suggest a role of the Arg307Gly mutation in increasing CBG capacity (by >70%) and decreasing CBG affinity for cortisol (by 30%). The Ile265Val substitution may also have an effect on decreasing CBG affinity for cortisol by 25%. The mutations Ser15Ile and Thr257Met do not seem to have an effect on CBG parameters. The Arg307Gly substitution was the only mutation associated with a parameter of meat quality and no mutation was linked to carcass composition.
CORTICOSTEROID-BINDING globulin (CBG) is the major plasma transport protein for natural glucocorticoids (cortisol in man and pig, corticosterone in rodents) (Rosner 1990; Hammond 1995; Breuner and Orchinick 2002). CBG is synthesized essentially in the liver and then secreted in blood. However, CBG mRNA expression has also been reported in kidney, testis, lung, spleen, and ovary of various species. CBG is characterized as a 50- to 60-kDa monomeric glycoprotein with a single binding site for glucocorticoids. Glucocorticoids circulate in plasma in both free and CBG-bound forms with the free form being biologically active. Thereby CBG functions as a cortisol pool and CBG levels regulate plasma cortisol bioavailability and clearance (Bright 1995; Bright and Darmaun 1995). From its structure, CBG belongs to the serine protease inhibitors and substrate superfamily of proteins (Hammond et al. 1987). Indeed, CBG is a substrate of the serine protease elastase that cleaves CBG in its C-terminal part resulting in the dissociation of the CBG-glucocorticoid complex and the local release of glucocorticoid at sites of inflammation (Pemberton et al. 1988; Hammond et al. 1990). A larger spectrum of action of CBG is suggested by several studies reporting the presence of CBG membrane receptors in extravascular sites (Hryb et al. 1986; Strel'chyonok and Avvakumov 1991; Maitra et al. 1993) and the fact that 68% of CBG remains in a cortisol-free state under physiological conditions (Gayrard et al. 1996).
Recently, CBG involvement in the obesity phenotype has been suggested by several reports. In humans, CBG levels are negatively correlated with body mass index, waist-to-hip ratio, insulin resistance, and blood pressure, all parameters defining the metabolic syndrome (Fernandez-Real et al. 2002). Total or partial deficiency of CBG detected in some patients is associated with obesity and leads to a compensatory response of the hypothalamus-pituitary-adrenal axis to balance plasma free-cortisol concentrations (Emptoz-Bonneton et al. 2000; Torpy et al. 2001). However, this feedback control does not compensate for the lack of CBG at the tissue level, especially in adipose tissue, as preadipocytes from CBG-deficient patients display increased proliferation and enhanced differentiation compared to control cells (Joyner et al. 2003). Excess CBG leading to elevated total and free cortisol levels may also induce increased adiposity as reported in our previous study. We have proposed that corticosteroid-binding globulin gene (Cbg) may be the causal gene of a quantitative trait locus (QTL) associated with cortisol levels, fat deposition, and muscle content in a pig intercross (Ousova et al. 2004).
In Ousova et al. (2004) we reported that CBG binding capacity was three times higher in Meishan (MS) compared to Large White (LW) parental breeds and that the dissociation constant (Kd) was 40% higher in the MS breed. Also, a preliminary assay detected a sevenfold difference in CBG mRNA expression between animals of the two breeds chosen for their extreme CBG binding capacity. Haplotype analysis of six LW and six MS parental animals allowed us to identify five CBG protein variants containing one or a combination of the four amino acid substitutions (Ser15Ile, Thr257Met, Ile265Val, Arg307Gly). We have shown that none of these substitutions in isolation could explain the difference in CBG capacity between the two pig breeds.
The difference in CBG levels between the two breeds may be due to a difference in the rate of secretion of the protein, which can be modulated by an amino acid substitution. The Ser15Ile change located in the signal peptide could influence the secretion of CBG. However, we did not find any effect of this mutation in a first in vitro experiment (Ousova et al. 2004). CBG level variations may also be explained by a difference in the rate of transcription of the Cbg gene, due to changes located in the promoter or in the transcriptional regulatory regions. Finally, another alternative may lie in the impact of a single nucleotide polymorphism (SNP) on Cbg mRNA stability. A combination of these mechanisms could explain the difference in CBG capacity between LW and MS pigs.
In this study, we have investigated if one of the amino acid substitutions identified previously between the two pig breeds could be responsible for the reduced steroid binding affinity and for the higher CBG binding capacity observed in the MS breed. This article describes in vitro assays of the individual Cbg variants, which were generated by in vitro mutagenesis, after transfection of mammalian cells with expression vectors containing these variants to determine the impact of amino acid substitution on CBG binding capacity and its affinity for cortisol. Additionally, an association analysis was performed on an MS × LW synthetic pig breed. The Cbg gene was sequenced in samples of animals from this breed to detect molecular polymorphisms and to study the association between these polymorphisms, CBG biochemical properties, carcass composition, and meat quality measurements. Overall, the data accumulated in this study point to the Cbg gene and particularly the Arg307Gly substitution as an important regulator of CBG binding capacity and some aspects of meat quality.
MATERIALS AND METHODS
Animals:
Animals were 100 female pigs from PIC (Oxford, UK), a Meishan × Large White advanced intercross population (MS × LW). The gilts were reared under the same environment and product regime in a farm in southwestern France. At ∼140 days of age they were transported for 10 hr in batches of ∼25 to overnight lairage at a research abattoir in Spain (IRTA Monells). The gilts were slaughtered according to normal commercial practices after weighing and CO2 stunning. Details for meat quality measurement can be found in Geverink et al. (2006)
DNA isolation and genotyping:
For all MS × LW pigs, genomic DNA was isolated from whole blood using the Wizard genomic DNA purification kit (Promega, Madison, WI). Sequencing of 92 MS × LW gilts across exons 2–5, and intron 3 was performed to determine the genotypes of 18 SNPs reported by Ousova et al. (2004) and using the primers as described therein, with an M13F tag added to the forward primer sequence and an M13R tag added to the reverse primer sequence. After the PCR, the fragments were cleaned up using ExoSapIT and sequenced using the M13 primers. All the reactions were carried out using the ABI big dye sequencing kit, using the recommended conditions, and run on an ABI 3700.
Real-time RT–PCR:
Liver total RNA from pigs of each breed (20 LW and 17 MS) was extracted with the Trizol kit (Life Technologies, Cergy-Pontoise, France) according to the manufacturer's protocol. Real time quantitative RT–PCR was performed using a Rotor-Gene 2000 (Corbett Research, Sydney) with primers already described in Ousova et al. (2004). CBG mRNA expression was normalized using the expression of three housekeeping genes (RPL19, β-microglobulin, β-actin) as the normalizing factor.
Synthesis of CBG cDNA:
Cbg cDNA was obtained by RT–PCR from total RNA isolated from LW pig liver by Trizol reagent (Life Technologies) using M-MLV reverse transcriptase (Promega, Charbonnières, France). PCR with primer 5′-ACAATGCTGCTCACCCTGTA-3′ containing the ATG codon and with primer 5′-TCAGATGAGCTGTGGTTCCTA-3′ located a few bases after the stop codon allowed a 1257-bp cDNA fragment containing the entire coding sequence to be obtained.
Construction of CBG cDNA expression vectors and site-directed mutagenesis:
The 1257-bp cDNA PCR product was inserted into pTarget mammalian expression vector by ligation (Promega). Then codons for Ser15 (AGC → ATC), Thr257 (ACG → ATG), Ile265 (ATC → GTC), and Arg307 (AGA → GGA) were mutated using a mutagenesis kit (GeneEditor in vitro Site-Directed Mutagenesis System, Promega), according to instructions provided by Promega. The primers used for site-directed mutagenesis were mutT133 (5′-TCGACCATCGGGCTCTG-3′), mutT859 (5′-GCTGGAATACATGGGCAATGAGACGG-3′), mutG882 (5′-CCTTCTTCGTCCTCCCG-3′), and mutG1008 (5′-GGTCTCCATCTCCGGAGCCTATGACC-3′), respectively. The resulting cDNAs encoding Ile15-CBG, Met257-CBG, Val265-CBG, and Gly307-CBG were checked by sequencing to confirm that no inappropriate mutations had occurred.
Expression of CBG cDNA in cell cultures:
The pTarget expression vectors corresponding to various variants and unmodified LW CBG cDNA (WT-CBG) were transfected into human embryonic kidney (HEK-293T) cells using FuGENE 6 transfection reagent (Roche Diagnostics, Meylan, France) according to the manufacturer's protocol. In brief, exponentially growing 293T cells (2 × 10⁵ cells) were incubated 20 hr in DMEM containing 10% fetal calf serum (DMEM/FCS). A FuGENE 6 reagent:DNA ratio of 3 μl:1 μg was used for transfection experiments in each well of a six-well plate. Transfected cells were cultured in 2 ml of DMEM/FCS for 48 hr and the supernatant was collected to analyze secreted CBG. Three to five independent assays were performed for each variant Cbg vector. Each assay included 6, 9, or 12 replicates of transfection using plasmids that were independently purified at least twice. For each transfection, replicate means were calculated for CBG binding capacity (Bmax) and Kd values. In all assays Cbg variants (Ile15-CBG, Met257-CBG, Val265-CBG, or Gly307-CBG) were analyzed in comparison with wild-type Cbg (WT-CBG). Significance of differences between variants and WT-CBG data (P < 0.05) was obtained using Student's t-test within each transfection. Finally, results of Bmax and Kd are given in mean percentage compared with wild-type CBG values. Results are presented as mean ± SEM.
CBG binding assay:
The binding capacity of CBG and its affinity for cortisol were measured at 4° by a solid phase binding assay using Concanavalin A-Sepharose as described in Ousova et al. (2004). The CBG binding assay was performed with 400 μl of medium collected from transfected 293T cells or 300 μl of plasma sample. The binding capacity of CBG for cortisol was calculated by nonlinear regression, using bound as the quantity of cortisol specifically bound to the glycoproteins adsorbed to the gel and free as the concentration of cortisol in the aqueous phase.
Statistics:
The effect of Cbg gene haplotype on CBG Bmax, Kd, and cortisol in MS × LW pigs was estimated using a mixed linear model. One variable was included for each haplotype, with values 0, 1, and 2 corresponding to the animal having 0, 1, or 2 copies of the haplotype in question. Batch was assumed to have a random effect. Regression coefficients were obtained for all haplotypes and contrasts tested for significance. Finally, for MS × LW pigs the effect of Cbg gene haplotypes on meat quality variables was studied in a mixed linear model, including the microsatellite marker Sw1856 alleles as covariates with a fixed effect and batch as a factor with a random effect. All calculations were performed with SAS version 8 (SAS Institute, Cary, NC).
RESULTS
CBG mRNA expression in LW and MS breeds:
In a previous study (Ousova et al. 2004) we demonstrated that the maximal binding capacity was on average three times higher in MS compared to LW pigs. A preliminary analysis by real time quantitative RT–PCR, realized from only three CBG Bmax extreme animals of each breed, had shown a high difference in Cbg liver mRNA expression. To investigate this further we performed the same analysis from a higher number of animals of each breed. As depicted in Figure 1, normalized Cbg mRNA expression was twofold higher in MS (5.35 ± 0.33) than in LW liver (2.66 ± 0.69), P < 0.0005. Additionally, we observed a high correlation between Cbg mRNA level and CBG Bmax for individual animals in both breeds: for LW pigs, r = 0.63, P = 0.0028; MS pigs, r = 0.70, P = 0.0023.
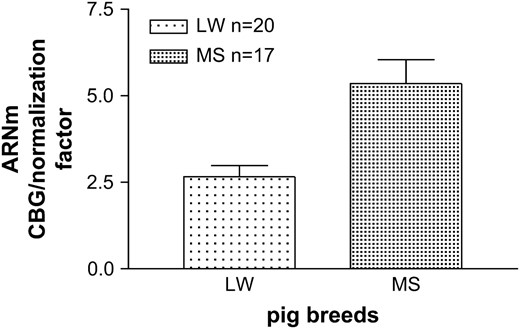
Cbg mRNA expression in liver of LW and MS breeds. Real time RT–PCR of CBG mRNA expression in liver of LW and MS breeds. Cbg mRNA expression was normalized using the expression of three housekeeping genes as normalized factor.
CBG cDNA sequence:
The Cbg cDNA was synthesized by RT–PCR using total RNA isolated from an LW pig liver. The sequence of this cDNA showed that this animal displays the major haplotype found in pure LW pigs (Ousova et al. 2004), although some nucleotide changes were observed compared to the previously published sequences (Heo et al. 2003; Ousova et al. 2004). One SNP already described by Heo et al. (2003) (1133G → A) and four new SNPs (499G → A, 551T → C, 704G → A, and 1160G → A) were identified. Among these four SNPs, only the first one (499G → A) induces an amino acid change in the sequence (Glu137 → Gly). This cDNA was cloned into a mammalian expression vector and was transfected into 293T cells to serve as control vector (called WT-CBG) for the functional analysis of Cbg variants.
CBG binding analysis of normal and variant CBG expressed in 293T cells:
We used site-directed mutagenesis to prepare Cbg variants from WT-CBG. Four Cbg variants were constructed: Ile15-CBG containing Ile15, Met257-CBG containing Met257, Val265-CBG containing Val265, and Gly307-CBG containing Gly307. CBG Bmax and Kd were determined by Scatchard plot analysis. We present here the mean of results emerging from different assays as described in the materials and methods. Results of Bmax and Kd for cortisol are given in mean percentage variation compared to WT-CBG (Figures 2 and 3). No significant difference was found in Bmax and in Kd values between Ile15-CBG and WT-CBG. However, compared to WT-CBG, a significant diminution in Bmax value (from −47% to −14% depending on the assay, P < 0.05) was observed with Met257-CBG variant and an increase of 25–41% (depending on the assay, P < 0.05) in Bmax value was observed for Val265-CBG. However, no significant difference was observed in Kd value for these two last variants. For Gly307-CBG variant, CBG parameters were highly increased compared to WT-CBG values (Bmax: 65–111%, P < 5.10−6; Kd: 25–69%, P < 0.05).
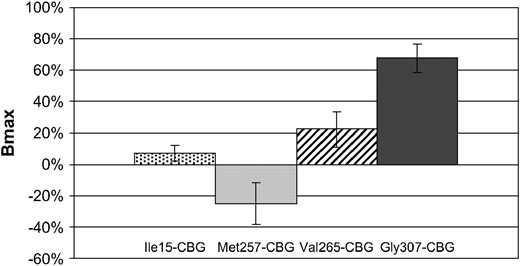
CBG binding capacity of CBG variants transfected in 293T cells. Results of CBG capacity are given in percentage compared with wild-type CBG capacity. Significance of differences in data (**P < 0.05) was determined using Student's t-test.
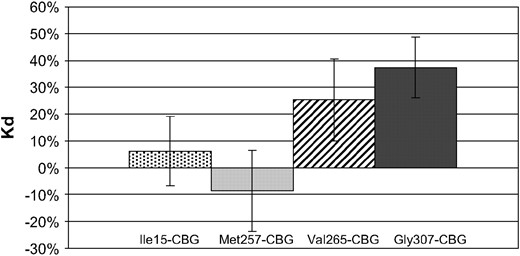
CBG dissociation constant (Kd) of CBG variants transfected in 293T cells. Results of Kd are given in percentage compared with wild-type CBG capacity. Significance of differences in data (**P < 0.05) was determined using Student's t-test.
CBG Kd values obtained in an in vitro assay for WT-CBG (n = 36; mean Kd ± SEM: 0.62 ± 0.019 nm) were very similar to those obtained in the LW pigs having residue Arg307 (n = 21, mean Kd ± SEM: 0.78 ± 0.112 nm). Similarly Gly307-CBG variant (n = 36, mean Kd: 0.85 ± 0.029 nm) showed a similar Kd value to MS pigs (n = 31, mean Kd: 1.02 ± 0.064 nm). Consequently, the difference in Kd means between LW and MS is similar to that between WT-CBG and Gly307-CBG variant (i.e., 37 vs. 31%).
Sequence analysis of the CBG gene and association with CBG Bmax and Kd in an MS × LW breed:
To evaluate the impact of amino acid substitutions in vivo, we studied at the molecular level a synthetic pig line corresponding to an MS × LW advanced intercross. Sequencing 92 MS × LW gilts across exons 2–5 and intron 3 for 18 polymorphisms enabled us to define nine haplotypes. Within this synthetic pig line, the haplotypes differed with respect to CBG Bmax (P < 0.0001, Table 1). The lowest levels of CBG Bmax were associated with the presence of Ile in position 265 (SNP882) and Arg in position 307 (SNP1008) as judged from haplotypes 1 and 2, except for the three animals of haplotype 4 with Gly in position 307. Conversely, the highest levels of CBG Bmax were found in haplotypes 6–9 harboring a Val in position 265 and a Gly in position 307 and haplotype 3 that displays an Ile in position 265 and a Gly in position 307. Haplotype 5 is associated with an intermediary CBG Bmax value although it harbors a Val265 and a Gly307. The presence of Met in position 257 seems to have no effect as judged by comparison of haplotype 6 with the haplotypes 7–9. These results led us to explore further the effect of SNP882 and SNP1008 (corresponding to mutation Ile265Val and Arg307Gly, respectively) on CBG Bmax and Kd. As shown in Table 2, the SNP882 polymorphism has no effect on CBG Bmax but influences CBG Kd. For SNP1008 leading to Arg307Gly mutation, a clear effect is found on both CBG Bmax and Kd.
Haplotype analysis of 92 MS × LW gilts and estimates of CBG binding capacity (Bmax) and dissociation constant (Kd) of each haplotype
Position | |||||||||||||||||||||
|---|---|---|---|---|---|---|---|---|---|---|---|---|---|---|---|---|---|---|---|---|---|
| Exon 2 | Exon 3 | Intron3 | Exon 4: | Exon 5 | Estimates | ||||||||||||||||
| Haplotype | n | 134 | 446 | 539 | 620 | 626 | 859a | 866 | 882b | 890 | 960 | +42 | −58 | 1008c | 1397 | 1437 | 1446 | 1472 | 1475 | Bmax CBG (nm) | Kd CBG (nm) |
| 1 | 61 | C | C | C | A | G | C | T | A | G | C | T | C | A | NBd | C | C | G | A | 17.45 ± 2.19x | 0.24 ± 0.02x |
| 2 | 38 | — | — | — | — | A | — | — | — | — | — | — | — | — | — | — | — | — | — | 16.75 ± 2.89x | 0.29 ± 0.02x,y |
| 3 | 38 | — | — | — | — | A | — | — | — | — | — | — | — | G | — | — | — | — | — | 52.74 ± 2.56z | 0.34 ± 0.02y,z |
| 4 | 3 | — | — | — | — | — | — | — | — | — | — | — | — | G | — | — | — | — | — | 19.76 ± 10.38x,y | 0.30 ± 0.08x,y,z |
| 5 | 21 | T | — | T | — | — | — | C | G | C | — | — | T | G | C | — | — | — | — | 28.67 ± 3.47y | 0.36 ± 0.03z |
| 6 | 9 | — | — | — | G | — | T | C | G | C | T | C | — | G | — | T | G | A | G | 53.37 ± 6.18z | 0.33 ± 0.05x,y,z |
| 7 | 10 | T | T | — | — | — | — | C | G | — | — | C | — | G | — | — | G | — | G | 54.89 ± 5.65z | 0.37 ± 0.04y,z |
| 8 | 3 | — | — | — | G | — | — | C | G | — | — | C | T | G | C | — | — | — | — | 39.82 ± 10.40y,z | 0.39 ± 0.087x,y,z |
| 9 | 1 | — | — | — | — | — | — | C | G | — | — | — | — | G | — | — | G | — | G | 48.07 ± 17.66x,y,z | 0.74 ± 0.13v |
An estimate represents the additive effect of 1 copy of a haplotype. Estimates without a common superscript letter (v, x, y, z) differ, P < 0.05. NB, no base.
Mutation leading to amino acid change: Thr257Met.
Mutation leading to amino acid change: Ile265Val.
Mutation leading to amino acid change: Arg307Gly.
Effect of SNP 882 and SNP 1008
Genotype | ||||||
|---|---|---|---|---|---|---|
| A/A | A/G | G/G | ||||
| Bmax (nm) | n | Bmax (nm) | n | Bmax (nm) | n | |
| A. On CBG Bmax (nm) | ||||||
| SNP882 | 56.13 ± 3.75 | 57 | 67.20 ± 4.86 | 34 | 64.13 ± 12.66 | 5 |
| SNP1008 | 33.67 ± 3.85x | 30 | 67.34 ± 3.08y | 47 | 85.77 ± 4.84z | 19 |
| SNP882 | ||||||
| A/A | A/G | G/G | ||||
| Kd (nm) | n | Kd (nm) | n | Kd (nm) | n | |
| B. On CBG Kd (nm) | ||||||
| SNP882 | 0.58 ± 0.02x | 57 | 0.65 ± 0.03y | 34 | 0.73 ± 0.07y,z | 5 |
| SNP1008 | 0.53 ± 0.03x | 30 | 0.64 ± 0.02y | 47 | 0.67 ± 0.03y,z | 19 |
Mean values within a row lacking a common superscript letter (x, y, z) differ significantly.
Carcass composition and meat quality in relation to CBG Arg307Gly polymorphism:
Because in our previous studies (Ousova et al. 2004; Geverink et al. 2006) we found an association between CBG (gene polymorphism and Bmax) and carcass composition and meat quality, we decided to evaluate the specific effect of each haplotype on these traits (Table 3). As no significant effect was found we evaluated the specific effect of SNP1008 on these traits in our new population. No effect was found on fatness or muscle content parameters. However, a meat quality parameter, the percentage of drip loss, is influenced by this polymorphism. Leastsquares means of drip loss percentage for the three genotypes at this marker are: 2.59 ± 0.28 (animals A/A, n = 27), 2.65 ± 0.24 (animals A/G, n = 41), and 3.55 ± 0.34 (animals G/G, n = 18), P < 0.05.
Estimates (± SE) of carcass composition and pork quality variables of each haplotype
Pork carcass and pork quality characteristics | ||||||||||
|---|---|---|---|---|---|---|---|---|---|---|
| Haplotype | ADG (g/day)a | Ham yield (%) | Loin yield (%) | Leaf fat (%) | LM area (cm2) | Estimated lean contentb (%) | Drip loss (%) | Lightness (L*) valuec | LM IM fat (%) | LM pHd |
| 1 | 416.97 ± 19.43 | 11.61 ± 0.19 | 8.23 ± 0.20 | 6.07 ± 0.80 | 15.04 ± 3.77 | 24.23 ± 1.06 | 1.11 ± 0.29 | 23.49 ± 0.50 | 0.95 ± 0.21 | 2.78 ± 0.02 |
| 2 | 388.02 ± 21.69 | 11.73 ± 0.21 | 8.22 ± 0.22 | 5.45 ± 0.90 | 17.07 ± 3.86 | 25.18 ± 1.19 | 1.67 ± 0.34 | 24.38 ± 0.56 | 0.62 ± 0.24 | 2.75 ± 0.02 |
| 3 | 405.93 ± 23.88 | 11.77 ± 0.23 | 7.94 ± 0.24 | 6.24 ± 0.98 | 16.20 ± 3.82 | 24.50 ± 1.30 | 1.95 ± 0.36 | 23.80 ± 0.62 | 0.89 ± 0.26 | 2.74 ± 0.03 |
| 4 | 433.53 ± 53.23 | 11.78 ± 0.51 | 7.42 ± 0.54 | 5.22 ± 2.21 | 15.44 ± 4.36 | 25.50 ± 2.92 | 2.13 ± 0.78 | 25.61 ± 1.38 | 2.12 ± 0.59 | 2.83 ± 0.06 |
| 5 | 423.67 ± 25.35 | 11.35 ± 0.25 | 8.18 ± 0.26 | 6.48 ± 1.07 | 13.84 ± 3.83 | 23.04 ± 1.42 | 1.98 ± 0.38 | 23.63 ± 0.67 | 1.07 ± 0.29 | 2.78 ± 0.03 |
| 6 | 435.64 ± 38.73 | 12.11 ± 0.37 | 8.47 ± 0.39 | 4.14 ± 1.62 | 18.94 ± 4.44 | 24.39 ± 2.14 | 1.31 ± 0.58 | 22.64 ± 1.01 | 0.81 ± 0.43 | 2.78 ± 0.04 |
| 7 | 444.36 ± 36.41 | 11.60 ± 0.35 | 8.17 ± 0.37 | 6.50 ± 1.52 | 16.94 ± 4.00 | 22.78 ± 2.02 | 1.59 ± 0.56 | 24.44 ± 0.95 | 1.07 ± 0.41 | 2.77 ± 0.04 |
| 8 | 426.81 ± 58.47 | 11.39 ± 0.56 | 7.18 ± 0.59 | 4.43 ± 2.42 | 13.66 ± 4.77 | 25.75 ± 3.19 | 2.31 ± 0.86 | 25.84 ± 1.51 | 0.75 ± 0.77 | 2.73 ± 0.07 |
| 9 | 403.91 ± 90.84 | 10.58 ± 0.90 | 7.38 ± 0.92 | 4.61 ± 3.88 | 12.67 ± 5.79 | 25.09 ± 5.17 | 0.92 ± 1.35 | 23.30 ± 2.44 | 0.76 ± 1.04 | 2.89 ± 0.10 |
| P | 0.55 | 0.43 | 0.32 | 0.74 | 0.13 | 0.85 | 0.08 | 0.40 | 0.36 | 0.35 |
IM, intramuscular; LM, longissimus thoracis muscle.
Average daily gain (70–140 days of age).
Estimated lean content = 61.56 − (0.878 × fat depth in mm) + (0.157 × LM depth in mm).
L* is a measure of darkness to lightness (a larger L* value indicates a lighter color).
pH at 24 hr postmortem in LM.
DISCUSSION
The results of Cbg mRNA expression analysis in the liver of the two pig breeds show twice as much expression for the MS as for the LW. A high correlation was observed between Cbg mRNA and Bmax, suggesting that the CBG Bmax difference comes in large part (r2 = 40% in LW and r2 = 50% in MS) from a difference in Cbg mRNA levels and consequently a difference in protein synthesis. In other words, this result implies that the difference in CBG binding between the two breeds is in large part a result of a difference at the level of the transcriptional regulation of Cbg or in Cbg mRNA stability.
The in vitro assays confirmed that the substitution Ser15Ile located in the signal peptide of CBG protein does not have any effect on the secretion and affinity of CBG (as measured by binding activity). As to Thr257Met and Ile265Val substitutions, both produce small changes on CBG Bmax. However, the Arg307Gly substitution increases CBG Bmax considerably in cultured cells. Thus, it may be that this single nucleotide change induces greater mRNA stability and/or three-dimensional structural differences resulting in a more efficient secretion of CBG protein. This Arg307Gly substitution also increases the CBG dissociation constant, with a difference equivalent to that observed between MS and LW breeds. Thus, the Arg307Gly substitution identified essentially in the MS breed probably accounts for most of the reduction in steroid binding affinity.
To evaluate the in vivo impact of our in vitro results, we have studied Cbg gene polymorphisms in a population of MS × LW intercross pigs at the molecular level. In a previous study (Geverink et al. 2006) we have shown that CBG Bmax was high in this line compared to four other European lines and that in this line and in the LW breed, CBG Bmax was correlated to plasma cortisol. Furthermore, CBG Bmax had an effect on meat quality particularly in the MS × LW line, on fat content, and meat drip loss percentages. Here, sequence analysis of 184 chromosomes from the MS × LW line allowed us to refine the in vitro analysis. Comparison of haplotype 6 with haplotypes 7–9 led us to conclude that the Thr257Met mutation has no effect on CBG Bmax because there are no significant differences in CBG Bmax mean among these haplotypes that are very similar except for the Thr257Met substitution and because CBG Bmax mean is homogeneous despite the small number of animals observed (n = 9). Similarly, comparison of haplotype 3 with haplotypes 6–9 led us to conclude that Ile265Val mutation has probably no effect on CBG Bmax because there is no significant difference in CBG Bmax mean among these haplotypes. Conversely, the Arg307Gly mutation is associated with the haplotypes showing high or intermediary CBG Bmax values—except haplotype 4—but only three animals contain this haplotype. The analysis of Ile265Val mutation (SNP882) and Arg307Gly mutation (SNP1008) on CBG Bmax and Kd confirmed that the Arg307Gly mutation has a significant effect on Bmax but that the Ile265Val mutation does not. However, both mutations influence CBG Kd.
Overall, the in vivo data fit rather well with the in vitro results, highlighting the importance of the Arg307Gly mutation on CBG Bmax and Kd but not confirming the small influence of Thr257Met and Ile265Val mutations on CBG Bmax. The Ile265Val substitution has a significant effect on CBG Kd in the MS × LW population but this effect was not significant in the in vitro assays if we average the data from all transfections. However, this effect was significant in two of three transfection assays. Genetic variants of CBG have been reported in rat (Smith and Hammond 1991), in mouse (Orava et al. 1994), and in humans (Van Baelen et al. 1982; Smith et al. 1992; Emptoz-Bonneton et al. 2000; Brunner et al. 2003). The alignment of pig and rat amino acid sequences shows that the pig Arg307 amino acid is located at two residues of the substitution Met276Ile in the rat that is implicated in reduced steroid binding affinity of the BioBreeding rat (Smith and Hammond 1991). According to the deduced tertiary structure of CBG (Dey and Roychowdhury 2003), amino acids Gln232, Asn238, Ile263, and Trp266 seem involved in ligand binding in humans and are well conserved across species. In our pig model, Thr257Met and Ile265Val are very close to these important amino acids and within the β-barrel, which has been involved in steroid binding (Dey and Roychowdhury 2003).
The association analysis shows a 155% increase in CBG Bmax between animals homozygous Arg307/Arg307 and animals Gly307/Gly307, whereas in vitro the mean difference was 77%. Concerning CBG Kd and the Arg307Gly mutation, the in vivo data show a 26% increase for animals Gly307/Gly307 compared with a 37% difference in vitro, whereas for Ile265Val mutation both in vitro and in vivo data display a 25% change in Kd between Ile265/Ile265 and Val265/Val265 genotypes. For obvious reasons, these differences between in vitro and in vivo data may be due to technical reasons linked to CBG expression in culture cells through transfection of cDNA. This is supported by the fact that CBG Bmax varies but Kd is not very different. Alternatively, the in vivo highest difference for Arg307Gly mutation on CBG Bmax may be due to other mutations in the Cbg gene that would additively influence CBG Bmax. There are other lines of evidence suggesting that other as yet unknown mutations influence CBG Bmax. In this study we found that haplotype 5 harboring Gly307 is associated with an intermediate CBG Bmax value, significantly lower than CBG Bmax from haplotypes 3, 6, and 7. Moreover, in our previous study (Ousova et al. 2004) the highest genetic linkage with cortisol values and CBG Bmax traits was found in the progeny of the F1 sire 910045, meaning that this animal must be heterozygous at the causal mutation. However, this F1 sire is homozygous Gly307/Gly307, demonstrating that other mutation(s) remain to be discovered. Additionally, the F1 sire 910081 was heterozygous for Arg307/Gly307 mutation but no contrast was found for cortisol values in its progeny. Finally, CBG Bmax was found to influence fat deposition in two independent studies (Ousova et al. 2004; Geverink et al. 2006), but this finding was not replicated in this analysis. This latter result suggests that the mutations examined in this study are not the cause of the major difference in body composition between LW and MS breeds. However, this hypothesis should be moderated by the fact that the population analyzed in the original study is different in type [F2 (LW × MS) vs. F10 (LW × MS)] and size (>600 vs. 100 pigs).
In conclusion, we have provided good evidence, supported by in vitro and in vivo data, that the Arg307Gly mutation influences CBG Bmax and Kd. Additionally, the Ile265Val mutation may have an influence on CBG Kd. These findings do not explain all CBG Bmax variations observed and their associated effect on fat deposition. Other mutations probably remain to be identified in noncoding regions of the Cbg gene, probably in regions regulating the level of Cbg mRNA transcription. However, the impact of the Arg307Gly mutation on CBG Bmax and on meat drip loss percentage found in this study should be taken into account in pig selection schemes if replicated in separate and larger populations. More generally, this study further suggests that naturally occurring Cbg gene polymorphisms may have an impact on CBG protein function and regulation of the hypothalamic-pituitary-adrenal axis.
Footnotes
Communicating editor: C. Haley
Acknowledgement
The authors thank the Quality Pork Genes project (http://www.qualityporkgenes.com), supported by European Community FP5 QLK5-CT-2001-01888, for providing the LW × MS samples. We thank Andy Day for his contribution to the sequencing work and Nathalie Iannuccelli for the genotyping.
References
Breuner, C. W., and M. Orchinik,
Bright, G. M.,
Bright, G. M., and D. Darmaun,
Brunner, E., J. Baima, T. C. Vieira, J. G. Vieira and J. Abucham,
Dey, R., and P. Roychowdhury,
Emptoz-Bonneton, A., P. Cousin, K. Seguchi, G. V. Avvakumov, C. Bully et al.,
Fernandez-Real, J. M., M. Pugeat, M. Grasa, M. Broch, J. Vendrell et al.,
Geverink, N. A., A. Foury, G. S. Plastow, M. Gil, M. Gispert et al.
Gayrard, V., M. Alvinerie and P. L. Toutain,
Hammond, G. L.,
Hammond, G. L., C. L. Smith, I. S. Goping, D. A. Underhill, M. J. Harley et al.,
Hammond, G. L., C. L. Smith, N. A. Paterson and W. J. Sibbald,
Heo, J., H. G. Kattesh, R. L. Matteri, J. D. Grizzle and J. D. Godkin,
Hryb, D. J., M. S. Khan, N. A. Romas and W. Rosner,
Joyner, J. M., L. J. Hutley, A. W. Bachmann, D. J. Torpy and J. B. Prins,
Maitra, U. S., M. S. Khan and W. Rosner,
Orava, M., X. F. Zhao, E. Leiter and G. L. Hammond,
Ousova, O., V. Guyonnet-Duperat, N. Iannuccelli, J. P. Bidanel, D. Milan et al.,
Pemberton, P. A., P. E. Stein, M. B. Pepys, J. M. Potter and R. W. Carrell,
Rosner, W.,
Smith, C. L., and G. L. Hammond,
Smith, C. L., S. G. Power and G. L. Hammond,
Strel'chyonok, O. A., and G. V. Avvakumov,
Torpy, D. J., A. W. Bachmann, J. E. Grice, S. P. Fitzgerald, P. J. Phillips et al.,
Van Baelen, H., R. Brepoels and P. De Moor,
