


Abstract
To reveal phenotypic and functional genomic patterns of mitonuclear adaptation, a laboratory adaptation study with Caenorhabditis elegans nematodes was conducted in which independently evolving lines were initiated from a low-fitness mitochondrial electron transport chain (ETC) mutant, gas-1. Following 60 generations of evolution in large population sizes with competition for food resources, two distinct classes of lines representing different degrees of adaptive response emerged: a low-fitness class that exhibited minimal or no improvement compared to the gas-1 mutant ancestor, and a high-fitness class containing lines that exhibited partial recovery of wild-type fitness. Many lines that achieved higher reproductive and competitive fitness levels were also noted to evolve high frequencies of males during the experiment, consistent with adaptation in these lines having been facilitated by outcrossing. Whole-genome sequencing and analysis revealed an enrichment of mutations in loci that occur in a gas-1-centric region of the C. elegans interactome and could be classified into a small number of functional genomic categories. A highly nonrandom pattern of mitochondrial DNA mutation was observed within high-fitness gas-1 lines, with parallel fixations of nonsynonymous base substitutions within genes encoding NADH dehydrogenase subunits I and VI. These mitochondrial gene products reside within ETC complex I alongside the nuclear-encoded GAS-1 protein, suggesting that rapid adaptation of select gas-1 recovery lines was driven by fixation of compensatory mitochondrial mutations.
OWING to the evolutionary history of the nuclear DNA (nDNA) and mitochondrial DNA (mtDNA) genomes, the most critical function of mitochondria—production of ATP via oxidative phosphorylation—relies upon the interaction of nDNA- and mtDNA-encoded protein subunits that form the mitochondrial electron transport chain (ETC). Because most ETC components are subject to this dual genetic control, maintenance of favorable mitonuclear epistatic interactions is key to proper mitochondrial functioning (Rand et al. 2004; Harrison and Burton 2006; Dowling et al. 2007, 2008; Azevedo et al. 2009; Arnqvist et al. 2010; Montooth et al. 2010; Lane 2011). Evidence of tight coevolution between the nDNA- and mtDNA-encoded subunits is provided by cases of “mitonuclear mismatch,” wherein hybrid lineages experience ETC deficiencies and reduced fitness (Shoubridge 2001; Rawson and Burton 2002; Sackton et al. 2003). How this genomic coevolution is maintained given the radically different population biologies, and baseline mutational rates and processes (Denver et al. 2000), experienced by nDNA and mtDNA is not well understood. In particular, many features of mitochondrial biology would appear to promote high rates of deleterious mutation accumulation compared to the nuclear genome, including: maternal inheritance and no or infrequent recombination leading to reduced effective population size (Ne) (Ballard and Whitlock 2004), and limited DNA repair [reviewed in Alexeyev et al. (2013)]. Support comes from comparative sequence analyses revealing high nucleotide substitution rates in mtDNA (Lynch 1996) and phylogenetic analyses suggesting that adaptive evolution in nDNA-encoded ETC genes has been accelerated to compensate for degradation of their mtDNA counterparts (Osada and Akashi 2012; Barreto and Burton 2013; Havird et al. 2015b). Such findings have helped to instill the notion that selection on mtDNA is too weak to avoid deleterious mutation accumulation, and have led to the formation of the nuclear compensation hypothesis (Burton et al. 2013; Havird and Sloan 2016), which posits that mitonuclear matching is maintained to a large extent by the nDNA genome.
The above studies support a model of mitonuclear coevolution in which all of the compensatory or adaptive changes occur in the nuclear genome; however, a recent analysis found no difference in the efficacy of purifying selection between mtDNA and nDNA genomes of flies and humans (Cooper et al. 2015). These results add to evidence for efficient purifying selection in mtDNA, particularly on genes encoding core ETC subunits (Bazin et al. 2006; Ellison and Burton 2006; Meiklejohn et al. 2007; Burton et al. 2013; Cooper et al. 2015). Theory also shows that the effect of uniparental inheritance [i.e., maintenance of high among-lineage variance in mutation load (Bergstrom and Pritchard 1998)] can prevent or retard mtDNA decay under most circumstances (Hadjivasiliou et al. 2013; Radzvilavicius et al. 2017). Finally, many features of mitochondria may favor genome integrity and efficient selection (Rand 2008), including life cycles involving fission, fusion, and autophagy that may purge damaged mtDNA genomes (Twig et al. 2008; Kuznetsov and Margreiter 2009; Kowald and Kirkwood 2011); multiple levels of selection (Rand 2001; Taylor et al. 2002); and mechanisms promoting oocyte-specific mtDNA stability (de Paula et al. 2013).
The mitochondrial ETC is an excellent system for addressing the roles and patterns of adaptive mutations responsible for maintaining mitonuclear integration. Here, we report the first direct, nonretrospective study of adaptive evolution of the mitochondrial ETC, applying an experimental genomics approach with a well-studied ETC-deficient strain of Caenorhabditis elegans nematodes, gas-1. The study builds upon our previous work describing mitochondrial heteroplasmy (Wernick et al. 2016), and patterns and phenotypic consequences of nuclear mutations (Christy et al. 2017) accumulating under drift within the same strain. The goal of the present study was to understand the capacity of new mutations to restore ancestral levels of fitness and phenotypes within replicate lineages of gas-1 nematodes experimentally evolved under conditions of efficient selection; i.e., large Ne. With large Ne, selection is generally more efficient at both purging deleterious mutations and fixing beneficial mutations. Still, only a small fraction of newly arising beneficial mutations will achieve fixation within populations; the asymptotic probability is equivalent to twice the selection coefficient when population size is large. Similarly, large populations are not immune to deleterious mutation accumulation, especially if mutation rates are high and individual mutational effects are small. Mutations with effects <<1/(2Ne) are expected to be governed exclusively by random genetic drift, causing them to accumulate at close to the neutral rate [see chapter 3 in Kimura (1983)]. However, previous results from our group and others are consistent with the selective effects of the majority of novel deleterious and beneficial mutations being sufficiently large for their frequencies to be efficiently shaped by selection (Estes et al. 2004; Denver et al. 2010; Phillips et al. 2015; Konrad et al. 2017). How these competing evolutionary forces operate on nuclear and mitochondrial mutations to yield an adaptive mitonuclear response is an ideal question for the application of an experimental evolution approach.
Here, we report results of a “recovery experiment” [compare with Estes and Lynch (2003)] wherein replicate lines of a gas-1 ETC mutant ancestor were maintained in large population sizes (1000-individual bottlenecks), with efficient natural selection prior to phenotyping and whole-genome sequence analysis for mutation detection. Surprisingly, between generations 20 and 30 of the experiment, we noted that several gas1 recovery (RC) line populations contained appreciable frequencies (up to what appeared to be ∼50%) of males, a pattern that persisted throughout the experiment. C. elegans is an androdiecious species, with populations normally comprising self-fertilizing hermaphrodites (XX) and extremely rare males (hemizygous, X0) with whom hermaphrodites can outcross. Outcrossed offspring exhibit 50:50 sex ratios, but males are rapidly lost from populations under most circumstances (Anderson et al. 2010). This observation presented the opportunity to compare evolution under selfing vs. outcrossing.
Materials and Methods
Strains
Twenty-four RC lines were generated from a C. elegans gas-1 mutant previously utilized for an mutation-accumulation (MA) study (Wernick et al. 2016; Christy et al. 2017). The C. elegans gas-1 gene is nuclear-encoded and orthologous to human NDUFS2 (83% protein similarity); it encodes a core subunit of ETC complex I, which helps to form the quinone-binding pocket (Vasta et al. 2011; Shiraishi et al. 2012). The gas-1(fc21) allele is a single-base pair missense mutation (Kayser et al. 1999) associated with deleterious phenotypes including reduced fecundity, reduced complex I-dependent metabolism (Kayser et al. 2004), hypersensitivity to oxidative stress owing to increased reactive oxygen species (ROS) production (Kayser et al. 2001, 2004), and low ATP levels relative to wild-type (Lenaz et al. 2006). The original gas-1 mutant, derived from ethyl methanesulfonate (EMS) mutagenesis (Kayser et al. 1999), was obtained from the Caenorhabditis Genetics Center (University of Minnesota) and backcrossed to Bristol N2 for 10 generations in an attempt to create an isogenic mutant strain. Both strains are expected to be homozygous at all loci. The resulting gas-1 strain, referred to hereafter as gas-1 G0, was allowed to recover from freezing for two generations at 20° on Nematode Growth Medium-Lite (NGML) plates seeded with Escherichia coli OP50-1. RC lines were initiated with 24 randomly chosen L4-stage offspring from a single gas-1 G0 parent; the lines were then passaged in large population sizes (N = 1000) for 60 generations, a timescale sufficient for fitness recovery in other mutant strains (Estes et al. 2011). Transfer population sizes were estimated via sample egg counts and nonoverlapping generations were maintained by standard age synchronization of cultures prior to each transfer. Samples of each RC line were frozen at five-generation intervals.
Prior to all phenotypic experiments, strains were allowed to recover from freezing for two-to-three generations at 20° on NGML plates containing 20 μg/ml streptomycin and E. coli OP50-1. For the ROS and nondisjunction assays, lines were age-synchronized by standard bleach treatment prior to each assay.
Conventional fitness assay
Daily offspring production and life span were assayed for N2, gas-1 G0, and the generation-60 gas-1 RC lines following established methods (Estes and Lynch 2003). One adult hermaphrodite from each of five replicates was transferred to an individual plate to lay eggs for 5 hr, creating an age-synchronous cohort. One offspring from each parent was then transferred to an individual plate, resulting in a total of five individuals from each gas-1 RC line, and 9–10 individuals each of N2 and gas-1 G0 control(s) or lines assayed. The number of unhatched and presumably inviable eggs were also counted. Life span was calculated as days lived from the egg stage; survival rates were calculated from the same data set. Eight worms died due to desiccation after crawling up the side of Petri plates and were omitted from analysis. Data were used to calculate mean absolute (total reproductive output, W) and relative fitness (ω) of the gas-1 G0 mutant compared to N2, and of each gas-1 RC line compared to the gas-1 G0 ancestor. Relative fitness of each individual was computed as: ω = Σe−rxl(x)m(x), where l(x) is the number of worms surviving to day x, m(x) is the fecundity at day x, and r is the mean intrinsic population growth rate of the assay-specific N2 or gas-1 control as appropriate. The latter was calculated by solving Euler’s equation for r from the equation ω = Σe−rxl(x)m(x) = 1 using an average value of l(x)m(x) for the controls. We set x = 4.75 on the first reproductive day [compare with Vassilieva et al. (2000)].
Competitive fitness assay
We also performed competitive fitness assays following the methods of Morran et al. (2009) on a subset of 14 RC lines chosen to represent two fitness classes revealed by the above conventional assays. These assays more closely simulate the environment in which the worms were experimentally evolved, thereby allowing us to avoid potential genotype-by-environment interactions. Assays were conducted in two blocks to obtain a total of two-to-eight replicates of RC lines (with a goal of five) and five replicates of gas-1 G0. Competitions began by mixing roughly equal numbers of age-synchronized L4 RC individuals with L4 GFP-marked tester strain (JK2735) individuals on E. coli-seeded plates. The goal was to plate 500 individuals of each strain; however, actual experimental numbers ranged from 402 to 666 individuals. The two strains were allowed to compete (and to mate if experimental males were present) and the resulting L4 offspring were counted after three generations. The assay followed the same passaging protocol used in recovery, including age synchronization, as described above. GFP- = expression is dominant in the tester strain, meaning that fitness would be underestimated for the experimental lines, or the gas-1 G0 or N2 control strain, if outcrossing occurred. Care was therefore taken to ensure that no tester males were included in the competition assays. After three generations of passage, the ratio of non-GFP-marked experimental or control offspring to GFP-marked offspring was calculated for each replicate. These ratios were used to gauge competitive fitness of the RC lines, and the N2 and gas-1 G0 strains, relative to each other.
Life history data analysis
Differences between gas-1 G0 and N2 life history trait means and variances were previously reported from a separate data set (Christy et al. 2017); we also calculated mean trait differences between the two strains from the current data set using two-way Student’s t-tests. Trait differences between gas-1 RC lines and gas-1 G0 were evaluated with two-way mixed-model ANOVAs: y = strain + line(strain) + ε, with strain—gas-1 G0 or gas-1 RC as a fixed effect, and line(strain) (each RC line nested within gas-1 RC) as a random effect using the expected mean squares method as applied in JMP12 (SAS). We compared the mean trait values for each RC line with the ancestral gas-1 G0 using Dunnett’s method. For the RC lines, within- and among-line components of variance were calculated using restricted maximum likelihood as applied in JMP12 (SAS), while restricting variance estimates to be positive. We tested the model: y = µ + RC line + ε, wherein RC line is a random effect and represents among-line variance and ε represents the within-line component of variance. A frequency distribution of gas-1 RC line fitness relative to gas-1 G0 was created using least squares means for the gas-1 RC lines derived from the line(strain) term above. We calculated Spearman’s rank correlation coefficients to evaluate the relationship between line-specific mean relative and competitive fitness measures.
Male frequency, outcrossing, and nondisjunction assays
Because increased frequencies of males were noted in several RC lines around generation 20–30 of the 60-generation experiment, we assayed male frequency for all such gas-1 RC lines, and on additional gas-1 RC lines representing a mix of lower- and higher-fitness classes (for a total of 16 RC lines), along with gas-1 G0 and N2 wild-type worms, following the methods of Denver et al. (2010). To test whether RC line males were a result of increased instances of X chromosome nondisjunction leading to the X0 male karyotype, nondisjunction assays were performed on the same lines. Males and hermaphrodites were counted on six replicate plates containing roughly 200 (range: 107–612) age-synchronized young adult offspring of 10–20 unmated hermaphrodites. Average male to hermaphrodite proportions were then calculated for each gas-1 RC line, gas-1 G0, and N2.
To understand whether the evolution of male frequency translated into increased rates of outcrossing or altered mating ability, a small number of crosses were conducted between RC line hermaphrodites and N2 males. Reciprocal crosses (RC line males × N2 hermaphrodites), and crosses between gas-1 G0 males and RC line hermaphrodites, were attempted, but were largely unsuccessful owing to difficulty in recovering males from previously frozen RC lines and the ancestral mutant. Matings were arranged by pairing single RC line hermaphrodites with single N2 males; the number and sex of the resulting offspring were then assayed. Outcrossing rates were determined by 2(m−μ), where m is the frequency of the male offspring and μ is the rate of X chromosome nondisjunction [modified from equation 3 in Stewart and Phillips (2002)].
We tested a total of 10 RC lines, with five randomly selected from lines that either evolved high male frequency and fitness (RC3, RC9, RC12, RC18, and RC24), or not (RC2, RC8, RC11, RC16, and RC23). For logistical reasons, crosses were not replicated within RC lines. Data were therefore analyzed by grouping RC lines into male and no-male groups. Four replicate N2 male-gas-1 G0 hermaphrodite crosses were included as a control.
Steady-state ROS levels
In vivo steady-state ROS levels were quantified for a subset of four gas-1 RC lines, representing a mix of high- and low-fitness classes alongside those of N2 and gas-1 G0 controls, using our previously established fluorescence microscopy methods (Joyner-Matos et al. 2011; Hicks et al. 2013; Smith et al. 2014) and a Zeiss ([Carl Zeiss], Thornwood, NY) Axio Imager M2 with monochrome Axiocam 506 camera (Advanced Light Microscopy Core, Oregon Health and Science University, Portland, OR). Two imaging blocks were completed with ∼20 worms labeled with MitoSOX Red mitochondrial superoxide indicator (Molecular Probes, Eugene, OR), and five untreated control worms from each RC line and ancestral control strain were imaged at each session.
Illumina HiSeq read mappings and analyses
Whole-genome sequencing was conducted for all 24 RC lines with pooled samples prepared from thousands of first larval (L1)-stage nematodes collected from multiple hermaphrodites; these hermaphrodites were the offspring of a single individual collected from each RC line as previously described (Wernick et al. 2016). Restricting genome analyses to L1-stage animals allows us to avoid sampling many mtDNA heteroplasmies that may accumulate in somatic tissues with nematode age. However, the need to sequence pooled samples to have sufficient template DNA prevents us from distinguishing between true heteroplasmy; i.e., multiple mitotypes segregating within an individual, from variation segregating among individuals. Following each Illumina HiSeq run, reads were aligned to the C. elegans genome (version WS242) using CLC Genomics Workbench (CLC Bio/QIAGEN, Valencia, CA). All reads were end-paired (2 × 150 bp) and mapped using the following parameters: no masking, mismatch cost = 2, insertion cost = 3, deletion cost = 3, length fraction = 0.98, 75 read fraction = 0.98, global alignment = no, nonspecific match handling = map randomly (Supplemental Material, Table S1). This procedure was previously performed for the gas-1 G0 progenitor and N2 wild-type control for an in-depth genetic comparison of the two strains (Wernick et al. 2016).
Bioinformatic analyses of mtDNA copy number
mtDNA copy number was normalized by nuclear DNA (nDNA) content as described in Wernick et al. (2016). Because samples for sequencing were run on the same lane, among-line variation in mtDNA copy number due to variable sequencing coverage should be negligible. Relative mtDNA for each line was calculated as the line-specific average mtDNA coverage divided by the line-specific average coverage of three single-copy nuclear genes: ama-1, ego-1, and efl-2. The AT-rich region of the mitochondrial genome was not considered due to inconsistencies during sequencing created by its repetitive nature.
We tested normalized mtDNA copy number data for normality and variance using Levene’s test. We applied a Kruskal–Wallis H test with strain as an explanatory variable to evaluate whether there was a statistically significant increase in mtDNA copy number following evolution in large population sizes. Kruskal multiple comparison post hoc tests were applied to evaluate the significance of normalized mtDNA copy number among pairwise comparisons of all lines.
Identification of mtDNA single-base substitutions
Potential line-specific mtDNA variant sites were identified as mitochondrial genome positions differing from the C. elegans reference genome (WS242) and not present within our wild-type N2 lab strain. Site-specific variant frequency was calculated by dividing the number of variant calls by the total site coverage. To eliminate false positives resulting from sequencing and PCR artifacts, variants were required to have at least six variant calls, a variant frequency above 2%, and be within two SD of the line-specific per-site mean coverage. We obtained frequency values of the variant nucleotide for all such sites identified in each RC line, gas-1 G0, and N2. To control for HiSeq3000 error, we conducted subsequent analyses that took into account the probability that the HiSeq3000 erroneously recorded a variant base call.
Identification and characterization of gas-1 RC line nuclear mutations
Candidate SNPs within the nuclear genomes of gas-1 RC lines were identified as variants from the C. elegans reference genome (WS242) and our wild-type N2 lab strain, as previously described in Wernick et al. (2016). To eliminate false positives resulting from PCR and sequencing artifacts, the following criteria were applied: (1) at least fivefold coverage, (2) 100% of reads indicated a single nonreference base (i.e., the mutation was fixed within the population), (3) at least one read present from both the reverse and forward strand, and (4) reads in a given direction varied upon start/end positions. We only considered mutations found in a single line to eliminate false positives associated with cryptic heterozygosity or paralogy following our previous approaches (Denver et al. 2009, 2012).
Gene ontology enrichments
Following our previous methods (Christy et al. 2017), gene ontology (GO) enrichments were calculated using GoMiner (Zeeberg et al. 2003) application build 457 and the GO MySQL Database (MySQL 3.7.13; Oracle Corporation, Cupertino, CA; GO database build 2016-06-07, geneontology.org) for all nuclear DNA SNPs that arose within protein-coding regions of gas-1 RC lines within three functional domains: biological process, cellular component, and molecular function. We then determined which broader-level functional “GO slim” categories, as defined by the GO Consortium (Version 1.2, 2012-09-21, geneontology.org), were enriched using CateGOrizer (Hu et al. 2008). CateGOrizer classifies enriched GO terms into their respective GO slim categories, giving a coarser-scale overview of enrichment patterns. GO slim categories were checked against the GoMiner output to assess statistical significance.
Interactome analysis of gas-1 RC line mutations
Following our previous approaches (Denver et al. 2010; Christy et al. 2017), GeneOrienteer version 2.25 (Zhong and Sternberg 2006) was used to construct an interactome, the complete list of all genes predicted to interact with the gas-1 gene, and to determine the extent to which mutated RC line genes showed membership within this network. Specifically, GeneOrienteer calculates log-likelihood ratio scores for pairwise combinations of C. elegans genes based on numerous underlying feature data sources (yeast two-hybrid experiments, microarray data, etc.) from C. elegans, Drosophila melanogaster, and Saccharomyces cerevisiae. As before in Christy et al. (2017), we refer to the comprehensive list of first- and second-degree gas-1-interacting genes as the “gas-1-centric-interactome.” We then identified all genic single-base pair substitution mutations within gas-1 RC line nuclear and mitochondrial genomes found in genes residing within the gas-1-centric interactome.
Data availability
Nematode strains are available upon request. Supplemental figures show the following: Figures S1 and S2: relative and competitive fitness of gas-1 RC lines, respectively; Figure S3: normalized mtDNA copy number for all C. elegans lines; Figure S4: expected and observed percentages of gas-1 RC line genic mtDNA mutations; Figure S5: chromatograms depicting evolutionary trajectories of two mtDNA variants; Figure S6: GO enrichments and interactome results for gas-1 RC line mutations; and Figure S7: GO term categorizations for gas-1 RC line SNPs. Supplemental tables contain the following data: Table S1: Illumina HiSeq run statistics; Table S2: ANOVA results for C. elegans life history traits; Table S3: results of mtDNA copy number normalization; Table S4: gas-1 G0 mutations reverted to wild-type alleles within RC lines; Table S5: mtDNA SNPs; Table S6: nDNA SNPs; and Table S7: gas-1 RC line SNPs occurring within the gas-1 interactome. File S1 shows the frequencies within each gas-1 RC line for all mtDNA positions in which a variant was identified; File S2 shows the frequencies within each gas-1 MA line for the fox-1 single-base pair reversion discovered within three gas-1 RC lines; File S3 contains custom code for simulations reported in Figure S5; and File S4 contains a complete accounting of gas-1 RC G0 enrichment results. Illumina whole-genome sequence data have been deposited to the Sequence Read Archive database under accession number PRJNA490381. Supplemental material available at Figshare: https://doi.org/10.25386/genetics.7609925.
Results
Evolution of male frequency and bleach resistance during recovery
Approximately midway through the 60-generation evolution experiment, we noted that 6 of the 24 replicate RC lines (RC3, RC8, RC9, RC12, RC18, and RC24) began to generate appreciable numbers of males, atypical of this androdiecious species. Males of each of these lines were observed in active copulation with hermaphrodites, suggesting the occurrence of successful outcrossing. We found no significant rates of X chromosome nondisjunction in any of the gas-1 RC lines, or gas-1 G0 and N2 controls. Male frequency assays revealed that only two gas-1 RC lines, RC9 and RC17, showed statistically significant—although extremely small—increases compared to gas-1 G0 (Dunnett’s test, α = 0.05); a major caveat to this finding is that the lines had been frozen prior to assay, and it is notoriously difficult to recover C. elegans males after freezing. Thus, although the true frequencies of males being maintained in the gas-1 RC lines was higher than reflected by these assays, we can be confident that increased male frequency was not due to increased rates of chromosome nondisjunction in select RC lines. Finally, two of the 24 lines, RC20 and RC22 (neither noted to be male generating), became resistant to the bleach treatments required for age synchronization prior to each transfer; these lines required longer bleach treatment to harvest eggs for the next generation. This evolution did not affect the time between transfers or the total number of generations of evolution achieved for these lines.
Evolution of outcrossing
Mating assays found substantial differences in mating abilities among G0 control, no-male, and high-male RC groups (F2,13 = 11.32, P = 0.002). This result was driven by higher outcrossing rates for high-male RC lines compared to no-male RC lines and gas-1 G0 (Tukey’s HSD, α = 0.05). Mean outcrossing rates (± 1 SEM) were 0.195 (0.057) for the N2 × gas-1 G0 control cross, 0.434 (0.051) for high-male RC lines × N2, and 0.099 (0.051) for no-male RC lines × N2. The average fraction of male offspring (± 1 SEM) from the same crosses—expected to be 50% with all outcross progeny—mirrored the outcrossing results with 0.098 (0.029) for N2, 0.217 (0.026) for high-male, and 0.050 (0.026) for no-male RC lines. The total number of offspring produced by each strain and RC line in these assays corresponded to the results of the conventional fitness assays. During these experiments, we also observed that hermaphrodites from no-male RC lines demonstrated a high latency to mate compared to hermaphrodites from high-male RC lines. The few successful crosses conducted between gas-1 G0 males and RC line hermaphrodites were consistent with this result not being a consequence of N2 male mating strategy; no-male RC line hermaphrodites were poor outcrossers regardless of male strain.
Life history evolution of gas-1 RC lines
After 60 generations of evolution in large, nonoverlapping populations, neither absolute fitness, W, nor relative fitness of the gas-1 RC lines improved significantly over gas-1 G0 on average (Table 1 and Table S2). However, there was significant among-RC line variability in evolutionary response (Figure 1, Figure 2, and Figure 3), with two distinct classes of lines emerging: a low-fitness class whose reproductive schedule was still similar to that of gas-1 G0 after 60 generations and a high-fitness class (Figure 1). Seven lines (RC3, RC8, RC9, RC10, RC13, RC20, and RC22) had significantly higher W than gas-1 G0 (Dunnett’s test, P < 0.05). The same lines, in addition to RC12 and RC18, had significantly higher fitness relative to gas-1 G0. The gas-1 RC lines showing significant improvements for absolute and relative fitness largely overlap those noted as generating appreciable numbers of males (Figure 1) or evolving bleach resistance. No RC lines in the lower-fitness class were noted to contain males. There was no difference among mean N2, gas-1 G0, or gas-1 RC line life span; however, there was a weakly significant tendency for high-male lines to live longer than no-male lines (Table 1). Finally, there were no significant differences, either between strains (gas-1 RC vs. gas-1 G0) or among gas-1 RC lines, in the presence of unhatched eggs, or the prevalence of “bagging” (internal hatching of eggs), even when the presence of males was taken into account (Table 1).
Means for life history traits for N2, gas-1 G0, and gas-1 RC
| Controls | gas-1 RC | gas-1 RC by males | |||||||
|---|---|---|---|---|---|---|---|---|---|
| Character | N2 | gas-1 G0 | t statistic | P-value | All | Yes | No | t statistic | P-value |
| Total reproduction | (9) 210.7 ± 18.91 | (10) 64.20 ± 11.97 | 6.688 | < 0.0001 | (113) 131.0 ± 6.278 | (28) 162.9 ± 12.53 | (85) 120.5 ± 6.921 | 3.024 | 0.0031 |
| Life span | (9) 14.56 ± 2.082 | (10) 15.20 ± 1.306 | 0.268 | 0.792 | (113) 15.28 ± 0.500 | (28) 17.11 ± 1.131 | (85) 14.68 ± 0.539 | 2.126 | 0.0357 |
| Fitness relative to N2 | (9) 1.000 ± 0.117 | (10) 0.095 ± 0.021 | 8.015 | < 0.0001 | (113) 0.290 ± 0.027 | (28) 0.400 ± 0.039 | (85) 0.254 ± 0.033 | 2.333 | 0.0214 |
| Fitness relative to gas-1 G0 | (9) 7.026 ± 0.736 | (10) 1.000 ± 0.195 | 8.305 | < 0.0001 | (113) 2.584 ± 0.196 | (28) 3.541 ± 0.300 | (85) 2.269 ± 0.232 | 2.891 | 0.0046 |
| Unhatched eggs | (9) 1.222 ± 0.401 | (10) 4.000 ± 1.333 | 1.903 | 0.0741 | (113) 1.973 ± 0.193 | (28) 1.571 ± 0.269 | (85) 2.106 ± 0.240 | 1.199 | 0.2333 |
| Bagging | 3/9 | 1/10 | — | 0.3034 | 44/113 | 8/28 | 36/85 | — | 0.2645 |
Sample sizes are shown in parentheses; other values are means ± 1 SEM. Two-tailed Student’s t-test statistics and associated P-values are shown comparing gas-1 G0 and N2, and male RC lines with no-male RC lines. Bagging denotes the fraction of bagging hermaphrodites. Fisher’s exact test P-value reported comparing gas-1 G0 and N2, and male RC lines with no-male RC lines for this trait. RC, recovery.
| Controls | gas-1 RC | gas-1 RC by males | |||||||
|---|---|---|---|---|---|---|---|---|---|
| Character | N2 | gas-1 G0 | t statistic | P-value | All | Yes | No | t statistic | P-value |
| Total reproduction | (9) 210.7 ± 18.91 | (10) 64.20 ± 11.97 | 6.688 | < 0.0001 | (113) 131.0 ± 6.278 | (28) 162.9 ± 12.53 | (85) 120.5 ± 6.921 | 3.024 | 0.0031 |
| Life span | (9) 14.56 ± 2.082 | (10) 15.20 ± 1.306 | 0.268 | 0.792 | (113) 15.28 ± 0.500 | (28) 17.11 ± 1.131 | (85) 14.68 ± 0.539 | 2.126 | 0.0357 |
| Fitness relative to N2 | (9) 1.000 ± 0.117 | (10) 0.095 ± 0.021 | 8.015 | < 0.0001 | (113) 0.290 ± 0.027 | (28) 0.400 ± 0.039 | (85) 0.254 ± 0.033 | 2.333 | 0.0214 |
| Fitness relative to gas-1 G0 | (9) 7.026 ± 0.736 | (10) 1.000 ± 0.195 | 8.305 | < 0.0001 | (113) 2.584 ± 0.196 | (28) 3.541 ± 0.300 | (85) 2.269 ± 0.232 | 2.891 | 0.0046 |
| Unhatched eggs | (9) 1.222 ± 0.401 | (10) 4.000 ± 1.333 | 1.903 | 0.0741 | (113) 1.973 ± 0.193 | (28) 1.571 ± 0.269 | (85) 2.106 ± 0.240 | 1.199 | 0.2333 |
| Bagging | 3/9 | 1/10 | — | 0.3034 | 44/113 | 8/28 | 36/85 | — | 0.2645 |
Sample sizes are shown in parentheses; other values are means ± 1 SEM. Two-tailed Student’s t-test statistics and associated P-values are shown comparing gas-1 G0 and N2, and male RC lines with no-male RC lines. Bagging denotes the fraction of bagging hermaphrodites. Fisher’s exact test P-value reported comparing gas-1 G0 and N2, and male RC lines with no-male RC lines for this trait. RC, recovery.
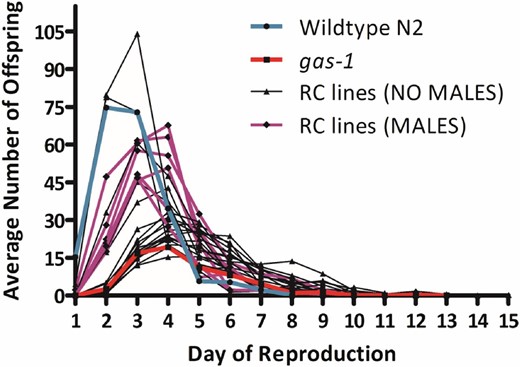
Reproductive schedules of gas-1 recovery (RC) lines. Average daily productivity of G60 gas-1 RC lines alongside that of their gas-1 ancestor (red line) and wild-type N2 (blue line) controls. The six RC lines that evolved appreciable frequencies of males are highlighted in purple. Line RC10 and the bleach-resistant line, RC22, exceeded wild-type peak reproduction.
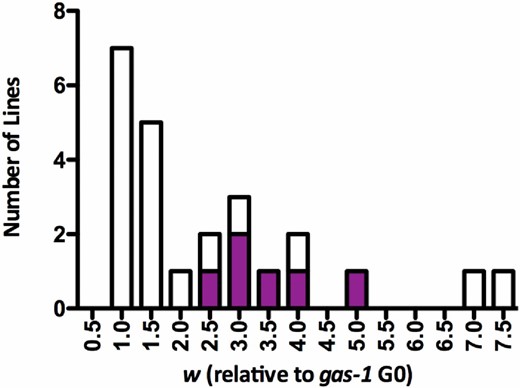
Frequency histogram of gas-1 recovery (RC) line relative fitness. Histogram of the 24 gas-1 RC lines’ fitness (w) relative to gas-1 G0 (equal to 1.0). Filled portions of bars indicate contribution of male-containing RC lines.
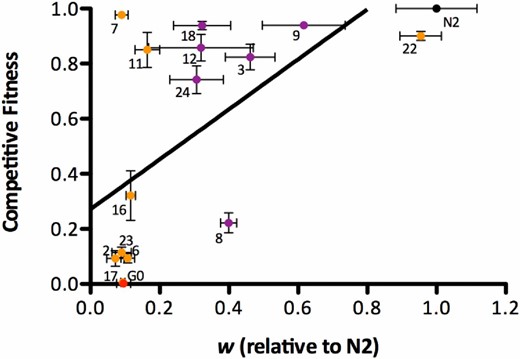
Relationship between relative and competitive fitness. Data points represent a subset of gas-1 recovery (RC) lines along with gas-1 G0 (red symbol) assayed for fitness relative to N2 (black symbol) and competitive fitness with a GFP-marked strain. Orange symbols indicate gas-1 RC lines without evidence for males; purple symbols indicate gas-1 RC lines in which the presence of males was noted (note that RC10 was not among the lines sampled for competitive fitness assays; Figures S1 and S2 show complete data for relative and competitive fitness, respectively). Error bars = 1 SEM. The black line indicates the best-fit line of the data using standard least squares regression. where y is competitive fitness and x is relative N2 fitness: y = 0.819(x) + 0.286 (F1, 14 = 8.192, P = 0.0125, nonsignificant intercept).
Comparison of relative and competitive fitness
Mean levels of relative and competitive fitness of individual strains were positively correlated (Spearman’s ρ = 0.6294, P = 0.0090), although the distribution of competitive fitness values was rather bimodal, failing to distinguish strains to the same extent as relative fitness (Figure 3, and Figures S1 and S2). The gas-1 G0 control performed worse than all but one gas-1 RC line tested in competition against the GFP-marked strain, while N2 performed best. No strain outcompeted the GFP-marked strain, although eight RC lines competed at levels > 70% of the GFP tester strain. The gas-1 RC lines noted as generating high frequencies of males (Figure 3, purple symbols) tended to perform better in both types of fitness assays than those without males, but performed especially well in the competitive fitness assays. With two exceptions (RC7 and RC11), most lines scoring low on relative fitness cluster about the origin, suggesting that differences in strain performance in the two types of assays are mainly realized for lines expressing higher relative fitness.
Evolution of ROS levels
As previously observed (Christy et al. 2017), gas-1 G0 exhibited significantly higher ROS levels than N2 (Figure 4). Of the four gas-1 RC lines assayed, ROS levels were significantly reduced compared with gas-1 G0 and mostly statistically indistinguishable (although mostly lower) than wild-type levels. Line RC2, which exhibited higher ROS levels than the other RC lines, scored far lower in both relative and competitive fitness assays than the other lines assayed.
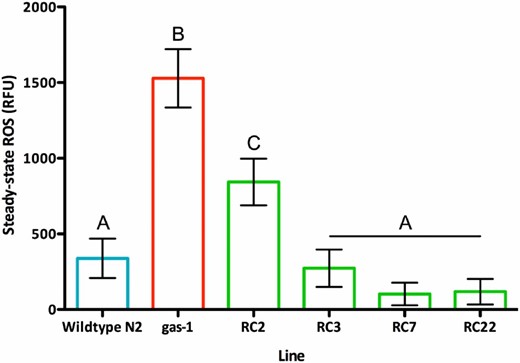
Steady-state reactive oxygen species (ROS) levels. ROS levels (mean ± 1 SEM) for N2 (338.7 ± 127.0), gas-1 G0 (1527.8 ± 154.4), and four selected recovery (RC) lines at generation 60 of recovery: RC2 (843.6 ± 117.1), RC3 (273.7 ± 125.2), RC7 (102.7 ± 105.8), and RC22 (118.8 ± 128.9). Lines differed with regard to ROS (F5,208 = 16.01, P < 0.0001); gas-1 G0 had significantly higher ROS content than N2 and the four gas-1 RC lines (Tukey’s honest significant difference, α = 0.05). Error bars = 1 SEM and letters label statistically indistinguishable groups. RC2 and RC7 were members of the lower-relative fitness class, although RC7 scored high in competitive fitness. RC22 and RC3 were members of the higher-fitness class (Figure 1). RC22 evolved bleach resistance; RC3 evolved high-male frequency. RFU, relative fluorescence unit.
Changes in mtDNA copy number
As previously reported from an independent data set (Wernick et al. 2016), relative mtDNA copy number (mtDNA coverage normalized by coverage at single-copy nuclear regions) was not different between the N2 and gas-1 progenitor strains (120.6× and 128.2×, respectively). A Levene’s test determined the gas-1 RC lines had unequal variance (F23 = 1.9838, P < 0.0001) with respect to mtDNA copy number (Figure S3 and Table S3). Using normalized mitochondrial DNA coverage for 12 mitochondrial genes and two ribosomal sequences in N2, gas-1 G0, and the 24 RC lines, the analysis determined that strain was a significant factor (Kruskal–Wallis H = 288.72, P < 0.0001). Kruskal multiple comparison post hoc tests evaluated the significance of normalized mtDNA copy number among pairwise comparisons of all lines. Five of the 24 gas-1 RC lines showed significant increases in relative mtDNA copy number compared to gas-1 G0—RC7, RC8, RC9, RC10, and RC11—while the remaining 19 lines showed no difference. The average normalized mtDNA copy number of gas-1 RC lines was 157.7×, ∼1.23 times higher than gas-1 G0. Coverage patterns across sites were consistent among lines (Figure S3), indicating that complete mitogenome copy number had increased rather than isolated sections of the mitochondrial genome.
Reversion of background mutations in gas-1 G0
As previously described, bioinformatic analysis of our gas-1 G0 strain revealed the presence of 76 mutations in addition to the gas-1(fc21) mutant allele compared to our N2 lab reference strain, even following 10 generations of backcrossing to N2 [Table S2 in Christy et al. (2017)]. The majority of these were G: C→A: T transitions, consistent with the original gas-1 mutant having been derived from an EMS mutagenesis screen. The X-chromosome (where gas-1 is located) harbored the majority, 62%, of such mutations. While all 76 background mutations were retained within the previously analyzed gas-1 MA lines derived from gas-1 G0 (Christy et al. 2017), we discovered that four of these 76 mutations had reverted to the wild-type allele within individual generation-60 RC lines (Table S4). There were no reversions of the ancestral gas-1(fc21) allele. Three of these SNPs were reverted in three different RC lines, each belonging to the lower-fitness class and not noted to have high male frequency. These included substitutions in introns of genes residing on chromosomes V and X (Y17D7C.2 and ceh-37, respectively), and a synonymous substitution in the emc-2 gene of chromosome II. None of these genes have known involvement in sex determination, dosage compensation, chromosome dynamics, or mating behavior. Interestingly, the fourth mutation, residing within an intron of the fox-1 gene, reverted to the wild-type nucleotide in three RC lines (RC3, RC12, and RC24), belonging to the higher-fitness class of RC lines and noted as having evolved high male frequency during the experiment. Fox-1, distantly located (> 13 Mb) from gas-1 on the X chromosome, is an RNA-binding protein involved in early-embryo dosage compensation and male mating behavior (Skipper et al. 1999).
mtDNA single-base substitutions
A total of 392 mtDNA single-base pair variants were identified, the majority (n = 317) of which were located within the AT-rich region (∼13,327–13,794 bp) and had low coverage (1–3×) of the variant nucleotide. Another 59 variants failed to meet the required coverage for the candidate site and/or the variant nucleotide (6×). After filtering, 16 candidates remained. Three of the 16 were identified within our N2 lab strain (i.e., differences between our lab strain and the N2 reference), while 13 unique mutations were distributed among gas-1 RC lines (Table S5). A review of the mtDNA positions in which one of these 13 unique mutations was identified revealed no convincing evidence of their existence within N2, other RC lines, or previously analyzed gas-1 MA lines. Specifically, frequencies of the base calls for these mutations within other RC lines (File S1) and previously analyzed gas-1 MA lines (File S2) mostly fall < 0.001, far below what we would consider to be indicative of a candidate mutation rather than a result of sequencing error, estimated at 0.1% for Illumina HiSeq (Fox et al. 2014). If any of these variants is real, it is also possible that they reflect somatic variants segregating in one or two individuals in the sequenced population. Of the 13 RC line-specific mutations, four were present at levels of > 99% in the sample and were thus likely to be homoplasmic; the remaining were variable, detected at levels ranging from 2.5 to 95%. Three RC lines (RC3, RC13, and RC19) contained two substitutions each; the other seven contained single substitutions. Apart from two substitutions, one each in a tRNA and an rRNA gene, variants were discovered within protein coding genes (Figure S4 and Table S5). All but two were amino acid replacing. Figure S4 shows the observed percentage of RC line mutations discovered in nduo-6 and nduo-1, which exceed three and two SD of the mean expected percentages, respectively (see File S3 for simulation code). Notably, RC lines containing mtDNA mutations exhibited considerable parallel evolution. Lines RC5 and RC22 acquired the same nonsynonymous substitution within the nduo-1 gene, while lines RC13, RC18, and RC24 acquired the same nonsynonymous substitution within the nduo-6 gene. Except for that in RC5, these changes were nearly or completely homoplasmic (Table S5).
An extremely rough estimate of the number of times we could expect any particular mitochondrial site to be mutated (not fixed for a new substitution) in our experiment is given by: the C. elegans mitochondrial base substitution mutation rate (4.32 × 10⁻⁸ per site per generation; Konrad et al. 2017) × the approximate Ne for the RC line mitochondria (62,000) × the number of generations of evolution (60) × the number of experimental lines (24) = 3.856, matching the number observed for the G→T substitution at position 227 of the nduo-6 locus (Table S5). The true Ne for this experiment is difficult to judge; however, the chance of multiple independent observations of a particular mutation is far more likely in the mitochondrial than in the nuclear genome owing to the higher mutation rate and Ne of mtDNA, with the latter estimated at 62 for C. elegans (Konrad et al. 2017). This calculation suggests that parallel mtDNA evolution is well within the realm of possibility. Furthermore, transgenerational PCR surveys of two RC line base substitutions (the G→T change in the nduo-1 gene of RC18 and the C→T change in the nduo-6 gene of RC22; Figure S5) show the trajectory of each mutation through a period of heteroplasmy or polymorphism (i.e., both mutant and wild-type bases present in the sequenced population of scores of L1 offspring collected directly from frozen RC line stocks) toward eventual fixation.
gas-1 RC line nuclear mutations
Nuclear mutations in the 24 sequenced gas-1 RC lines were identified and bioinformatically characterized as before (Christy et al. 2017). A total of 111 nuclear genome SNPs was detected; of these, 28 occurred in introns, 18 in exons, 62 mutations were intergenic, and 3 occurred in pseudogenes (Table S6). Of the 18 exonic SNPs, 7 were synonymous and 11 were nonsynonymous. RC line-specific mutation numbers ranged from 1 (in RC14, RC15, and RC21) to 11 (in RC13). As observed for both gas-1 MA lines (Christy et al. 2017) and N2 MA lines (Denver et al. 2012), G:C → A:T transitions were the most common substitution type encountered in gas-1 RC lines (36/111), followed by A:T → T:A transversions. The rank order of the remaining four mutation types was also comparable between gas-1 RC and published MA values, with the least common mutation events—9/111—being A:T → C:G transversions. None of the 111 were in known mitochondria-targeted genes.
GO term enrichment
File S4 gives a complete account of gas-1 RC G0 enrichment results. Four GO slim categories were significantly enriched in the gas-1 RC lines: the biological processes of cell organization and biogenesis, cytoskeleton organization and biogenesis, protein modification, and the molecular function category of phosphoprotein phosphatase activity (Figure S6A). Although not significantly enriched, likely due to the very large number of gene annotations contained within each GO term category, large numbers of gas-1 RC line SNPs mapped to several other categories including reproduction and metabolic process (Figure S7). Overlapping sets of RC line mutated genes mapped to each of the four aforementioned categories. Ten gas-1 RC line mutated genes mapped to the cell organization and biogenesis term: ttn-1, syd-2, slt-1, tir-1, fer-1, ppfr-1, math-33, ced-12, Y34B4A.2, and pph-4.1; four to cytoskeleton organization and biogenesis: ttn-1, ppfr-1, ced-12, and pph-4.1; nine to protein modification: ttn-1, tir-1, C17H12.3, Y54F10BM.3, ppfr-1, Y106G6D.4, math-33, pph-4.1, and set-29; and three to phosphoprotein phosphatase activity: Y54F10BM.3, pph-4.1, and C17H12.3. Among the 14 unique genes in this set, several have fertility and embryogenesis functional annotations (Figure S7). Functional analysis of the gas-1 G0 interactome gene set (Christy et al. 2017) revealed shared enrichment of the three biological process categories that were enriched in the gas-1 RC lines: cell organization and biogenesis, cytoskeleton organization and biogenesis, and protein modification; however, the molecular function category of phosphoprotein phosphatase activity was not significantly enriched in the gas-1 interactome gene set. Conversely, no enriched G0 slims were shared between the gas-1 RC and previously reported MA line [figure 3a in Christy et al. (2017)] gene sets.
gas-1 interactions
Of the 46 genic mutations (i.e., those discovered within exons or introns) found within sequenced gas-1 RC lines, 13 were predicted to interact within two degrees of the gas-1 gene (Figure S6B and Table S7). Note that two distinct mutations were observed within the mitochondrial nad-1 gene at positions 1977 and 2154 bp, totaling 13 mutations in 12 genes that exhibit interactions within two degrees of gas-1. One of these, nad-1—encoding mitochondrial NADH dehydrogenase subunit I—was a direct interactor with gas-1. nduo-6, encoding another subunit of the same complex, is also predicted to directly interact with the gas-1 gene; however, its interaction value (2.05) did not meet the threshold of 4.5. By contrast, none of the 76 gas-1 G0 background mutations were found within the interactome. This is not especially surprising since these mutations, far from being a random sample of spontaneous substitutions, are all linked (the majority physically linked on the X chromosome) to gas-1. Of 59 genic mutations found within sequenced N2 MA lines (Christy et al. 2017), 12 were located within the gas-1-centric interactome.
Discussion
Evolution of male frequency accompanies fitness recovery
We found that evolution, under conditions of large population size and competition for food resources, could at least partly recover ancestral fitness and phenotypes on this short timescale. Two distinct fitness classes of G60 RC lines emerged (Figure 1 and Table 1); the one exhibiting greater fitness gains contained lines that evolved resistance to bleach treatment or high male frequencies during the experiment. Reversion of a fox-1 background mutation within three high-male, high-fitness RC lines (Table S4) may have provided one route to the evolution of male frequency. However, this reversion cannot fully explain the evolution of male frequency since wild-type laboratory populations of C. elegans N2 generate only ∼0.1% males; perhaps the intronic fox-1 mutation within the gas-1 G0 ancestor stifled the evolution of males in RC lines that did not experience reversion to wild-type. No other candidate sexual modifier mutations emerged from our analysis; the genetic basis for male frequency evolution in our lines thus remains unknown. High-male RC lines tended to perform especially well when fitness was measured in competition (Figure 3). Together with our finding that rates of chromosome nondisjunction were no different in high- vs. no-male RC lines, this observation is consistent with the prediction that adaptation is facilitated by recombination.
It is important to note that our observations of male frequency were anecdotal and incomplete. Other RC lines may have generated low frequencies of males that escaped observation. Furthermore, we failed to quantify male frequency until after the lines had been cryogenically stored. The inability to recover appreciable frequencies of males from these RC lines under benign conditions is consistent with males having been selectively favored under our specific evolution regime. Indeed, laboratory C. elegans populations exposed to selection have been observed to maintain males at significantly higher frequencies than wild-type N2 (Anderson et al. 2010; Teotonio et al. 2012); we therefore do not believe that the evolution of male frequency in our lines is specific to gas-1. It is possible that the bleach age synchronizations performed between each recovery generation or some other aspect of our treatment constituted an appropriate selective agent. Results of the mating assays are consistent with both male mating ability, and hermaphrodite outcrossing ability and latency to mate, having been targets of selection. In summary, our analyses cannot discern whether male frequency and outcrossing rates were causes or consequences of fitness evolution; future work will explore this issue in a controlled manner.
Recovery of ROS levels and generalized upward evolution of mtDNA copy number
Based on the subset of lines assayed, laboratory adaptation in gas-1 RC lines appeared to have been accompanied by evolution of lower steady-state ROS levels (Figure 4), which could result from lower ROS production or improved scavenging. In support of this idea, the line exhibiting highest G60 ROS, RC2, was a no-male line that scored low in both types of fitness assay. Recovery of ancestral ROS levels suggests that laboratory adaptation of gas-1 lines involved restoration of mitochondrial function. RC line evolution was also accompanied by increased mtDNA copy number in nearly all lines, with roughly 20% exhibiting a statistically significant increase over gas-1 G0 and N2 controls (Figure S3). Elevated mtDNA levels could have provided a route to fitness recovery through compensatory effects on mitochondrial function. Interestingly, however, a magnified pattern of increasing mtDNA levels was previously measured for MA lines initiated from both gas-1 and wild-type N2, and evolved under genetic drift (Wernick et al. 2016). In the current study, the increase in average mtDNA copy number of gas-1 RC lines compared to gas-1 G0—∼1.23×—was substantially lower than that observed for G43 gas-1 MA lines, which ranged from 2.2 to 3.4 times higher than gas-1 G0. In summary, while increased mtDNA levels in RC lines may be adaptive, a neutral or potentially maladaptive scenario seems more likely. Indeed, the five gas-1 RC lines showing statistically significant gains in mtDNA levels were not distinguished by their high fitness levels, but rather were members of both high- and low-fitness classes.
nDNA evolution and signatures of positive selection
Whole-genome analysis of the 24 gas-1 RC lines discovered 111 nDNA single-base substitutions (1–11 per line) and no reversions of the ancestral gas-1(fc21) allele. Thus, all phenotypic evolution within gas-1 RC lines resulted from secondary mutations. There was no correlation between RC line-specific means of any measured phenotype and the number of any SNP type, e.g., exonic or nonsynonymous. As the overall numbers of SNPs occurring in exon sequences was small (n = 18; Table S6), a dN/dS analysis could not be performed. Although we believe it to be unlikely, we acknowledge that reversion of background mutations fixed within the gas-1 G0 ancestor (Table S4) or compensations for any deleterious effects of these mutations could have provided a means of fitness recovery for six lines. Apart from the three fox-1 reversions occurring within three high-fitness RC lines, there was no correlation between the other three such reversions and G60 fitness. While the likelihood that the fox-1 reversions arose independently is small, we have observed evidence of parallel nDNA substitutions in experimental lines evolving under similar conditions on this timescale before (Denver et al. 2010), consistent with findings that population size (rather than genome size, etc.) may be the main driver of parallel genome evolution in evolve-and-resequence studies (Bailey et al. 2017). While reversions of unassayed mutation types (e.g., insertion/deletions) could also have contributed to RC line fitness evolution, the EMS treatment employed to generate the original gas-1 mutant generates ∼99% G:C→A:T transitions (Greene et al. 2003; Kim et al. 2006); our mutation analysis was thus unlikely to have missed important contributors.
Results of interactome analyses (Figure S6 and Table S7) bore the signature of positive selection, demonstrating that many fixed RC line SNPs mapped to the gas-1-centric interactome. Approximately one-quarter of all mutations occurred in genes interacting within two degrees from gas-1, a potential indicator of compensatory evolution (notably, none of the background mutations fixed within gas-1 G0 are in loci predicted to interact within two degrees of gas-1, i.e., they are unlikely to be hidden targets of compensatory evolution). However, it is worth noting that 20% (12/59) of mutations previously discovered in the gas-1 MA lines also fell within the gas-1-centric network. While this fraction was no different from that expected by chance, it does not differ substantially from the gas-1 RC line result.
Many of the same SNPs mapped to GO terms found to be significantly enriched: two biogenesis and organizational categories along with protein modification, and phosphoprotein phosphatase (Figure S7 and File S4). For instance, pph-4.1, encoding a protein phosphatase subunit necessary for proper centrosome functioning and meiotic chromosome dynamics (Sumiyoshi et al. 2002; Sato-Carlton et al. 2014), acquired an intronic mutation that appears in the gas-1-centric interactome (Figure S6B), where it interacts with a histone deacetylase gene, hda-1 (Table S7), and maps to all four significantly enriched GO terms (Figure S7). Several RC line SNPs were annotated as being involved in fertility-related processes (File S4). These results contrast with analyses of the gas-1 MA lines (Christy et al. 2017); these lines contained more mutations that the gas-1 RC lines, but had fewer significantly enriched GO slims (i.e., plasma membrane and transport), in agreement with the idea that less defined evolutionary pathways lead to fitness decline under drift than to fitness recovery under selection. A caveat is that the GO term analysis package we used does not account for differences in the lengths of genes annotated to different GO terms, which could have influenced these comparisons (Kofler and Schlotterer 2012).
Evidence for mitonuclear adaptation
Our most compelling evidence for adaptive mutation in RC lines comes from the analyses of mtDNA genomes (Table S5). Thirteen variants were discovered: five homoplasmic (fixed) and eight variable. Although we cannot know with certainty whether these mutations arose de novo during the experiment or instead were present within the single gas-1 G0 ancestral individual at low heteroplasmy levels, our failure to find convincing evidence of these variants in the ancestral strain, any other RC line, or previously studied gas-1 MA lines supports the idea that they are novel. It is also worth noting that cryptic paralogy is far less problematic for mtDNA than for nDNA resequencing projects. A large fraction (7/13) of these variants caused amino acid replacements in two ETC complex I proteins, ND1 and ND6 (Figure S4), with the former predicted to physically interact with the nuclear-encoded GAS-1 protein (Figure S6B). We also found evidence of considerable parallel evolution with two of these mutations discovered in two and three RC lines, respectively. Neither the results of our gas-1 MA experiment (Wernick et al. 2016) nor those from wild-type MA lines (Konrad et al. 2017) suggest that these sites are hotspots for mutation. Two RC lines in which these mtDNA mutations were detected as segregating variants were members of the low-fitness class. Conversely, four of the five lines in which these mutations were detected as nearly or completely homoplasmic were members of the high-fitness class; three of these five were members of the high male frequency class. One of the aforementioned lines was RC22, whose mtDNA differed from that of wild-type N2 by a single nucleotide causing an S→L replacement in the ND1 protein (Table S5). This line exhibited the greatest recovery of wild-type reproductive and competitive fitness (Figure 3), and evolved resistance to the bleach treatments used to synchronize lines each generation; however, no males were detected in this line. Line RC10, which exhibited the second-greatest fitness gains, was also not noted to contain males, suggesting that outcrossing was not a prerequisite of rapid adaptation.
nduo-1 and nduo-6 interface between the hydrophobic membrane arm and the hydrophilic matrix arm of complex I, in which the GAS-1 subunit is located (Brandt 2006; Efremov and Sazanov 2011; Sazanov 2015). GAS-1 is the immediate electron donor to ubiquinone and helps to form the quinone-binding pocket of complex I (Vasta et al. 2011; Shiraishi et al. 2012). Several studies suggest that nduo-1 also contributes to ubquinone binding (Darrouzet et al. 1998; Kurki et al. 2000; Brandt 2006). Although nduo-6 is not known to participate directly in ubiquinone binding, it may contribute to the interaction between complex I and ubiquinone (Jun et al. 1996; Pätsi et al. 2008). We hypothesize that the nduo-1 and nduo-6 mutations discovered within RC lines partially ameliorate the reduced complex I activity caused by the gas-1 mutation. Individual characterization of these candidate adaptive mutations will be reported elsewhere.
Conclusions
We found that ETC mutant lineages can partially recover wild-type fitness levels via fixation of novel mutations on a short evolutionary timescale, and that many of the causal mutations are likely to cluster within the same functional network as the original mutant allele. The evolution of outcrossing appeared to accompany such fitness recovery, especially for RC lines that fixed particular mtDNA mutations. Our finding that fixation of mtDNA mutations may have facilitated the rapid adaptation of certain gas-1 RC lines would provide the first direct evidence for adaptive, compensatory mtDNA mutation-driven evolution.
The same observations that spawned the previously mentioned nuclear compensation hypothesis (Osada and Akashi 2012; Burton et al. 2013) also led to the formation of a new hypothesis to explain the evolution and maintenance of sexual reproduction: the mitonuclear sex hypothesis (Havird et al. 2015a). Both hypotheses are predicated on the assumption that mtDNA genomes experience ongoing genomic decay, a topic of much debate. Described as a “Red Queen hypothesis with a mitonuclear twist” (Hill 2015), the mitonuclear sex hypothesis suggests that sex is maintained because it increases the rate at which new combinations of nDNA alleles able to compensate the theoretically ongoing mtDNA genome decay are introduced into populations. Similar benefits would not extend to asexually propagating mtDNA, where adaptive mutation dynamics are expected to be strongly influenced by clonal interference. It further predicts that, in facultatively outcrossing lineages, sex will be favored in cases of mitonuclear mismatch. Our results do not appear to provide especially strong support for either of the above hypotheses. While mitonuclear mismatch may have promoted outcrossing in some of our lines, we observed that fixation of mtDNA and nDNA (rather than only nDNA) mutations may have been key facilitators of rapid adaptation in gas-1 RC lines, and that lines fixing mtDNA mutations were those with the strongest tendency to evolve high outcrossing rates. However, the fact that we generated RC lines only from one nDNA mutant leaves ample room for question.
Our study may have nonetheless exposed a case in which mtDNA- rather than nDNA-driven mitonuclear adaptation is promoted by sexual recombination; i.e., one of extreme mitonuclear mismatch and associated reduction in fitness. Here, outcrossing would generate different combinations of new mitotypes (supplied by the high rate of mtDNA mutation) and gas-1 mutation-bearing nDNA backgrounds, thereby promoting rapid fixation of compensatory mtDNA mutations. Furthermore, because our lines evolved from a genetically invariant ancestor, they would be unlikely to suffer from outcrossing-induced recombination load resulting from the breakup of beneficial allelic combinations (Whitlock et al. 2016). Outcrossing might easily invade selfing populations under such circumstances, analogous to situations described by “class I models” for the evolution of sex defined by Sharp and Otto (2016). These models include Red Queen and Spatial Heterogeneity models, in which sex serves to break up previously beneficial but currently obsolete allelic combinations. Our experiment generated an intergenomic version of this scenario by forcing mitonuclear mismatch. Whether such a process has a bearing for populations with less extreme mitonuclear match where selection would be less intense, or in more genetically heterogeneous populations wherein sex might also serve to break up beneficial mitonuclear combinations (Radzvilavicius 2016), inducing a recombination load, is completely unstudied. Furthermore, short-term costs of breaking apart allelic combinations built by previous selection can, in certain cases, impede the invasion of sexual modifiers (e.g., Otto and Feldman 1997). There is clearly much to learn about the forces shaping mitonuclear coevolution. The complexity of mitochondrial population dynamics and our incomplete understanding of the relative influence of evolutionary forces acting on mtDNA genomes imply that this is an ideal problem for the application of experimental evolution and population genomics (c.f., McDonald et al. 2016).
Acknowledgments
We thank A. Basler and L. Muñoz Tremblay for laboratory support, the P.C. Phillips group (University of Oregon) for helpful discussion, and A. Agrawal and two anonymous reviewers for insightful comments. We also thank the Oregon State University Center for Genome Research and Biocomputing for DNA sequencing and bioinformatics support. This work was supported by the National Science Foundation (MCB-1330427 to S.E. and D.R.D., and HRD-140465 to S.E., which supported the undergraduate research of J.F.R.) and the Portland State University Biology Department (Forbes-Lea grant to S.F.C.).
Footnotes
Supplemental material available at Figshare: https://doi.org/10.25386/genetics.7609925.
Communicating editor: A. Agrawal
Literature Cited
Author notes
These authors contributed equally to this work.
