


Abstract
Musselman et al. address the overarching question: “What’s so bad about a high-calorie diet?” Using computational biology to analyze mRNA expression profiles, the authors built a Drosophila fat body gene regulatory network that predicted...
Insulin resistance is associated with obesity, cardiovascular disease, non-alcoholic fatty liver disease, and type 2 diabetes. These complications are exacerbated by a high-calorie diet, which we used to model type 2 diabetes in Drosophila melanogaster. Our studies focused on the fat body, an adipose- and liver-like tissue that stores fat and maintains circulating glucose. A gene regulatory network was constructed to predict potential regulators of insulin signaling in this tissue. Genomic characterization of fat bodies suggested a central role for the transcription factor Seven-up (Svp). Here, we describe a new role for Svp as a positive regulator of insulin signaling. Tissue-specific loss-of-function showed that Svp is required in the fat body to promote glucose clearance, lipid turnover, and insulin signaling. Svp appears to promote insulin signaling, at least in part, by inhibiting ecdysone signaling. Svp also impairs the immune response possibly via inhibition of antimicrobial peptide expression in the fat body. Taken together, these studies show that gene regulatory networks can help identify positive regulators of insulin signaling and metabolic homeostasis using the Drosophila fat body.
EXCESS caloric intake or overnutrition leads to obesity, cardiovascular disease, hyperglycemia, and insulin resistance in humans, collectively known as the metabolic syndrome, and often resulting in type 2 diabetes (Chopra et al. 2002; Ceriello 2006; Lusis et al. 2008; Mensink et al. 2008; Magkos et al. 2009; van Schothorst et al. 2009; Unger and Scherer 2010). How overnutrition and the subsequent metabolic imbalance are connected with insulin resistance is not well understood. Several organs or organ systems develop insulin resistance, including the adipose, liver, immune, nervous, and cardiovascular systems (Brownlee 2005; Forbes and Cooper 2013). Each site exhibits different pathophysiology: arrhythmia in the heart, autoimmunity in the adipose, and steatosis in the liver. In each case, physiologic and metabolic dysfunction are strongly associated.
Our goal is to understand the metabolic pathways that contribute to deleterious phenotypes in insulin-resistant tissues. To do this, we are using the fruit fly Drosophila melanogaster as a model of metabolic disease where chronic high-sugar (HS) feeding leads to obesity and insulin resistance (Musselman et al. 2011; Pasco and Leopold 2012). In previous work, we showed a protective role for fat body lipid storage against the accumulation of lipid toxins or “lipotoxicity” (Musselman et al. 2013, 2016). The lipogenic transcription factor known as Carbohydrate Response Element Binding Protein (dChREBP, also called dMondo or Mio) acts in the fat body to protect Drosophila from the “metabolic syndrome” induced by HS feeding (Havula et al. 2013; Musselman et al. 2013). Loss of dChREBP in fat bodies reduced the expression of the insulin receptor (dInR) and its downstream signaling cascade proteins Chico and dAkt, suggesting a direct interaction exists between these two pathways during caloric overload.
We looked for other genes that were regulated by dChREBP that might connect lipid metabolism to insulin signaling. The gene encoding the nuclear receptor Seven-up (Svp) was one such gene: svp expression in fat bodies depended on dChREBP only under HS feeding conditions (Musselman et al. 2013). Svp is one of 18 proteins in the Drosophila nuclear receptor superfamily, a group of evolutionarily conserved hormone- and lipid-regulated transcription factors that depend upon dimerization, cofactor recruitment, and ligand binding for activity [reviewed in King-Jones and Thummel (2005)]. Known primarily for its role in cell fate determination during photoreceptor development (Mlodzik et al. 1990; Heberlein et al. 1991; Hiromi et al. 1993; Begemann et al. 1995; Domingos et al. 2004; Miller et al. 2008), Svp also functions in the developing heart (Lo and Frasch 2001; Trujillo et al. 2016) and fat body (Hoshizaki et al. 1994, 1995). Interestingly, reducing dChREBP reduced svp, whereas reducing dInR increased svp expression in the fat body (Musselman et al. 2013, 2017). For this study, we constructed a fat body gene regulatory network (GRN) that predicted Svp as a regulatory node. Therefore, we hypothesized that Svp might regulate aspects of metabolic homeostasis. We show that Svp controls larval fat body insulin signaling, affecting immune gene expression and lipid metabolism. Svp is required for glucose clearance and seems to promote signaling downstream of the dInR especially in the face of chronic HS feeding. Under typical diet and insulin signaling conditions, the cell seems able overcome defective Svp, whereas when insulin signaling is reduced, Svp is needed to compensate by increasing downstream cellular processes. We probed several pathways to learn more about how this transcription factor functions in the fat body to control signaling and metabolism in the face of a HS diet. We propose that Svp promotes insulin signaling both by competition with the ecdysone pathway and by suppression of the innate immune response.
Materials and Methods
Fly husbandry
Drosophila stocks were ordered from the Vienna Drosophila Resource Center (VDRC), Bloomington Drosophila Stock Center (BDSC), or sourced through individual laboratories. Control stocks from the VDRC were 60000 (w1118 genotype) or 60100 (y; w1118 + attP landing site control) for the GD or KK transgenic insertion lines, respectively (Dietzl et al. 2007). Stocks of the genotypes UAS-Svpi (VDRC KK 100762), UAS-p53i (VDRC KK 103001), UAS-Tfb1i (VDRC GD 12580), UAS-dFOXOi (VDRC KK 106097), UAS-Stat92Ei (VDRC KK 106980), UAS-EcRi (VDRC GD 37058), SvpAE127/TM3Sb (BDSC 26669), EcRE-lacZ (BDSC 4517), r4-GAL4 (Lee and Park 2004), UAS-Dcr2 (Dietzl et al. 2007), and w1118; UAS-Svp2 (Kerber et al. 1998) were also used. UAS-Dcr2; r4-GAL4 virgins were crossed with males of each genotype to derive transgenic offspring with tissue-specific expression. Crosses were set for 3–4 days and offspring collected as wandering third instar larvae after 6–9 days at 25°, depending on diet and genotype. Developmentally delayed wanderers were collected later to enable comparison at the same stage as controls.
Diets
A modified Bloomington Semi-Defined medium was used as described previously (Musselman et al. 2011). Briefly, sucrose was used to replace glucose to a level of 5–34% sugar, with all other ingredients remaining the same.
Gene expression profiling
Fat bodies were isolated from wild-type (WT; GAL4 driver X genetic background) and transgene-expressing (GAL4 driver X UAS-transgene) wandering third instar larvae fed control or HS diets. RNA was isolated using TRIzol and organic extraction followed by Qiagen RNeasy column purification as described previously (Musselman et al. 2013). Library preps, bar-coding, high-throughput sequencing, and differential expression analyses were done by Washington University’s Genome Technology Access Center using the Tuxedo Suite (Trapnell et al. 2012) and EdgeR (Robinson et al. 2010).
GRN inference
The GRN model was built using the NetProphet GRN inference algorithm (Haynes et al. 2013). NetProphet infers direct, functional gene regulation from gene expression data by combining models produced by differential expression and regression analysis. The regression component of the NetProphet GRN was produced by running LASSO regression on RNA-sequencing (RNA-seq) data collected from the fat bodies of flies fed diets consisting of either 0.15 M sucrose, 0.3 M sucrose, 0.7 M sucrose, or 1.0 M sucrose. For the 0.15 M sucrose and 0.7 M sucrose diet flies, RNA-seq data from fat body RNA isolated from larvae expressing transgenic RNA interference (RNAi) targeting Stat92E (CG4257), p53 (CG33336), dFOXO (CG3143), Tfb1 (CG8151), and dChREBP (CG18362) was used in addition to control, WT larval fat body, which included two different genetic background controls depending on the RNAi transgene used (see Drosophila methods for details). Only WT (GAL4 driver x w1118 genetic background) RNA-seq data were used for 0.3 M sucrose and 1.0 M sucrose diet flies. The differential expression component of the NetProphet GRN was constructed by using differential expression information between regulator knockdown and WT control gene expression profiles from the same diet (0.15 M sucrose or 0.7 M sucrose). The maximum differential expression score for each regulator-gene pair in the two diets (0.15 M sucrose or 0.7 M sucrose) was used as the differential expression score for the regulator-gene pair. Finally, the NetProphet weighted averaging approach was used to combine the differential expression and regression components into a single GRN.
Offspring production
Sixteen males and 16 females were crossed for each genotype and set at 25° for 3 days, with crosses checked after 1 day and any dead flies replaced. After 3 days, parental adults were removed, and the F1 generation developing into adults were counted upon eclosion.
Hemolymph glucose assay
Wandering third instar larvae were collected, rinsed, and hemolymph collected as described (Musselman et al. 2011). Then, 1 μl hemolymph was added to 99 μl frozen Infinity Glucose hexokinase reagent (Thermo Fisher Scientific) and incubated at 37° for 15 min, and then read on a microplate reader at 340 nm absorbance.
Triglyceride assay
Wandering third instar larvae were collected and frozen at −80° until the time of assay. Larvae were homogenized in PBS + 0.1% Tween in groups of six, heated at 65° for 5 min, and homogenate added to Thermo Infinity triglyceride (TAG) reagent, incubated at 37° for 15 min, then read at 540 nm absorbance in a microplate reader.
Nile Red staining and quantification
Larvae were bisected, inverted, fixed for 30 min in 4% paraformaldehyde in PBS, then rinsed in PBS and 0.1% Triton X (PBS-TX) and stained in PBS-TX + 0.001% Nile Red for 1–2 hr. Larvae were washed in PBS-TX and mounted in Vectashield for laser confocal scanning microscopy using an argon laser to excite at 543 nm. Confocal images were collected at a single optical section (z) near the center of the tissue, and ImageJ software (Schneider et al. 2012) was used to set thresholds detecting lipid droplet boundaries, and to quantify droplet sizes.
Metabolomics
V60100, UAS-Dcr2, r4-GAL4 and UAS-Svpi, UAS-Dcr2, r4-GAL4 larvae were selected and fat bodies extracted for metabolomic profiling by Metabolon (Durham, NC).
Insulin signaling pathway activity
To measure endogenous pathway activity, wandering third instar larvae were inverted to isolate fat bodies, then resuspended in 2× Maniatis SDS sample buffer. To measure the response to insulin, inverted larvae were treated with 1 μM recombinant human insulin (I2643; Sigma, St. Louis, MO) in Schneider’s insect medium for 15 min at room temperature. Fat bodies were harvested and dAkt phosphorylation assessed by Western blot described previously. Anti-PO4-dAkt specific for PO4-Ser505 (#4054; Cell Signaling Technology) and anti-syntaxin (Developmental Studies Hybridoma Bank #8c3) primary antibodies were used for normalizing.
Reverse transcription and quantitative PCR
To confirm knockdown, we used reverse transcription and quantitative PCR. RNA was isolated from fat bodies as described above and was reverse transcribed using an oligo(dT) primer and SuperScript II (Invitrogen, Carlsbad, CA). Quantitative real-time PCR was run on the PRISM series 7000 (Applied Biosystems, Foster City, CA) using SYBR Green (Thermo Fisher Scientific). The program run was 95° for 3 min, 40 cycles of 95° for 30 sec, 55° for 30 sec, and 72° for 30 sec. A dissociation curve was run at the end of the program to check the melting temperature of the products being amplified. Svp levels were normalized against the levels of the transcript rp49. Primers used were as follows:
svp-68 5′ ATGGGCAGTACCAGATTGC 3′
svp-157 5′ GCAGGAGCGAGATGTAGGA 3′
svp-4 5′ ATGAGACGCGAAGCTGTTC 3′
svp-92 5′ CCGTTGGCAATCTGGTACT 3′
rp49-273-5′ 5′ GCACTCTGTTGTCGATACCC 3′
rp49-392-3′ 5′ CAGCATACAGGCCCAAGAT 3′.
Infection studies
Thoracic injury of young adults (1–3 days old) was carried out with a tungsten needle dipped in an overnight culture of Pseudomonas aeruginosa (PA14) diluted to A600 = 0.005 (using 200 μl in a 96-well plate). This concentration typically produced lethality in a majority, but not all flies over a period of 1 week. This absorbance correlated to a bacterial concentration of ∼3 × 10⁷ CFU/ml. For survival assays, two statistical approaches were taken to analyze flies counted daily for 7 days in vials of 15–25 flies. For overall percent survival analysis, we considered all flies at 7 days using each vial as an independent biological replicate. A Kaplan–Meier estimator curve was also generated using the time of death for individual dead flies only, allowing us to predict whether survival rates differed significantly between diets or genotypes. The Mantel–Cox test was used to derive P-values, with the Mantel–Haenszel test used to derive hazard ratios. For colony counts, single flies were homogenized in PBS and plated on Pseudomonas Isolation Agar (VWR, Hardy Diagnostics).
Statistics
Graphing and statistics were performed using GraphPad Prism software v6.0.
Data availability
Full RNA-seq data are available at https://www.ncbi.nlm.nih.gov/geo/ under accession numbers GSE43734, GSE95800, GSE110432, and GSE111728.
Results
Mapping the fat body GRN
To understand the role of the fat body in response to dietary excess, we took a tissue-specific genomic approach. Gene expression profiling of fat bodies from WT and dChREBP-deficient larvae fed control or HS diets highlighted many differentially expressed genes (Musselman et al. 2013). Using this dataset as the basis for a reverse genetics approach, we hypothesized that differentially expressed transcription factors might regulate fat body metabolism downstream of dChREBP in the face of caloric overload. We therefore targeted four differentially expressed, transcription factor-encoding genes using transgenic RNAi: Stat92E (CG4257), p53 (CG33336), dFOXO (CG3143), and Tfb1 (CG8151). RNAi targeting any of these four or dChREBP (CG18362) in fat body impaired larval survival or glucose homeostasis in the face of HS feeding. In order to better understand the targets of these transcription factors, we carried out RNA-seq on fat bodies in which the transcription factors were knocked down.
Control and loss-of-function fat bodies from each diet and genotype were collected from wandering third instar larvae and RNA sequenced using Illumina Hi-Seq (Musselman et al. 2013). The resulting data were used to map the fat body GRN with NetProphet, our network mapping software (Figure 1, A and B; Haynes et al. 2013). We noted that many GRN edges connected Svp, encoding a nuclear receptor transcription factor, to predicted targets or upstream regulators of fat body metabolism, making it likely that Svp served an important role during HS feeding. In independent RNA-seq experiments, we found that svp expression was inversely correlated with that of dInR (Musselman et al. 2017). Therefore, we tested whether Svp might be important in controlling insulin signaling and metabolism.
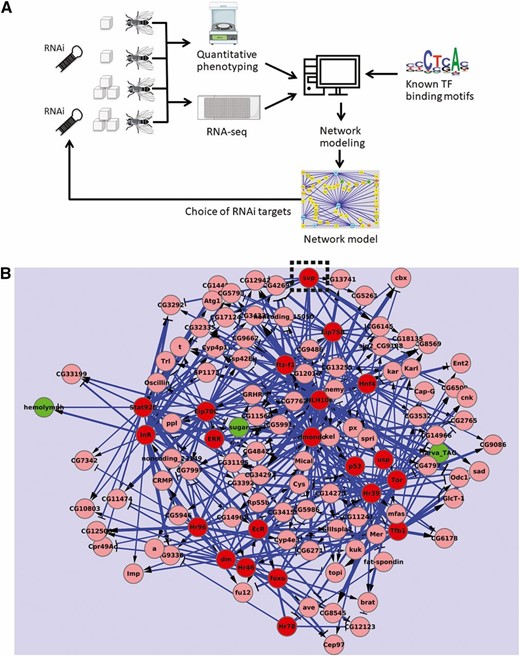
An inferred fat body transcriptional network predicted Seven-up as a regulatory node. (A) Wild-type and RNAi larvae were reared on control or HS diets. Fat body (FB) RNA-seq on five different transgenic knockdown genotypes gave differential expression data, which was used to build the network. (B) An inferred transcriptional network predicted key roles for several transcription factors (TFs), including Seven-up (Svp). Based on Haynes et al. (2013).
Svp is required to maintain insulin signaling and glucose homeostasis during HS feeding
To quantify overall health, we used a semiquantitative approach, measuring the ability of WT and RNAi flies to survive development on HS feeding. Fat body-specific loss of Svp led to significant lethality on 1 M HS food, making these animals difficult to study (Figure 2A). When reared on 0.7 M HS food, r4-GAL4, UAS-Svpi larvae exhibited developmental delay (Figure 2B) and elevated hemolymph glucose, or hyperglycemia (Figure 2C) as in dInR pathway loss-of-function flies (Bohni et al. 1999; Rulifson et al. 2002; Shingleton et al. 2005). Consistent with reduced insulin signaling, loss of Svp in fat body led to a modest but significant reduction in size, at least in female larvae reared on HS diets (Figure 2D). Therefore, we tested the integrity of the insulin signaling pathway in the fat body using the downstream marker of dInR signal transduction, PO4-dAkt [also known as PKB (Alessi et al. 1997)]. In the absence of insulin, Svp RNAi increased fat body dAkt phosphorylation at Ser505 under control feeding conditions but had no effect on an HS diet (Figure 2E). By treating larvae with exogenous insulin, we quantified insulin sensitivity. Fat bodies expressing RNAi targeting Svp had an impaired insulin response, measured as a 49% reduction in dAkt phosphorylation upon stimulation with 1 μM exogenous insulin compared with genetically matched controls (Figure 2F). Thus, Svp had diet-dependent effects on insulin receptor signal transduction with reduced insulin sensitivity on HS diets.
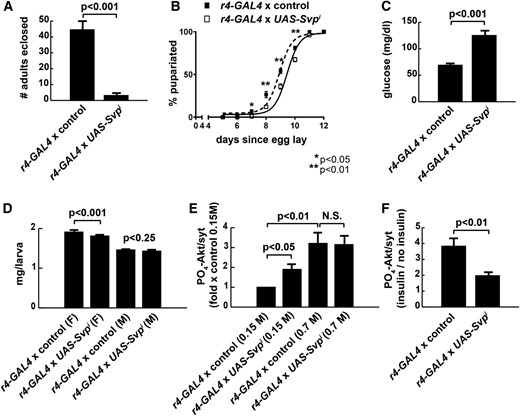
Svp loss-of-function exacerbates hyperglycemia and insulin resistance. r4-GAL4 was used to express Svp RNAi in the larval FB. Svp mRNA levels were reduced by ∼35% in FBs expressing transgenic RNAi. (A) A dramatic reduction in offspring numbers in r4 > Svpi reared on 1 M sucrose HS diets led us to use 0.7 M sucrose as a revised HS diet in most experiments. n = 11 for controls; n = 12 for UAS-Svpi. (B) Svp RNAi in FB led to developmental delay on 1 M HS diets, compared with controls. 50% of control animals pupariate at day 8.92 ± 0.09 whereas r4 > Svpi pupariate at day 9.45 ± 0.08. (mean ± SEM) n = 13 vials for controls; n = 14 vials for UAS-Svpi. (C) FB-specific loss of Svp via RNAi led to an increase in circulating glucose levels in larvae reared on 0.7 M sucrose HS diets. n = 143 for controls; n = 68 for UAS-Svpi. (D) Svp RNAi in FB led to a modest reduction in size at wandering, compared with control larvae reared on 0.7 M sucrose HS diets. n = 83 for control females. n = 18 for UAS-Svpi females. n = 51 for control males. n = 11 for UAS-Svpi males. (E) Western blots were used to assess dAkt phosphorylation status in post-feeding wandering third instar larval fat bodies. Svpi FBs exhibited increased PO4-dAkt (at Ser505) in control-fed larvae, but not in 0.7 M sucrose HS-fed larvae. n = 11 fat body samples/treatment. (F) Western blots were used to assess FB dAkt phosphorylation in response to 1 μM insulin stimulation in organ culture. Svp RNAi FBs exhibited an impaired insulin response, compared with control larvae, when both were fed the 0.7 M sucrose HS diet. n = 11 for controls; n = 8 for UAS-Svpi. Error bars are ± SEM. A two-tailed student’s t-test was used to determine P-values.
Reducing Svp leads to dyslipidemia in the larval fat body
Insulin resistance and hyperglycemia are often associated with changes in lipid metabolism. Insulin-resistant livers exhibit steatosis characterized by increased lipid storage droplet size, TAG, diacylglycerol, phospholipid, glycolipid, and ceramide accumulation, accompanied by dyslipidemia of cholesterol and associated lipoproteins in the blood (Finck and Hall 2015; Kawano et al. 2015; Brouwers et al. 2016). Therefore, we asked whether Svp affected fatty acid synthesis and storage on HS diets. Whole animal TAG in r4-GAL4; UAS-Svpi larvae was increased, compared with control larvae fed the same HS diet (Figure 3A). Increased TAG correlated with increased lipid droplet size in Svp RNAi fat bodies, compared with control fat bodies (Figure 3, B–D). Several individual lipid species were increased in Svp-deficient fat bodies, including stearate and lipids derived from stearate (Figure 3, E–H), consistent with a model of toxic lipid accumulation or lipotoxicity (Brookheart et al. 2009). In addition, metabolites involved in the immune response were increased in Svp-deficient fat bodies (Figure 3, I–L) suggesting a potential immunological role for Svp.
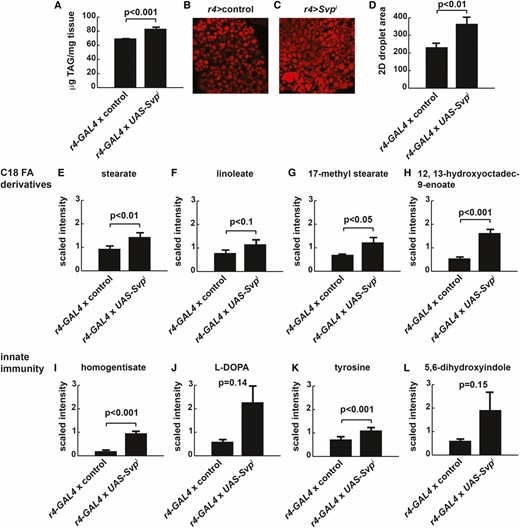
Svp regulates triglyceride storage and lipid metabolism. Wild-type wandering third instar larvae reared on 0.7 M sucrose were compared with those expressing RNAi targeting Svp in the FB. (A) Triglyceride content increased in Svp knockdown larvae, compared with controls. n = 126 for controls; n = 31 for UAS-Svpi. (B and C) FB lipid storage was analyzed using Nile Red to stain lipid droplets. (D) The two-dimensional areas of lipid droplets were quantified using ImageJ to estimate fat storage. n = 12 for controls; n = 8 for UAS-Svpi. (E–L) FBs were isolated from control or Svp knockdown FBs and subject to organic extraction and GC or LC/MS/MS to identify and quantify relative amounts of 238 metabolites. n = 6 for (E–L). Error bars are ± SEM. A two-tailed student’s t-test was used to determine P-values. Magnification for (B) and (C), 20×.
Svp overexpression protects from some effects of HS feeding
To test if excess Svp could improve overnutrition-induced phenotypes, we obtained flies carrying conditional overexpression constructs [UAS-Svp2 (Kerber et al. 1998)]. Overexpression of Svp in the fat body lowered circulating glucose concentrations by 21% and slightly improved growth in animals challenged with 0.7 M sucrose HS diets (Figure 4, A and B). Accordingly, there was a modest increase in insulin responsiveness at the PO4-dAkt level in UAS-Svp fat bodies, compared with controls (Figure 4C). Fat body overexpression of Svp also decreased TAG content, consistent with the improvement in other diabetes-like phenotypes in these larvae (Figure 4D). No differences were observed in lipid droplet size upon Svp overexpression (Figure 4E).
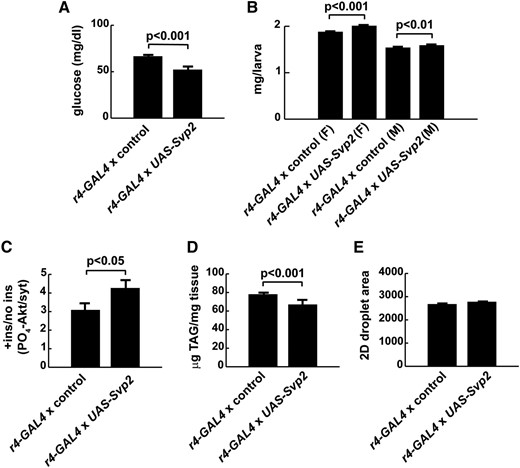
Seven-up overexpression improves diabetes-like phenotypes in larvae fed the HS diet. FB overexpression of Svp using UAS-Svp2 improved growth and metabolism in larvae challenged with an 0.7 M HS diet. Overexpression led to an ∼38-fold increase in FB Svp mRNA levels compared with w1118 controls. (A) Overexpression of Svp improved glucose tolerance in larvae fed HS diets. n = 194 for controls; n = 74 for UAS-Svp. (B) Increasing Svp also improved growth during HS challenge. n = 111 for control females. n = 25 for UAS-Svp females; n = 85 for control males. n = 23 for UAS-Svp males. (C) The downstream response to insulin was improved in FB Svp-overexpressing larvae. PO4-dAkt was normalized to syntaxin as a loading control. n = 15 for controls; n = 7 for UAS-Svp. (D) Triglyceride concentrations were reduced in larvae overexpressing Svp. n = 174 for controls; n = 50 for UAS-Svp. (E) FB lipid droplet size was unaffected by overexpression of Svp, compared with controls. n = 33 for controls; n = 31 for UAS-Svp. Error bars are ± SEM. A two-tailed student’s t-test was used to determine P-values. The response to insulin stimulation (+ ins) was compared to vehicle treatment (no ins) and PO4-dAkt was measured and normalized to syntaxin as a loading control.
Svp controls the expression of sugar-dependent and ecdysone-dependent genes
Next, we used RNA-seq to search for transcriptional targets of Svp that might reveal potential mechanisms for the HS phenotypes observed. Fat bodies expressing RNAi targeting the Svp gene were compared with control fat bodies, both from animals reared on a 0.7 M sucrose HS diet. Fat body messenger RNA (mRNA) was isolated from r4-GAL4, V60100 (genetically matched control genotype) or r4-GAL4, UAS-Svpi wandering third instar larvae. EdgeR (Robinson et al. 2010) was used to detect significant differences in transcript abundance, which we interpret to include both direct and indirect target genes that are under the control of Svp. A total of 1428 genes were differentially expressed: 757 significantly decreased and 671 significantly increased, with P < 0.01 and a false discovery rate <0.05 (Supplemental Material, Table S1). We also characterized the transcriptomes of control-fed r4-GAL4, V60100 (WT) and r4-GAL4, UAS-Svpi fat bodies and found 818 differentially expressed genes (Table S2), although we chose to focus on the HS differentially expressed genes due to the increased severity of phenotypes in these animals. To better understand the physiological processes that might be misregulated in HS-fed, Svp-deficient fat bodies, we analyzed Svp target genes as a group. First, we used DAVID (Huang et al. 2009) to perform Gene Ontology enrichment analyses to identify processes or compartments likely to be affected by Svp loss-of-function. The significantly enriched Gene Ontology categories suggested an increase in cytochrome P450 activity, stress and immune responses, and DNA replication in fat bodies with reduced Svp (Table 1). There was also evidence of a decrease in expression of genes encoding mitochondrial proteins, especially those involved in oxidative phosphorylation, as well as proteins required for lipid and protein turnover (Table S1 and Table 1). To our surprise, we did not find differential expression of genes encoding dInR, Chico, dAkt, or dFOXO in Svpi fat bodies.
Significantly enriched gene classes detected by differential expression in fat bodies undergoing chronic Svp knockdown (Svpi)
| Svpi upregulated genes | Svpi downregulated genes | ||
|---|---|---|---|
| Gene Ontology class | P-value | Gene Ontology class | P-value |
| Cytochrome P450 | 4.39E−05 | oxidoreductase | 6.83E−10 |
| Monooxygenase | 3.17E−06 | lipid particle | 3.72E−09 |
| Immune response | 7.88E−06 | mitochondrial part | 4.78E−04 |
| DNA replication | 3.08E−11 | glycerolipid metabolism | 0.072438 |
| Vesicular fraction | 1.86E−05 | lipid catabolic process | 0.026219 |
| Endoplasmic reticulum | 5.00E−05 | oxidative phosphorylation | 2.08E−05 |
| Cellular response to stress | 0.001109 | metallopeptidase activity | 0.004011 |
| Limonene and pinene degradation | 0.001183 | endopeptidase activity | 0.005798 |
| peptidase M13, neprilysin, C-terminal | 2.85E−08 |
Next, we compared Svpi fat body differential expression with other potentially related datasets to look for overlaps (Figure 5, A–C). Because Svp RNAi led to the most severe phenotypes during HS feeding, we compared Svpi to HS differentially expressed genes (Figure 5A; Musselman et al. 2013). Both Svp and HS regulated expression of genes involved in lipid metabolism, CyP450 oxidoreductase enzymes, the endoplasmic reticulum, and the immune response. Most of these mRNAs (170 out of 260 or 65%) were inversely correlated, which in light of our phenotypic data suggests that some protective transcriptional changes in the HS-fed fat body may depend upon Svp. The most increased gene in Svpi fat bodies (measured in RPKM) was Lsp2, a direct target of the ecdysone receptor, EcR (Antoniewski et al. 1995). Like Svp, EcR is a transcription factor and member of the nuclear hormone receptor superfamily (King-Jones and Thummel 2005); previous studies have shown an interaction between these receptors in vitro (Zelhof et al. 1995). We hypothesized that Svp might regulate other EcR target genes, and therefore the Svp differentially expressed dataset was compared with EcR-dependent genes (Figure 5, B and C; Beckstead et al. 2005) or EcR ligand 20-hydroxyecdysone (20E)-dependent genes [Figure 5D, also Beckstead et al. (2005)] and the overlaps were subject to Gene Ontology enrichment analysis using DAVID. By expressing EcR RNAi in the larval fat body, we saw the greatest amount of overlap, with 496 out of 1428 Svp-dependent genes differentially expressed in EcR RNAi fat bodies (Figure 5B), suggesting a link between EcR and Svp. Of these, 111 genes were differentially expressed in HS, Svpi, and EcRi fat bodies and were enriched for genes with roles in proteolysis, iron binding, redox homeostasis, metabolism, and immunity. Therefore, although a fraction of genes overlap, many distinct genes related to the same processes were detected with each analysis. Svp-dependent fat body genes also overlapped with EcR- and 20E-dependent genes in whole larvae, albeit to a lesser degree, likely due in part to our different experimental diets and in part to unique EcR-dependent and Svp-dependent processes in different tissues (Figure 5, C and D). Fewer than half (73 out of 162) of EcR-dependent genes in whole larvae were EcR-dependent in the fat body, with 52 of these 73 exhibiting opposing effects between EcRi and Svpi, consistent with a model where these two receptors interact. Enriched Gene Ontology categories over all of these comparisons suggested a common role for these transcription factors in nutrient and hormone metabolism, redox homeostasis, and the immune response (Figure 5 and Table 2). These overrepresented genes represent promising candidates for follow-up studies.
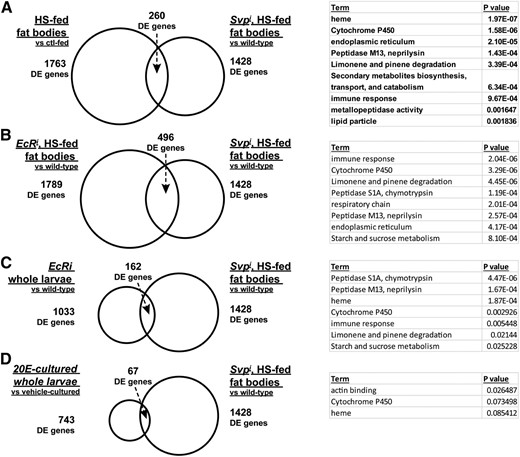
Differential expression analyses of Svpi fat bodies to identify candidate target pathways. GO categories enriched in the overlap are listed with a P-value assigned to the significance of overrepresentation using DAVID. (A) Genes differentially expressing (DE) between 0.15 and 0.7 M sucrose in FBs were compared to DE genes in Svpi FBs. (B) EcR RNAi expressed in FBs led to lethality on 0.7 M sucrose, so 0.5 M sucrose was used. RNA-seq data identified 1789 DE genes using EdgeR with a P < 0.05 and no fold change cutoff. The overlap between Svp and EcR RNAi contained the Gene Ontology categories listed. (C) Whole wandering larvae expressing ubiquitous EcR RNAi were compared to controls using microarrays. Overlapping EcR and Svp targets were enriched for genes in the Gene Ontology categories listed. (D) Whole larvae were cultured with 20-hydroxyecdysone (20E) and gene expression measured by microarray, compared with vehicle-treated controls. Overlapping 20E and Svp targets were analyzed for significantly enriched Gene Ontology terms, shown. n = 3 biological replicate RNA-seq libraries per genotype/diet combination except for HS-fed (n = 13).
Significantly increased immune response genes detected by differential expression in fat bodies undergoing chronic Svp knockdown (Svpi) on 0.7 M sucrose diets
| FlyBase gene ID | Gene name | P-value | FDR | FC Svpi/+ |
|---|---|---|---|---|
| FBgn0012042 | AttA | 8.98E−27 | 2.44E−24 | 6.00 |
| FBgn0041581 | AttB | 3.57E−22 | 6.35E−20 | 7.29 |
| FBgn0041579 | AttC | 6.39E−12 | 3.55E−10 | 4.28 |
| FBgn0010388 | Dro | 5.28E−19 | 6.99E−17 | 20.84 |
| FBgn0034329 | IM1 | 3.01E−04 | 3.68E−03 | 10.61 |
| FBgn0051217 | modSP | 2.21E−03 | 1.90E−02 | 1.44 |
| FBgn0014865 | Mtk | 2.40E−16 | 2.28E−14 | 14.89 |
| FBgn0010441 | pelle | 6.80E−03 | 4.71E−02 | 1.38 |
| FBgn0035975 | PGRP-LA | 8.72E−08 | 2.72E−06 | 2.91 |
| FBgn0035976 | PGRP-LC | 3.88E−03 | 3.02E−02 | 1.45 |
| FBgn0043577 | PGRP-SB2 | 2.50E−05 | 4.16E−04 | 3.45 |
| FBgn0043575 | PGRP-SC2 | 4.05E−20 | 6.12E−18 | 3.30 |
| FBgn0032006 | Pvr | 3.74E−06 | 7.62E−05 | 1.72 |
| FBgn0015295 | shark | 3.56E−03 | 2.84E−02 | 1.45 |
| FBgn0028396 | TotA | 7.74E−40 | 5.41E−37 | 13.61 |
| FBgn0038838 | TotB | 6.43E−34 | 3.15E−31 | 10.93 |
| FBgn0044812 | TotC | 2.07E−08 | 7.15E−07 | 2.75 |
| FBgn0046685 | Wsck | 4.93E−06 | 9.76E−05 | 1.78 |
FDR, false discovery rate; FC, fold change.
| FlyBase gene ID | Gene name | P-value | FDR | FC Svpi/+ |
|---|---|---|---|---|
| FBgn0012042 | AttA | 8.98E−27 | 2.44E−24 | 6.00 |
| FBgn0041581 | AttB | 3.57E−22 | 6.35E−20 | 7.29 |
| FBgn0041579 | AttC | 6.39E−12 | 3.55E−10 | 4.28 |
| FBgn0010388 | Dro | 5.28E−19 | 6.99E−17 | 20.84 |
| FBgn0034329 | IM1 | 3.01E−04 | 3.68E−03 | 10.61 |
| FBgn0051217 | modSP | 2.21E−03 | 1.90E−02 | 1.44 |
| FBgn0014865 | Mtk | 2.40E−16 | 2.28E−14 | 14.89 |
| FBgn0010441 | pelle | 6.80E−03 | 4.71E−02 | 1.38 |
| FBgn0035975 | PGRP-LA | 8.72E−08 | 2.72E−06 | 2.91 |
| FBgn0035976 | PGRP-LC | 3.88E−03 | 3.02E−02 | 1.45 |
| FBgn0043577 | PGRP-SB2 | 2.50E−05 | 4.16E−04 | 3.45 |
| FBgn0043575 | PGRP-SC2 | 4.05E−20 | 6.12E−18 | 3.30 |
| FBgn0032006 | Pvr | 3.74E−06 | 7.62E−05 | 1.72 |
| FBgn0015295 | shark | 3.56E−03 | 2.84E−02 | 1.45 |
| FBgn0028396 | TotA | 7.74E−40 | 5.41E−37 | 13.61 |
| FBgn0038838 | TotB | 6.43E−34 | 3.15E−31 | 10.93 |
| FBgn0044812 | TotC | 2.07E−08 | 7.15E−07 | 2.75 |
| FBgn0046685 | Wsck | 4.93E−06 | 9.76E−05 | 1.78 |
FDR, false discovery rate; FC, fold change.
Svp interacts with EcR in the larval fat body
In addition to sharing common targets, Svp has been shown to interact with EcR’s partner USP and its cognate response element EcRE, acting as a negative regulator (Zelhof et al. 1995; Miura et al. 2002). EcR is in turn known to negatively regulate the insulin signaling pathway at the biochemical and gene expression levels, inhibiting PI3K activity and promoting dFOXO and 4E-BP expression (Colombani et al. 2005; Francis et al. 2010). Therefore, we hypothesized that reducing Svp expression in the fat body would increase EcR-dependent transcription at a developmental stage when 20E and EcR activity are typically very low (Kozlova and Thummel 2000, 2002). As expected, EcRE-dependent lacZ expression (White et al. 1997) was undetectable in mid-third instar EcRE-lacZ larvae (Figure 6, A and B). Reduction of Svp using an svpae heterozygote strongly activated the EcRE-lacZ transgene in the fat body as well as in the oenocytes, epidermal cells known to function in lipid mobilization (Figure 6, C and D; Gutierrez et al. 2007). To gain insight into whether Svp might be directly binding to and inhibiting EcR at target gene promoters in the fat body, we selected the top 20 Svpi-increased genes by mRNA count (normalized RPKM, Figure 6E). NHRScan (Sandelin and Wasserman 2005) was used to look for putative nuclear receptor binding sites or response elements (REs) in the promoter regions of these genes using a 1% probably of entering match states with all three repeat configurations (direct, indirect, everted). NHRScan identified many direct repeat (DR) and indirect repeat (IR) REs near the start sites of 15 of 20 putative Svp target genes, especially DR1, DR4, and IR1 elements, consistent with previously identified EcRE motifs (Figure 6E Antoniewski et al. 1996). No everted repeats were detected. Taken together, these data support a model whereby Svp functions during overnutrition to promote insulin signaling by inhibiting EcR activity at its cognate target promoter.
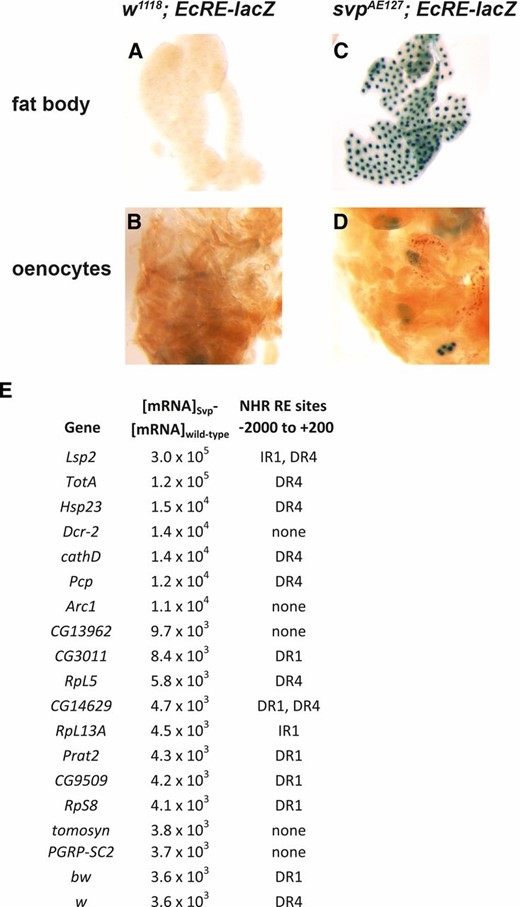
Svp acts as a negative regulator of EcR in fat body and oenocytes. EcRE-lacZ was used as a sensor to assess EcR activity in wild-type and Svp mutant larvae. Larvae were assessed as mid-L3, when EcR activity is typically very low. (A and B) No β-galactosidase activity was detected in wild-type fat bodies or oenocytes. (C and D) Increased β-galactosidase activity was detected in SvpAE127 fat bodies and oenocytes. No staining was observed in other tissues. (E) Putative EcREs in the top 20 Svpi-upregulated genes detected by NHRScan. DR1 is a direct repeat of the 6-NT half site with a 1 NT spacer. DR4 has a 4 NT spacer. IR1 is an inverted repeat with a 1 NT spacer.
Svp may act as a transcriptional repressor of the immune response
Because several immune response genes were upregulated in svpi fat bodies (Table 2) and because some immune response metabolites increased (Figure 3, I–L), we tested the ability of mutants to survive infection by septic injury (Haller et al. 2014). Young adult flies (3–7 days old) reared on 0.15 M sucrose control diets or 0.7 or 1 M sucrose HS diets were injured with a P. aeruginosa inoculum and observed over a period of 1 week. P. aeruginosa is a Gram-negative species with multidrug resistance known to be targeted by some of the peptides and proteins that exhibited Svp-dependent mRNA levels (Table 2; Lemaitre and Hoffmann 2007). Control genotypes reared on 1 M sucrose HS diets exhibited increased overall percent lethality (88.4%) compared with those on the standard 0.15 M sucrose diet (79.5%; P = 0.02, Figure 7A), although the survival curves were not considered different using a log-rank analysis (P = 0.34). A similar increase in infection susceptibility was observed in HS-fed flies in a previous study (Musselman et al. 2017). Loss of Svp seemed to provide a benefit in terms of the immune response (Figure 7B), consistent with the observed gene expression and metabolomics changes. r4-GAL4, UAS-Svpi adults, which could only tolerate 0.7 M sucrose, exhibited an increase in survival after infection, by both t-test (P = 0.0002) and log-rank analysis (P = 0.0005), compared with diet-matched and genetically matched controls (Figure 7B). There was a wide variance in the bacterial load after infection with an apparent increase of bacteria in r4-GAL4, UAS-Svpi flies compared with the control genotype after 1 day, but no significant difference in the number of P. aeruginosa per fly found after 2 days (Figure 7, C and D). Therefore, reducing Svp may contribute to fat body insulin resistance in part by increasing the degree of immune activation, which in turn can reduce insulin signaling [reviewed in Hotamisligil (2017)].
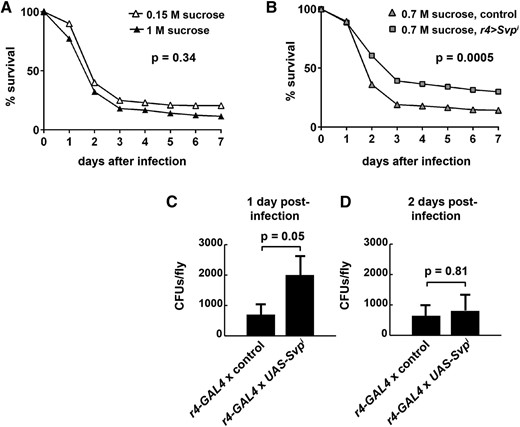
Dietary sugar and Svp both control infection susceptibility. Young adult flies were infected with Pseudomonas aeruginosa via septic injury and survival was measured for 1 week. (A) Comparison of the control genotype reared on control diets (0.15 M sucrose) or HS diets (1 M sucrose). A greater proportion of HS-fed flies succumbed to infection, compared with those fed control diets (88.4% vs. 79.5%, P = 0.02 using a two-tailed student’s t-test; n = 10 vials of 15–25 flies per vial for 0.15 M sucrose and n = 23 vials of 1 M sucrose reared flies). A log-rank survival analysis did not show a significant increase in the death rate after infection due to HS feeding in the control genotype. (P = 0.34 using a Mantel–Cox log-rank test; χ2 0.91, d.f. = 1, hazard ratio = 0.94; n = 159 dead 0.15 M sucrose flies and n = 407 dead 1 M sucrose flies). (B) Fewer Svpi flies succumbed to infection, compared with the control genotype, on 0.7 M sucrose HS diets (70% vs. 85.7%, P = 0.0002 using a two-tailed student’s t-test; n = 22 vials for control and n = 25 vials of r4 > UAS-Svpi flies). Svpi significantly increased survival probability after infection (P = 0.0005 using a log-rank test; χ2 12.26, d.f. = 1, hazard ratio = 1.19; n = 421 dead control genotype flies and n = 353 dead Svpi flies). (C) Bacterial load was quantified 24 hr after septic injury (n = 72 control and 70 Svpi). (D) Bacterial load was quantified 48 hr after septic injury (n = 38 control and 34 Svpi). Error bars are ± SEM. A two-tailed student’s t-test was used to determine P-values.
Discussion
Here, we describe a new role for Svp as a positive regulator of insulin signaling in the larval fat body. Known primarily as a photoreceptor cell fate gene, loss of Svp in the developing eye leads receptor cells R1, 3, 4, and 6 to assume an R7 fate in the developing ommatidium (Mlodzik et al. 1990; Hiromi et al. 1993). Svp also plays an important role in the development of the Drosophila heart (Lo and Frasch 2001; Ryan et al. 2007). Based on expression studies in our laboratory and others (Hoshizaki et al. 1994, 1995) and the central role of Svp in our GRN, we targeted this gene in the larval fat body to look for an interaction between the Svp and dInR pathways. Striking phenotypes were observed when Svp was knocked down in HS-fed, insulin-resistant fat bodies, where Svp promoted glucose clearance, lipid turnover, and insulin signaling. Because Svp is a transcription factor, we looked to its transcriptional targets to understand its function. This led us to identify a new role for Svp in the immune response.
Our evidence supports a model where Svp promotes insulin signaling in the larval fat body. Svp loss-of-function reduces fat body dAkt phosphorylation in response to insulin, suggesting that Svp is required for insulin sensitivity under chronic HS feeding conditions. Svp knockdown phenotypes were similar to those observed when dInR was knocked down in the larval fat body (Musselman et al. 2017). RNAi of either dInR or Svp increased lipid storage droplet size while reducing growth and developmental rate in HS-fed larvae, suggesting overlapping functions for the two proteins. When dInR is knocked down, Svp expression increases, and when dInR is activated, Svp expression decreases (Musselman et al. 2017), suggesting that a compensatory transcriptional mechanism may increase Svp expression in an attempt to restore dInR-dependent signaling pathways and fat body cellular homeostasis. An analogous compensatory role has been observed for an orthologous mammalian transcription factor, COUP-TFII. In rat insulinoma cells, insulin reduces COUP-TFII expression and overexpression of COUP-TFII reduces insulin secretion (Perilhou et al. 2008). COUP-TFII also seems to control lipid homeostasis. Its expression is inversely correlated with obesity in ob/ob mouse adipose and liver according to the Attie laboratory Diabetes Database at http://diabetes.wisc.edu/ (Keller et al. 2008), a transcriptional change which could be contributing to obesity or its complications. Consistent with this, a COUP-TFII interfering RNA was recently shown to increase adiposity in vitro and in vivo using 3T3 preadipocytes and a mouse model (Scroyen et al. 2015). In the Drosophila model, metabolomics studies of HS-fed fat bodies revealed changes in lipid homeostasis upon Svp knockdown. In particular, lipids of 18 carbons in length accumulated in fat bodies when Svp was reduced, including the cold-induced lipokine 12, 13-diHOME, which was recently shown to stimulate lipid turnover and cellular respiration (Lynes et al. 2017). Taken together, these studies are consistent with a conserved role for the NR2F family in acting to fine-tune lipid homeostasis during metabolic disease.
We hypothesize that Svp regulates insulin signaling, at least in part, by competing with another nuclear receptor, EcR. Svp binds EcR’s partner nuclear receptor Ultraspiracle and Svp also binds weakly to some EcREs (Zelhof et al. 1995; Miura et al. 2002), providing a potential mechanism of action for Svp that is supported by our study. A number of Svp-dependent fat body mRNAs are also both EcR- and HS-dependent, suggesting these pathways overlap with respect to their regulatory mechanisms. HS-induced insulin resistance could increase levels of the EcR coactivator dDOR, so that Svp becomes critical to prevent overactivation of EcR, which in the context of Svp loss-of-function further reduces insulin signaling (Colombani et al. 2005; Francis et al. 2010). In vitro studies have shown that Svp can inhibit EcR transactivation (Zelhof et al. 1995), consistent with a competitive binding model for the orthologous mammalian COUP-TF (NR2F) family members (Cooney et al. 1992; Kliewer et al. 1992). Our results demonstrated a suppressive effect of Svp on EcR in vivo in the larval fat body: loss of Svp increased the activity of an EcRE reporter gene in the mid-third instar, when EcR activity is typically very low. EcR activation, in turn, is known to negatively regulate insulin signaling via the transcription factor dFOXO (Colombani et al. 2005). We propose that one way in which Svp promotes insulin sensitivity is by keeping EcR signaling low when ecdysone levels are below a certain threshold. Glucose and lipid metabolism could be pathways in which the Svp, HS, EcR, and insulin signaling pathways interact at the biochemical level. Both fat body Svp and EcR RNAi led to lethality on the 1 M sucrose HS diet, as did fat body dInR RNAi (Musselman et al. 2017). In addition to fat body, Svp also reduced ecdysone signaling in another tissue involved in the maintenance of systemic lipid homeostasis, the oenocytes. Therefore, it is possible that Svp interacts with dInR and EcR to control metabolism in both the fat body and oenocytes.
Another pathway overrepresented in our RNA-seq differential expression data from Svpi fat bodies was the immune response pathway. The Drosophila fat body plays a key role in the expression of antimicrobial peptides and in hemocyte biogenesis during immune activation (Schmid et al. 2014, 2016; Vanha-Aho et al. 2015; Yang and Hultmark 2016). We found that loss of Svp led to increased expression of immune genes and improved immune function using the septic injury infection model. Data from our laboratory and others have shown an antagonistic relationship between insulin signaling and the Drosophila immune response (DiAngelo et al. 2009; Becker et al. 2010; Musselman et al. 2017); however, Svp has not previously been implicated in this pathway. We hypothesize that Svp helps to promote insulin signaling in WT, HS-fed animals in part, by acting as a repressor of immune gene expression. NR2F6, one of three mammalian Svp paralogs, reduces T cell numbers and function in rodents, consistent with our results (Hermann-Kleiter and Baier 2014; Ichim et al. 2014). Conversely, the EcR ligand 20E enhances the immune response in the silkworm Bombyx mori (Sun et al. 2016). Based on these data, we propose a potentially conserved mechanism by which Svp or orthologous nuclear receptors promote insulin signaling during overnutrition by limiting the immune response. Consistent with this model, clinical studies have shown that infections and inflammation increase insulin resistance (Yki-Järvinen et al. 1989; Hui et al. 2003; Fernández-Real et al. 2006; Reeds et al. 2006), and insulin resistance increases susceptibility to several types of bacterial, viral, and fungal infections (Shah and Hux 2003; Magliano et al. 2015). Another nuclear receptor, the mammalian glucocorticoid receptor, also serves to link the immune and insulin pathways; glucocorticoids reduce inflammation and can promote insulin resistance (Tomlinson and Stewart 2007). NF-κB, a conserved immune regulator whose targets were differentially expressed in Svpi fat bodies, is also a probable link between inflammation and insulin signaling (Hotamisligil et al. 1993; Arkan et al. 2005; Becker et al. 2010).
Several nuclear receptors play important roles in metabolism, and there are numerous conserved structural and functional features between the fly and human homologs (King-Jones and Thummel 2005). Nuclear receptor ligands are typically small, hydrophobic lipids or hormones likely to be products or intermediates in metabolic pathways (Sladek 2011). Svp is considered an orphan receptor: its ligand remains unknown. No ligands have been identified for the orthologous receptors in mammals, known as COUP-TFI (NR2F1), COUP-TFII (NR2F2), and EAR-2 (NR2F6). Interestingly, COUP-TF expression is reduced in adipose of obese mice (Ferrara et al. 2008; Keller et al. 2008), possibly contributing to insulin resistance. Conditional reduction of COUP-TFII in pancreatic β-cells led to glucose intolerance and peripheral insulin resistance (Bardoux et al. 2005), although heterozygous COUP-TFII mice have improved glucose tolerance and insulin sensitivity (Li et al. 2009), suggesting a complicated interplay between tissues and/or paralogs in the mouse model. We hypothesize that HS feeding increases the concentration of the Svp ligand, activating its target genes. An Svp or NR2F ligand might have the combined effects of increased insulin signaling and increased lipid turnover, both of which are expected to benefit tissues in the face of caloric overload. Accordingly, a Svp or NR2F ligand is a potential therapeutic for obesity-associated metabolic disease. Metabolomics studies highlighted the accumulation of several potential ligands in HS-fed and Svp loss-of-function fat bodies. Future studies will search for the Svp ligand and will explore how Svp fits into the fat body metabolic network during overnutrition.
Acknowledgments
We thank Sophia Tsai, Carl Thummel, Anthony Fiumera, Matthew Pereira, and Bryon Tuthill for helpful discussions, and Cláudia Nogueira Hora Marques for assistance with microbiology. We are grateful to Michael Hoch for UAS-Svp flies, to the Vienna Drosophila Resource Center and Bloomington Drosophila Resource Center for other Drosophila stocks, and to Washington University’s Genome Technology Access Center for RNA-seq analyses. This research was supported by National Institutes of Health grants 5K12HD001459-12 and P60DK020579-34 (L.P.M.), Children’s Discovery Institute grant MD-II-2010-41 (M.R.B. and T.J.B.), Washington University (T.J.B.), and Binghamton University startup funds (L.P.M.).
Author contributions: L.P.M. designed research studies, conducted experiments, acquired data, analyzed data, and wrote the manuscript. T.J.B. and M.R.B. designed research studies and wrote the manuscript. E.J.M. and J.L.F. designed research studies, conducted experiments, acquired data, and analyzed data. J.A.G. analyzed data. The authors do not have any conflicts of interest with any other entity.
Footnotes
Communicating editor: B. Lazzaro
Supplemental material is available online at www.genetics.org/lookup/suppl/doi:10.1534/genetics.118.300770/-/DC1.
