


Abstract
X and Y chromosomes differ in effective population size (Ne), rates of recombination, and exposure to natural selection, all of which can affect patterns of genetic diversity. On Y chromosomes with suppressed recombination, natural selection is expected to eliminate linked neutral variation, and lower the Ne of Y compared to X chromosomes or autosomes. However, female-biased sex ratios and high variance in male reproductive success can also reduce Y-linked Ne, making it difficult to infer the causes of low Y-diversity. Here, we investigate the factors affecting levels of polymorphism during sex chromosome evolution in the dioecious plant Rumex hastatulus (Polygonaceae). Strikingly, we find that neutral diversity for genes on the Y chromosome is, on average, 2.1% of the value for their X-linked homologs, corresponding to a chromosome-wide reduction of 93% compared to the standard neutral expectation. We demonstrate that the magnitude of this diversity loss is inconsistent with reduced male Ne caused by neutral processes. Instead, using forward simulations and estimates of the distribution of deleterious fitness effects, we show that Y chromosome diversity loss can be explained by purifying selection acting in aggregate over a large number of genetically linked sites. Simulations also suggest that our observed level of Y-diversity is consistent with the joint action of purifying and positive selection, but only for models in which there were fewer constrained sites than we empirically estimated. Given the relatively recent origin of R. hastatulus sex chromosomes, our results imply that Y-chromosome degeneration in the early stages may be largely driven by selective interference rather than by neutral genetic drift of silenced Y-linked genes.
MORPHOLOGICALLY distinct sex chromosomes have evolved multiple times independently in plants and animals (Westergaard 1958; Ohno 1969; Bull 1983; Charlesworth 1991, 2015). Despite clear biological differences between these kingdoms, X and Y chromosomes in both lineages have undergone similar genetic changes. In each kingdom, the loss of recombination between X and Y chromosomes is associated with an accumulation of deleterious mutations and a gradual loss of functional genes from the Y chromosome (Bachtrog 2013; Hough et al. 2014; Bergero et al. 2015), and, in some species, such genetic degeneration has also led to the evolution of dosage compensation on the X chromosome (Charlesworth 1996; Mank 2009; Muyle et al. 2012; Papadopulos et al. 2015). The independent evolution of these phenomena in such taxonomically distant groups as mammals and flowering plants suggests that general evolutionary mechanisms are involved, but inferring the causes of molecular evolution and patterns of polymorphism in genomic regions that lack recombination is a longstanding challenge for both theoretical and experimental biologists (Eshel and Feldman 1970; Charlesworth 1978; Feldman et al. 1980; Barton 1995; Nordborg et al. 1996; Otto and Feldman 1997).
One fundamental difference between X and Y chromosomes is that there are one-third as many Y-linked gene copies as X-linked gene copies in a diploid population. Therefore, genes on the Y chromosome are expected to experience an effective population size (Ne) that is one-quarter that of autosomal genes, and one-third that of X-linked genes (assuming an equal number of reproducing females and males). The lowered Ne of the Y chromosome implies that the level of neutral polymorphism maintained at equilibrium, proportional to the product of Ne, and the neutral mutation rate, μ, should be lower for Y-linked genes than for their X-linked counterparts. In the absence of recombination, genes on the Y chromosome are also expected to be in strong linkage disequilibrium, making them vulnerable to diversity loss due to selection against strongly deleterious mutations (background selection; Charlesworth et al. 1993) and selective sweeps of strongly beneficial mutations (genetic hitchhiking; Maynard Smith and Haigh 1974). Furthermore, the build-up of genetic associations among selected mutations (fitness covariance) on the Y means that selection will act nonindependently across the chromosome, such that selection at a focal site may “interfere” with selection at linked sites (Hill and Robertson 1966). A large body of work has now shown that selective interference is expected to reduce both the efficacy of selection and the equilibrium level of neutral variability (Fisher 1930; Muller 1964; Hill and Robertson 1966; McVean and Charlesworth 2000; Kaiser and Charlesworth 2009; Good et al. 2014), with the magnitude of the effect depending on the number of sites experiencing selection. These arguments all suggest that large nonrecombining Y chromosomes with many linked selected sites should harbor a lower amount of neutral variability than predicted based on the number of Y chromosomes in a population (one-quarter that of autosomes). However, the relative importance of neutral and selective factors in reducing chromosome-wide levels of diversity is not well understood in most systems.
In addition to reduced diversity arising from selection, in species with female-biased sex ratios or extensive male–male competition, high variance in male reproductive success is also expected to reduce the Ne experienced by genes on the Y chromosome (Caballero 1995; Charlesworth 2002; Laporte and Charlesworth 2002; Ellegren 2009), suggesting that inferences about the effects of linked selection need to be distinguished from these processes. Because variance in male reproductive success differentially affects the Ne of X, Y, and autosomal chromosomes (Kimura and Crow 1964; Nomura 2002), evidence for this can be obtained by comparing levels of silent site variability on X and Y chromosomes relative to that on autosomes. For example, variance in male reproductive success reduces male Ne, which reduces the Y/A diversity ratio relative to the neutral expectation (1/4), but also causes an increase in the X/A ratio. Based on such comparisons, studies in humans, for example, have suggested that the observation of an inflated X/A ratio can be explained by an historical excess of breeding females compared to males (Bustamante and Ramachandran 2009; Hammer et al. 2010; Cotter et al. 2016).
Despite widespread interest in determining the evolutionary factors that affect neutral diversity on sex chromosomes (Ellegren 2009; Bachtrog 2013), we still know very little about how sex-ratio variation or selective processes have affected levels of diversity on more recently evolved sex chromosomes. The time scales over which these processes are likely to be important are therefore not well understood. In humans, estimates of silent site diversity on the Y are considerably lower than predicted under neutral evolutionary models, and simulations suggest that observed levels of diversity are consistent with the action of extensive purifying selection (Wilson Sayres et al. 2014). However, given that human sex chromosomes originated ∼200 million years ago (MYA) (Lahn and Page 1999; Ross et al. 2005), it is not clear whether purifying selection might have had a similarly strong effect on Y chromosomes that arose much more recently, e.g., within the last ∼20 MYA in the case of dioecious plants (Charlesworth 2015).
Simulations of strong selection models (background selection and genetic hitchhiking) suggest that these processes may have the greatest effects during the earliest stages of sex chromosome evolution, before the Y has lost many of its genes (Bachtrog 2008). Moreover, theory suggests that even weak purifying selection, when aggregated over a large number of genetically linked sites, can generate strong deviations from neutrality, whereas classic background selection theory breaks down in such cases (McVean and Charlesworth 2000; Comeron and Kreitman 2002; Comeron and Guthrie 2005; Kaiser and Charlesworth 2009; Good et al. 2014). Given that a large number of selected sites are likely to be in linkage disequilibrium on a recently evolved Y chromosome, such interference selection is a priori likely to be a strong force affecting the evolution of young plant sex chromosomes. However, if there has been widespread gene silencing during the early stages of Y-chromosome evolution, as in Drosophila albomicans (Zhou and Bachtrog 2012), then diversity loss might be expected to be less severe on younger Y chromosomes. That is, if Y-linked gene silencing occurs early during sex chromosome evolution due to dosage compensation, heterochromatin formation caused by repetitive element accumulation, and/or loss of regulatory elements, then few sites may be under selection, and Y chromosome degeneration may be driven primarily by genetic drift rather than selective interference. Understanding the relative importance of inefficient selection and neutral genetic drift during Y chromosome evolution is therefore a major open issue.
To investigate the factors affecting nucleotide diversity in the early stages of sex chromosome evolution, we analyzed neutral polymorphism levels on X, Y, and autosomal chromosomes in the plant Rumex hastatulus (Polygonaceae). This species is a dioecious annual with heteromorphic X and Y chromosomes that originated ∼15 MYA (Navajas-Pérez et al. 2005; del Bosque et al. 2011; Grabowska-Joachimiak et al. 2015), making Y chromosomes in this species over 100 million years younger than the highly degenerated Y chromosomes in mammals (Lahn and Page 1999; Ross et al. 2005). R. hastatulus has also received particular attention because of the occurrence of an interesting polymorphism in sex chromosome system, in which both XY and XY1Y2 male genotypes occur in geographically distinct populations (Smith 1955, 1963, 1964, 1969). The derived XY1Y2 sex chromosome system in this species is thought to have originated through an X-autosome fusion, with the current XY system maintaining the ancestral chromosome complement (Smith 1964). Interestingly, despite the relatively recent origin of sex chromosome polymorphism in R. hastatulus, there is evidence that both the ancestral and neo-Y-chromosomes have undergone gene loss and functional deterioration (Hough et al. 2014; Crowson et al. 2017). Here, to ensure that our estimates of polymorphism levels on X, Y, and autosomes are not biased by nonequilibrium conditions arising from the X-autosome fusion, we focus only on the XY system with the ancestral chromosome complement.
Of particular relevance to our study, R. hastatulus populations exhibit female-biased reproductive sex ratios, with an estimated mean sex ratio of 0.62 (Pickup and Barrett 2013). Indeed, the occurrence of female-biased sex ratios in dioecious flowering plants has been found to be more common in species with heteromorphic X and Y chromosomes than in those with homomorphic sex chromosomes (Field et al. 2013; Hough et al. 2013). In R. hastatulus, the availability of field measurements of sex-ratio variation thus provides an opportunity to test both neutral and selective models of Y-chromosome diversity loss during sex chromosome evolution.
Materials and Methods
Population samples and sex-linked genes
We analyzed sex-linked and autosomal genes identified from Illumina RNA sequence data from 12 population samples (one male and one female from each of six populations). Samples were collected in 2010 from throughout the native range of the XY sex chromosome system in R. hastatulus (locations in Supplemental Material, Table S1 in File S1), and plants were grown in the glasshouse at the University of Toronto from seeds collected from open-pollinated females. We extracted RNA from leaf tissue using Spectrum Plant Total RNA kits (Sigma-Aldrich). Isolation of mRNA and cDNA synthesis followed standard Illumina RNAseq procedures, and sequencing was conducted on two Illumina HiSeq lanes with 150-bp paired-end reads at the Genome Quebec Innovation Centre. Reads from these samples were mapped to a R. hastatulus female reference transcriptome (Hough et al. 2014) using the Burrows-Wheeler Aligner (Li and Durbin 2010), followed by Stampy (Lunter and Goodson 2011). We used Picard tools (http://picard.sourceforge.net) to process mapping alignments, and identified SNPs using the Unified Genotyper from the Genome Analysis Toolkit variant calling software (McKenna et al. 2010). We filtered SNPs with quality scores <60, and required each sample to have coverage >10×, and individual genotype quality (GQ) scores at SNP sites >30. These filters were imposed to decrease errors associated with heterozygous SNP calling and phasing of sex-linked genes. The RNAseq data from these population samples were previously reported (Hough et al. 2014), where they were used to validate the ascertainment of sex-linked genes via segregation analysis; raw sequences are available from the GenBank Short Read Archive under accession no. SRP041588. Here, to focus on sex-linked genes likely to be relatively older and closer to equilibrium, we focused on the previously described set of 460 X/Y genes for which a Y homolog was found in both sex chromosome systems (i.e., X/Y genes where the Y copy was inferred to be on the Y1 chromosome).
Autosomal genes and X-linked genes in females
In evaluating evidence for nucleotide diversity differences between X and Y chromosomes, it is important to distinguish between reduced Y-linked diversity, and the possibility that X-linked diversity is elevated above the level predicted from a neutral model. To do this, we normalized our sex-linked diversity estimates by autosomal diversity, and compared empirical X/A and Y/A nucleotide diversity ratios to those predicted from neutral models and from simulations (described below). Because the criteria for ascertaining autosomal loci in Hough et al. (2014) were based on identifying four segregating SNPs per locus, and since this set of genes is likely to be higher in diversity than the average autosomal gene, here we instead used the larger set of all nonsex-linked (putatively autosomal) genes as our autosomal reference. We filtered this set to remove any genes that may have been sex-linked, but were not identified as such by the conservative ascertainment criteria of Hough et al. (2014). In particular, we removed: (i) any genes in which there was evidence for at least one SNP with a sex-linked segregation pattern; (ii) any genes where SNPs showed fixed heterozygosity in males and fixed homozygosity in females; (iii) genes with <10× coverage or >100× coverage from independently obtained genomic coverage data (F. Beaudry, S. C. H. Barrett, S. I. Wright, unpublished data), to filter out duplicates or genes with highly repetitive sequences; and (iv) any genes containing SNPs with large (>0.4) allele frequency differences between males and females. Finally, we removed genes with <50 filtered synonymous sites to avoid biasing our results toward genes that may have been particularly short due to assembly problems, or particularly low quality following our filtering. This filtering resulted in a final set of 12,356 autosomal genes. We took a similar approach to estimating polymorphism levels for X-linked loci in females for the final filtered set of 172 sex-linked genes (see below).
Phasing X and Y alleles
To estimate polymorphism for X and Y sequences separately in males, it is necessary to infer the phase of SNPs in sex-linked transcripts. In previous work, phasing alleles on R. hastatulus sex chromosomes was achieved using segregation analysis from a genetic cross. Here, to phase SNPs from population samples where such segregation data were unavailable, we used HAPCUT (Bansal and Bafna 2008), a maximum-cut based algorithm that reconstructs haplotypes using sequenced fragments (Illumina read data) from the two homologous chromosomes to output a list of phased haplotype blocks containing the polymorphic variants on each chromosome. Because the resulting haplotype blocks produced by HAPCUT contained SNPs that were phased relative to each other, but not designated to either the X or Y chromosome, we assigned individual variants to X or Y by independently identifying fixed X-Y differences within each haplotype block (i.e., sites where all females were homozygous, and all males were heterozygous). Identifying such fixed differences within phased haplotype blocks enabled us to then infer the correct phase (X or Y) of the polymorphisms from HAPCUT’s output. In particular, this was done by matching the phase of fixed X-Y differences with neighboring polymorphic sites: when a fixed X-Y difference occurred in the same phased haplotype block as a polymorphic site, then the variants in that block were assigned to either X or Y based on the known phase of the fixed difference with which they were matched. SNPs that were identified outside of phased blocks, in blocks where there was evidence of phasing error due to Y-specific SNPs in both haplotypes, or in blocks without fixed X-Y differences, were recorded as missing data. Note that our coverage criteria, and requiring the presence of fixed X-Y differences, also helps minimize the possibility of poor mapping of Y reads due to X-Y divergence and low Y-specific expression. Finally, we filtered out SNPs with quality scores <60, individual genotype quality scores <30, and those within a distance of 10 bp or less from indels. As with the autosomal genes, we also removed genes with <50 synonymous sites.
We further validated the results of HAPCUT’s allele phasing by comparing the accuracy of this method with the phasing-by-segregation method that was conducted in Hough et al. (2014). To do this, we first phased the sequence data from parents and their progeny using HAPCUT’s algorithm (using the same parameters as for the population data), and then identified cases where SNPs were inferred on the Y chromosome by HAPCUT, but where the true level of polymorphism due to family structure (father and sons) was zero. We identified 7% of sex-linked genes that either had phasing errors or genotyping errors. Based on our family-level test for false SNPs, this corresponds to a SNP error rate estimate of 1.7 × 10⁻⁴. Note that this rate is very low relative to population-based estimates of polymorphism on the X and autosomes (Table 1), and therefore should have minimal effects on our estimation of the X/A ratio. Furthermore, we can avoid phasing errors on the X by using diversity estimated from females rather than phased males. In fact our synonymous diversity estimate on the X from phased males (0.00472) is very close to that estimated from females (0.00453, Table 1), with the difference between them nearly equal to the estimated SNP error rate on the Y from the family data. However, because this error rate is high relative to the expected level of polymorphism on the Y chromosome, and we do not have an equivalent unphased comparison for the Y, we conducted a further filtering step for phased Y-linked SNPs and identified false positive SNP calls arising from: (i) phasing errors caused by gene duplicates (more than two haplotypes), (ii) polymorphisms around indels, and (iii) genotyping errors caused by low Y-expression. This final filtering was conducted by manually checking each individual putative polymorphism on the Y chromosome using Integrative genomics viewer (IGV; Robinson et al. 2011). Genes with identified SNP calling errors on the Y were removed, and following all filtering procedures we were left with a set of 173 sex-linked genes for further analysis.
Observed and expected neutral polymorphism at silent sites (θsyn) on sex chromosomes and autosomes in R. hastatulus
| Chromosome | Observed θsyn | Expected θsyn |
|---|---|---|
| Autosome | 0.0055 | 0.0055 |
| X | 0.0045 (X/A = 0.82) | 0.0041 (X/A = 0.75) |
| Y | 0.0001 (Y/A = 0.018) | 0.0014 (Y/A = 0.25) |
| Chromosome | Observed θsyn | Expected θsyn |
|---|---|---|
| Autosome | 0.0055 | 0.0055 |
| X | 0.0045 (X/A = 0.82) | 0.0041 (X/A = 0.75) |
| Y | 0.0001 (Y/A = 0.018) | 0.0014 (Y/A = 0.25) |
Values in parentheses indicate the observed and expected diversity values on sex chromosomes relative to autosomes, where expected values assume neutrality and equal sex ratios (Figure 1).
| Chromosome | Observed θsyn | Expected θsyn |
|---|---|---|
| Autosome | 0.0055 | 0.0055 |
| X | 0.0045 (X/A = 0.82) | 0.0041 (X/A = 0.75) |
| Y | 0.0001 (Y/A = 0.018) | 0.0014 (Y/A = 0.25) |
| Chromosome | Observed θsyn | Expected θsyn |
|---|---|---|
| Autosome | 0.0055 | 0.0055 |
| X | 0.0045 (X/A = 0.82) | 0.0041 (X/A = 0.75) |
| Y | 0.0001 (Y/A = 0.018) | 0.0014 (Y/A = 0.25) |
Values in parentheses indicate the observed and expected diversity values on sex chromosomes relative to autosomes, where expected values assume neutrality and equal sex ratios (Figure 1).
Estimating nucleotide diversity on sex chromosomes and autosomes
For each locus in our analysis, we calculated Watterson’s (1975) estimator of the population parameter where Ne is the effective population size, and μ is the per-base mutation rate per-generation, using a modified version of the Perl program Polymorphurama (Bachtrog and Andolfatto 2006). We also used Polymorphurama to calculate the average pairwise differences πsyn and Tajima’s D at synonymous sites (Tajima 1989). To compare sex-linked and autosomal loci, we calculated the average value of for each chromosome type, weighted by the number of synonymous sites in each gene (Figure 2). We obtained 95% confidence intervals for X/A and Y/A ratios by bootstrapping per gene using the BCa method (Efron and Tibshirani 1994) implemented in the Boot package in R (Canty and Ripley 2012), and calculating X/A and Y/A on each iteration for 20,000 replicates each. Bootstrapping was conducted on the final filtered set of 173 sex-linked and 12,355 autosomal genes.
Note that the lack of recombination on the Y chromosome implies that statistical assumptions about independence across loci are violated, suggesting that the true uncertainty in the Y/A estimate may be wider than implied by bootstrapping. To address this, we also used a maximum likelihood approach (Wright and Charlesworth 2004) to independently estimate a credibility interval for the Y/A ratio (Figure S1 in File S1). Because of the thousands of genes involved, a likelihood method incorporating divergence to control for heterogeneity in mutation rate was not feasible, as this would require maximizing the likelihood estimate of the mutation rate for each locus independently. However, previous analysis of divergence data did not suggest that chromosomal differences in synonymous divergence contribute greatly to diversity heterogeneity (see Results and Discussion). Therefore, we assumed no heterogeneity in mutation rate, no recombination between Y-linked genes, and free recombination between autosomal loci. Our model thus had two parameters: our estimate of Watterson’s theta for autosomal genes, and f, the ratio of effective population size of the Y chromosome to autosomes. We varied both parameters and evaluated the likelihood for f from 0.001 to 1, and per base pair from 0.001 to 0.01. In particular, we evaluated the likelihood of and f, given (i) the observed number of synonymous segregating sites for each i of n autosomal loci, Si, (ii) the number of segregating sites on the Y chromosome, SY, and (3) the total number of sites per locus (Li and LY). The likelihood of ( f) is given by:
Neutral predictions and the effect of sex ratio bias on diversity
Simulations of purifying selection
To study the effects of purifying selection on expected levels of Y-chromosome diversity, we conducted forward-time simulations of haploid Y chromosomes under a multiplicative selection model using the software SFS_CODE (Hernandez 2008). We first estimated the distribution of fitness effects of deleterious amino acid mutations from our polymorphism data for X-linked genes using the method of Keightley and Eyre-Walker (2007), which fits a gamma distribution of negative selection coefficients to the observed frequency distribution of nonsynonymous and synonymous polymorphisms. This analysis estimated a mean strength of selection (Ns) of 493, and a shape parameter of 0.258 for the X chromosome. Rescaling the effective population size for the Y chromosome assuming a sex ratio of 0.6 gives a mean Ns for the Y of 493 × 0.259 = 128. We used this estimated gamma distribution to parameterize forward simulations, initializing them with our estimated θaut (Table 1), adjusted to reflect the neutrally expected NeY for a sex ratio of r = 0.6 (θY = 0.0011). To match our sample size and the number of synonymous sites sampled from our data (see File S1), the simulations sampled six haploid chromosomes, and the genome sequence contained 45,331 bp of linked neutral sequence from which we calculated silent site diversity, πs. To increase computational speed, we simulated a population of 500 haploid chromosomes. For each parameter set, we conducted replicate simulations (see below) and calculated πs for each replicate.
To examine the expected reduction in diversity, we ran simulations over a range of values of L (the number of sites under selection), up to a maximum of 5 × 10⁶, with 50,000 replicate simulations per parameter set. To obtain an estimate of L, we then calculated the approximate likelihood of our observed data based on the proportion of simulations in which πs was <0.00011 and >0.00009, based on our empirical estimate (Table 1). In addition, we evaluated the fit of these simulated estimates to a summary of our observed allele frequency spectrum by calculating the combined likelihood of the observed number of segregating silent sites and the number of singletons.
Simulations including positive selection
We also considered the possibility of positive selection playing a role in the loss of diversity on the Y chromosome. To do this, we modified the above simulations to include a proportion of functional sites subject to positive selection, with the remaining proportion subject to the purifying selection parameters described above. We evaluated the likelihood of our observed diversity reduction by varying the proportion of sites under positive selection from 0 to 0.005, as well as the total number of functional sites, L (over a grid of values ranging from 50,000 to 1,300,000 bp), and ran 20,000 replicate simulations per parameter set. We assumed a gamma distribution of positive selection coefficients with the same strength and shape as our distribution of deleterious fitness effects described above.
Data availability
Sequence data are available from the Sequence Read Archive (SRA) under accession SRP041588. Code and software are available at https://github.com/houghjosh/XYdiversity.
Results and Discussion
Extensive loss of Y-chromosome diversity
Our analysis of polymorphism levels across the genome of the dioecious plant R. hastatulus revealed a widespread loss of neutral diversity from the Y chromosome (Figure 2 and Table 1). In particular, neutral diversity for Y-linked genes was, on average, ∼2.2% of the value for their homologs on the X chromosome. Taking one-quarter of the mean autosomal diversity as the equilibrium expectation for θY under neutrality (Wright 1931), this corresponds to a chromosome-wide reduction of 93% relative to the standard neutral model. Note that by normalizing X and Y diversity estimates by autosomal diversity levels, our results indicate that the difference between X and Y homologs is not due to an elevation of diversity on the X chromosome, but a Y-specific reduction. Interestingly, our results also suggest an elevation of X-linked diversity (X/A = 0.85) compared to the neutral prediction (X/A = 0.75), though the confidence intervals on this estimate are wide, ranging from 0.74 to 0.95 (Figure 2). Given the empirically estimated sex ratio of ∼0.6 in R. hastatulus (Pickup and Barrett 2013), however, the X/A elevation we observed is not unexpected; the neutrally predicted X/A ratio for a sex ratio of 0.6 is ∼0.8 (Figure 1). The frequency spectra of variant sites of X, Y, and autosomal loci, as quantified by mean Tajima’s D at synonymous sites are similar (X, −0.43; Y, −0.34; Autosomal, −0.27). Although our estimates of diversity have not been normalized by divergence, previous work has shown that the average synonymous substitution rate, between R. hastatulus and the nondioecious outgroup Rumex bucephalophorus is comparable for sex-linked (0.2016) and autosomal genes (0.219), and we found no evidence for significant differences in substitution rate between Y and X chromosomes (Hough et al. 2014). It is therefore unlikely that our results are caused by mutation rate differences between sex-linked and autosomal genes.
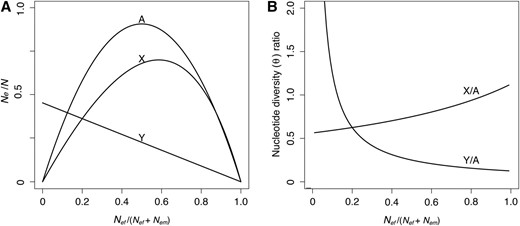
(A) Normalized effective population sizes at equilibrium for genes on autosomes, X chromosomes, and Y chromosomes as a function of the sex ratio. (B) The corresponding X/A and Y/A ratios of nucleotide diversity predicted at equilibrium, assuming equal neutral mutation rates for sex-linked and autosomal genes.
Female-biased sex ratios and variance in male reproductive success
The occurrence of female-biased sex ratios in R. hastatulus is expected to lower Y diversity through a reduction in male Ne, and, thus, a reduction in the Ne of the Y chromosome. Male Ne could be further reduced by high variance in male reproductive success, which is expected in annual wind-pollinated plants such as R. hastatulus that commonly exhibit extensive phenotypic plasticity in plant size and flower production. Given that male plants in this species produce large amounts of pollen, and female flowers are uniovulate, there may indeed be strong competition among males to fertilize ovules. Such competition should cause a proportional increase in X-linked diversity to a level that is close to (or even higher than) levels of autosomal diversity (Caballero 1995), while simultaneously reducing Y-linked diversity. In common with most flowering plants, however, we do not have marker-based estimates of variance in male reproductive success in R. hastatulus. We therefore tested whether an overall reduction in male Ne, arising either from high variance in male reproductive offspring number and/or a female biased population sex ratio, could explain our observed Y/A and X/A ratios, by comparing our data to neutral predictions across the full range of values for the Ne sex ratio, r.
As shown in Figure 2, the expected reduction in Y/A as a function of r is substantially higher than our observed Y/A diversity ratio. Indeed, the lower limit for the Y/A ratio in a neutral model is 1/8, such that, even in the extreme case where r = 0.9, the expectation for Y/A is ∼0.14, which is substantially higher than our estimate of Y/A = 0.018 (Figure 2 and Table 1). Moreover, such large reductions in Nem would also predict levels of X/A diversity that are significantly larger than we observed (Figure 2). Our results therefore indicate that, although reduced male Ne arising from sex-biased demography is expected to contribute to reduced Y chromosome polymorphism, it is insufficient to explain the Y/A reduction we observed.
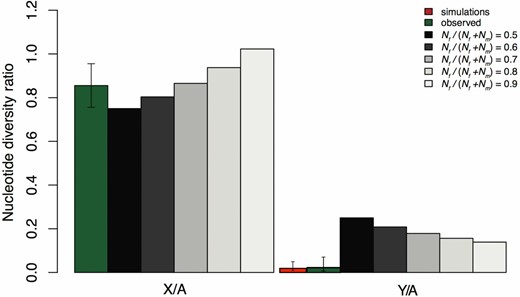
Observed and predicted X/A and Y/A ratios of neutral diversity. Predictions are shown for increasing values of the effective population size sex ratio, Nef / (Nef + Nem). We calculated observed estimates of X/A and Y/A as the average θ across genes, weighted by the number of synonymous sites per gene. We modeled purifying selection using forward simulations, and the simulated Y/A diversity ratio shown was obtained from our maximum likelihood estimate of the number of selected sites (see Materials and Methods), with 95% C.I. obtained from 50,000 replicate simulations. C.I. for observed values were calculated by bootstrapping (20,000 replicates) using the BCa method (Efron 1987) implemented in the Boot package in R (Canty and Ripley 2012). Simulation commands are given in the text in File S1.
Purifying selection
Selection against strongly deleterious mutations is expected to be an important factor reducing genetic variability in regions with low recombination (Charlesworth et al. 1993; Nordborg et al. 1996). The effects of such “background selection” (BGS) have been well studied theoretically (Nordborg et al. 1996; Charlesworth et al. 1997; Kim and Stephan 2000), and the theory has been used to explain patterns of genetic diversity across genomes (Comeron 2014) and plays a central role in explanations for diversity loss on Y chromosomes in mammals (Wilson Sayres et al. 2014) and Drosophila (Charlesworth 1996; McAllister and Charlesworth 1999). Under background selection theory for a Y chromosome, the predicted loss of diversity is modeled as a reduction in the equilibrium Ne such that where f0 = e-U/sh, U is the mutation rate to strongly deleterious variants on the Y, and s and h are selection and dominance coefficients (Hudson and Kaplan 1995).
Importantly, however, standard background selection theory assumes independence among selected sites, and the rescaling of Ne under equilibrium assumptions fails to predict levels of diversity when many linked sites are subject to selection at the same time (Good et al. 2014). This is because widespread linkage disequilibrium causes the behavior of selected alleles to interfere with the action of selection at sites with which they are linked (McVean and Charlesworth 2000; Comeron and Kreitman 2002; Kaiser and Charlesworth 2009; Good et al. 2014). As there are no analytical formulae for predicting the outcome of selection on many linked sites simultaneously experiencing selection and drift, simulations are fundamental to understanding the effects of selective interference in realistic situations (McVean and Charlesworth 2000; Comeron and Kreitman 2002; Comeron et al. 2007; Kaiser and Charlesworth 2009; Good et al. 2014). We therefore conducted forward simulations of purifying selection using our estimated parameters for the distribution of fitness effects of deleterious mutations, and tested whether interference selection could result in a level of Y-diversity at neutral sites similar to the level we observed. Under a model of purifying selection, our maximum likelihood estimate of the number of selected sites, L is large (∼1 Mb), and estimates suggest there may be as many as ∼3 Mb of sites under selection (Figure 3A). We obtain similar conclusions when we fit the data to a summary of the site frequency spectrum (Figure 3B, gray line). Simulations under our maximum likelihood model show a very good fit to our observed loss of diversity (Figure 2). Thus, these results are consistent with the hypothesis that the early stages of Y degeneration are characterized by the retention of a large number of sites subject to purifying selection.
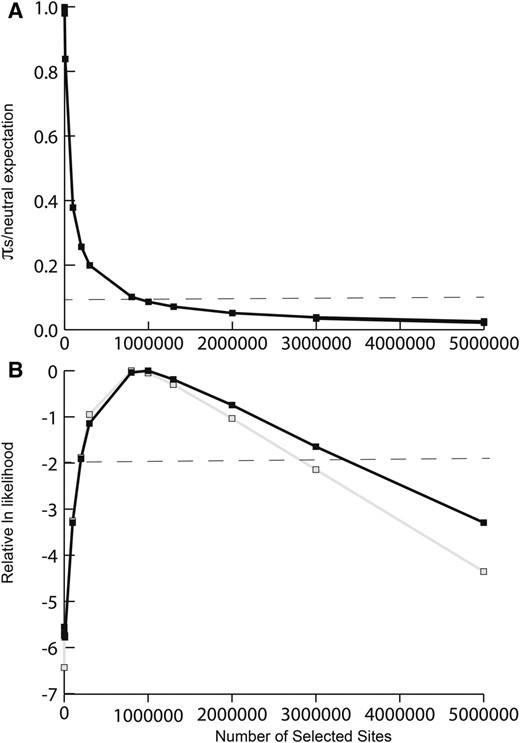
Results from forward simulations of purifying selection, varying the number of sites under selection, L. (A) Estimated silent site diversity πs relative to the neutral prediction π0 as a function of the number of selected sites. The dashed line corresponds to our estimate of diversity loss on the Y chromosome (πY ). (B) the relative likelihood curve for the number of selected sites, with the dashed line reflecting the ∼95% credibility interval. Black line, likelihood surface for the observed πs; gray line, likelihood surface for the observed number of segregating sites and number of singletons.
Although our analyses of purifying selection models are consistent with our observed reduction in Y-linked diversity, it is also possible that beneficial mutations have contributed to diversity loss. However, including a fraction of positively selected sites to the model with the maximum likelihood estimated number of constrained sites (1 Mb) reduces the likelihood (Figure 4), and the overall likelihood surface suggests that a model with purifying selection alone is most consistent with the observed data. On the other hand, with considerably fewer constrained sites, models incorporating a nontrivial fraction of positively selected sites are plausible (Figure 4). However, the most likely parameter space includes models with no beneficial mutations, and so there is no strong statistical support for a significant role of positive selection. Overall, our observed loss of diversity is consistent with an important role for linked selection, with either the effects of purifying selection alone, or the combined effects with positive selection driving the loss of diversity on the Y chromosome.
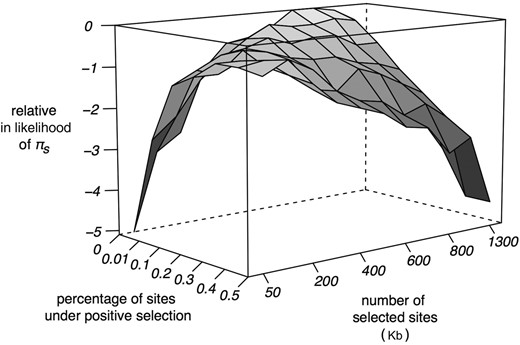
Relative ln-likelihood of πs as a function of the number of selected sites, and the proportion of sites subject to positive selection from forward simulations. Simulations used a mean strength of both positive and purifying selection of Ns = 128.
While clearly approximate, we can ask how these estimates compare to how many selected sites we might expect to be present on the nonrecombining Y chromosome. Our previous estimates based on cytological measurements suggested that there may be roughly 5600 genes on the X chromosome of the XY population (Hough et al. 2014). We also estimated that ∼24% of genes on the Y had degenerated, leaving an estimated 4256 genes. Of the genes we identified in our previous work, 74% have values for dN/dS <1, with a median level of nonsynonymous constraint of 0.72. Using the average number of codons in genes of Arabidopsis thaliana (426) (Haas et al. 2003), assuming 2/3 of codon bases are nonsynonymous, and for every constrained coding base there are 0.29 constrained noncoding sites (Haudry et al. 2013) provides a rough estimate that there may be up to 2.5 million sites under selection on the Y chromosome; a value that is at the higher end of our confidence interval from simulations of purifying selection alone (Figure 3). This would suggest that purifying selection in the absence of positive selection would be the most likely model explaining the loss of diversity (Figure 4). However, this assumes the entire Y chromosome is nonrecombining, which is unlikely given evidence for chiasma formation between the sex chromosomes (Smith 1964) and the absence of fixed differences between X and Y for a subset (12%) of genes with signs of sex linkage (Hough et al. 2014). Nevertheless, even if as much as 50% of the Y is still recombining, this is consistent with a large number of sites (>1 Mb) subject to purifying selection. Thus, although approximate, our independent assessment of the size of the nonrecombining region of the Y chromosome agrees with simulation-based estimates, and supports the suggestion that purifying selection is likely to be acting in aggregate over a large number of selected sites.
One important caveat to our conclusions is that we have not considered the possible effects of background selection and selective sweeps in the recombining regions of the X chromosome and autosomes. Studies in a number of taxa, particularly in humans and maize (Hammer et al. 2010; Beissinger et al. 2016), have shown that diversity on recombining chromosomes increases as a function of distance from genes, likely due to the greater effects of linked selection near regions with a high density of functional sites. Because a nonrecombining Y chromosome will not experience this escape from hitchhiking because of gene distance, our conclusion about diversity loss on the Y may be conservative, and the true loss of diversity may be more extreme in unconstrained regions. In particular, if genome structure and selection parameters in Rumex are comparable to humans, we would predict the most gene-rich regions of recombining chromosomes to experience an ∼60% reduction in diversity (McVicker et al. 2009), implying that our ratio of Y-linked to autosomal diversity in unconstrained regions may be as low as 0.011, compared to the ratio of 0.018 estimated here. While this may imply even stronger effects of background selection and selective sweeps than inferred here, we note that correcting for this may provide an even better fit to the purifying selection model with our independently estimated number of selected sites (Figure 3). Future work integrating whole genome polymorphism data and estimates of the number of selected sites will enable examination of whether the ratios of Y/A and X/A diversity change as a function of distance from genes (Hammer et al. 2010).
Using our estimates of the loss of diversity on the Y chromosome, we can ask whether the inferred reduction in effective population size explains the reduced Y-linked selection efficacy reported in Hough et al. (2014). In particular, our previous work revealed a 2.57-fold increase in the rate of nonsynonymous relative to synonymous divergence. The inferred DFE on the X implies that 15.7% of nonsynonymous sites have a strength of selection (Ns) <1, and are in the nearly neutral zone. If we use the estimated shape of the gamma distribution from the X, and take the observed reduction in diversity on the Y relative to the X of 0.021 to readjust the expected mean Ns for this chromosome, we predict that the Y chromosome should have 42.4% of mutations as effectively neutral. Thus, we expect a 2.7-fold increase in the fraction of effectively neutral deleterious mutations, which is very close to our observed increase of 2.57 in dN/dS. This provides further evidence to suggest that selective interference, rather than relaxed selection per se, is the primary factor driving Y chromosome degeneration in Rumex.
Conclusions
The nonrecombining region of a Y chromosome produces evolutionary dynamics that are similar to a haploid asexual population, with the lack of recombination resulting in a build-up of genetic associations among selected sites, a loss in the efficiency of selection, and an increase in the effect of selective interference (Fisher 1930; Muller 1964; Hill and Robertson 1966; McVean and Charlesworth 2000; Comeron and Kreitman 2002; Kaiser and Charlesworth 2009; Good et al. 2014). Our study of neutral diversity levels on the relatively young R. hastatulus sex chromosomes provides clear evidence for an extensive loss of neutral diversity on the Y chromosome. Whereas neutral models of sex-biased demography were unable to explain the magnitude of diversity loss, forward population genetic simulations revealed that loss of diversity is most consistent with widespread purifying selection, with a possible contribution from positively selected sites. Our results imply that the early stages of Y-chromosome evolution may largely be driven by the effects of selective interference rather than by widespread silencing of Y-linked genes and their subsequent degeneration through neutral drift.
Acknowledgments
We thank Felix Beaudry for providing genomic coverage data for quality filtering. This research was funded by Discovery grants to S.C.H.B. and S.I.W. from the Natural Sciences and Engineering Research Council of Canada, and by an Ontario Graduate Scholarship (OGS) to J.H.
Footnotes
Supplemental material is available online at www.genetics.org/lookup/suppl/doi:10.1534/genetics.117.300142/-/DC1.
Communicating editor: B. Payseur
