


Abstract
In crop species, adaptation to different agroclimatic regions creates useful variation but also leads to unwanted genetic correlations. Bouchet.......
Adaptation of domesticated species to diverse agroclimatic regions has led to abundant trait diversity. However, the resulting population structure and genetic heterogeneity confounds association mapping of adaptive traits. To address this challenge in sorghum [Sorghum bicolor (L.) Moench]—a widely adapted cereal crop—we developed a nested association mapping (NAM) population using 10 diverse global lines crossed with an elite reference line RTx430. We characterized the population of 2214 recombinant inbred lines at 90,000 SNPs using genotyping-by-sequencing. The population captures ∼70% of known global SNP variation in sorghum, and 57,411 recombination events. Notably, recombination events were four- to fivefold enriched in coding sequences and 5′ untranslated regions of genes. To test the power of the NAM population for trait dissection, we conducted joint linkage mapping for two major adaptive traits, flowering time and plant height. We precisely mapped several known genes for these two traits, and identified several additional QTL. Considering all SNPs simultaneously, genetic variation accounted for 65% of flowering time variance and 75% of plant height variance. Further, we directly compared NAM to genome-wide association mapping (using panels of the same size) and found that flowering time and plant height QTL were more consistently identified with the NAM population. Finally, for simulated QTL under strong selection in diversity panels, the power of QTL detection was up to three times greater for NAM vs. association mapping with a diverse panel. These findings validate the NAM resource for trait mapping in sorghum, and demonstrate the value of NAM for dissection of adaptive traits.
MANY of the world’s major crop species have adapted to diverse agroclimatic regions, resulting in abundant natural variation for trait dissection and crop improvement (Vavilov 2009; Meyer and Purugganan 2013; Olsen and Wendel 2013). Genetic dissection of quantitative traits in crop species provides valuable insights into plant biology (Nordborg and Weigel 2008; Olsen and Wendel 2013), and facilitates breeding of improved varieties (Bernardo 2010; Cooper et al. 2014). To date most known quantitative trait loci (QTL) for crop adaptive traits were identified using linkage mapping with biparental recombinant inbred line (RIL) families (Mickelbart et al. 2015). However, biparental mapping is constrained by a lack of allelic diversity, which limits the characterization of genetic architecture, and a lack of recombination events, which limits the resolution of mapping (Myles et al. 2009). Genome-wide association studies (GWAS) capture more allelic diversity and recombination events, but population structure resulting from isolation or adaptation can lead to spurious and synthetic associations (Platt et al. 2010; Brachi et al. 2011). While statistical models with population structure (Q) and kinship (K) terms [e.g., mixed linear models (MLM)] should reduce false positives, they are also expected to have low power to detect causal variants that are associated with population structure (i.e., they will increase false negatives) (Bergelson and Roux 2010). Indeed, when MLM are used to map QTL for adaptive traits like flowering time in rice (Huang et al. 2010) or inflorescence architecture in sorghum (Morris et al. 2013a), the resulting QTL are barely above the significance threshold.
Multiparental linkage-association approaches have been developed to combine the strengths of linkage and association approaches, capturing more allelic diversity and recombination than biparental families, while avoiding the spurious correlations typical of diverse association panels (Cavanagh et al. 2008; Brachi et al. 2011). By crossing multiple lines originating from different subpopulations, trait correlations due to linkage disequilibrium (LD) are broken down, alleles in repulsion phase between subpopulations are decoupled, and allele frequencies are balanced (i.e., some rare alleles are dropped while others are brought to moderate frequency). The nested association mapping (NAM) design, which uses multiple RIL families connected by a single common parent (Yu et al. 2008), has been particularly successful for complex trait dissection in maize (Buckler et al. 2009; Tian et al. 2011; Li et al. 2015). Joint linkage (JL) mapping, in which QTL terms are fit nested within families, helps distinguish allelic series from linked genes (Buckler et al. 2009; Würschum et al. 2012). The power of QTL detection has been investigated for NAM populations of different sizes (Yu et al. 2008), and for different cross designs (Stich 2009; Klasen et al. 2012; Liu et al. 2013). However, to our knowledge, no study has compared mapping power between diverse association panels and NAM populations of the same sample size (empirically or with simulated traits), or determined if NAM is more powerful for dissection of population-structured adaptive traits.
Here, we characterize the genomic diversity, genetic properties, and mapping power of a sorghum NAM population. Sorghum is a diverse and widely adapted cereal crop grown for food, forage, and biomass, which is known for its excellent tolerance to drought and other environmental stressors (National Research Council 1996). Sorghum originated in tropical Africa (ca. 10,000–5000 B.P.), then diffused and adapted globally over the past several thousand to several hundred years, leading to strong population structure by botanical race, geography, and farmer preference (Doggett 1988; Deu et al. 2006; Morris et al. 2013a). Diverse association panels have been developed to represent global sorghum germplasm (Deu et al. 2006; Casa et al. 2008; Upadhyaya et al. 2009). These panels have been used for GWAS of several traits, including some that are geographically structured and thought to underlie adaptation (Morris et al. 2013a,b; Rhodes et al. 2014; Lasky et al. 2015; Zhang et al. 2015). These studies have highlighted the challenge of dissecting structured adaptive traits in diverse association panels (Morris et al. 2013a,b; Lasky et al. 2015), similar to findings from other widely adapted crops (Huang et al. 2010; Famoso et al. 2011; Zhao et al. 2011; Bouchet et al. 2013). The objectives of our study were (i) to characterize the genetic properties of a sorghum NAM population, (ii) to compare the power of QTL detection with NAM vs. diversity panel GWAS for flowering time and plant height, and (iii) to test the hypothesis that the NAM approach improves power to dissect adaptive traits. We describe the genetic properties of the sorghum NAM population, dissect quantitative variation for flowering time and plant height, and demonstrate via simulated QTL that NAM is more powerful than GWAS for dissecting traits subject to strong selection.
Materials and Methods
Population development
The sorghum NAM population was designed as a resource for genetics and breeding, with 11 parents from the sorghum association panel (Casa et al. 2008) chosen to capture important breeding material and genetic subpopulations (Yu et al. 2013). The common parent, RTx430, is an elite pollinator line that has been widely used in public and commercial breeding programs in the U.S. (Miller 1984; Smith and Frederiksen 2000). Ten diverse founder lines were selected to represent global sorghum diversity as alternate parents: Ajabsido, Macia, P898012, SC1103, SC1345, SC265, SC283, SC35, SC971, and Segaolane (Table 1) (Sotomayor-Rios et al. 1996; Rosenow et al. 1997; Dahlberg et al. 1998; Rosenow 1999; ICRISAT 2000). Each of the alternate parents was crossed with the common parent RTx430, and the progeny selfed to generate F2 populations. From each F2, ∼250 RILs were derived through single-seed descent in Puerto Rico and Kansas to the F6 generation. The resulting NAM population consists of 10 RIL families, each with <250 RILs, sharing a common parent. Below, when referring to an individual RIL family, we will use the name of the alternate parent (e.g., the Ajabsido family).
Description of the NAM parent lines
| Name | PI | Origina | Type | Botanical Race (Working Group) | Genetic Structureb |
|---|---|---|---|---|---|
| RTx430 | 655996 | Texas A&M | Pollinator parent | — | G = 0.65; C = 0.23; D = 0.08 |
| SC283 | 533869 | Tanzania | Converted landrace | Guinea (Conspicuum) | K = 0.74; G = 0.26 |
| SC1103 | 576434 | Nigeria | Converted landrace | Guinea | K = 0.49; D = 0.36 |
| Segaolane | 656023 | Botswana | Selected landrace | Kafir | K = 0.98 |
| Macia | 565121 | ICRISAT | Global variety | Caudatum (Zerazera) | C = 0.99 |
| SC35 | 534133 | Ethiopia | Converted landrace | Durra | D = 0.97 |
| Ajabsido | 656015 | Sudan | Selected landrace | Caudatum (Feterita) | C = 0.50; D = 0.29; G = 0.21 |
| SC971 | 656111 | Puerto Rico | Converted landrace | Durra-Kafir | K = 0.42; G = 0.4 |
| SC265 | 533766 | Burkina Faso | Converted landrace | Guinea (Conspicuum) | G = 1 |
| SC1345 | 597980 | Mali | Converted landrace | Caudatum-Bicolor | C = 0.85 |
| P898012 | 656057 | Purdue | — | C = 0.95 |
Geographic origin for landrace-derived accessions, or breeding program origin for improved lines.
Estimated admixture coefficients (G = Guinea, K = Kafir, D = Durra, C = Caudatum).
| Name | PI | Origina | Type | Botanical Race (Working Group) | Genetic Structureb |
|---|---|---|---|---|---|
| RTx430 | 655996 | Texas A&M | Pollinator parent | — | G = 0.65; C = 0.23; D = 0.08 |
| SC283 | 533869 | Tanzania | Converted landrace | Guinea (Conspicuum) | K = 0.74; G = 0.26 |
| SC1103 | 576434 | Nigeria | Converted landrace | Guinea | K = 0.49; D = 0.36 |
| Segaolane | 656023 | Botswana | Selected landrace | Kafir | K = 0.98 |
| Macia | 565121 | ICRISAT | Global variety | Caudatum (Zerazera) | C = 0.99 |
| SC35 | 534133 | Ethiopia | Converted landrace | Durra | D = 0.97 |
| Ajabsido | 656015 | Sudan | Selected landrace | Caudatum (Feterita) | C = 0.50; D = 0.29; G = 0.21 |
| SC971 | 656111 | Puerto Rico | Converted landrace | Durra-Kafir | K = 0.42; G = 0.4 |
| SC265 | 533766 | Burkina Faso | Converted landrace | Guinea (Conspicuum) | G = 1 |
| SC1345 | 597980 | Mali | Converted landrace | Caudatum-Bicolor | C = 0.85 |
| P898012 | 656057 | Purdue | — | C = 0.95 |
Geographic origin for landrace-derived accessions, or breeding program origin for improved lines.
Estimated admixture coefficients (G = Guinea, K = Kafir, D = Durra, C = Caudatum).
Genotyping
For each NAM RIL, an F6 seedling was genotyped using ApeKI genotyping-by-sequencing (GBS) (Elshire et al. 2011) as previously described (Morris et al. 2013a). In total, 2310 NAM RILs were genotyped, 100 of which were genotyped twice as technical replicates. To confirm the identity of the parent lines, two seed-lots of each parent line were genotyped. Ten individuals were genotyped from the Kansas State University (KSU) parental seed-lots, and two from seed-lots obtained from U.S. Department of Agriculture (USDA) Germplasm Resources Information Network (GRIN, http://www.ars-grin.gov). Seven lanes of 384-multiplexed libraries were sequenced on the Illumina HiSeq 2500 sequencing system (Kansas University Medical Center) using a high-output flowcell with 100 cycle single-end sequencing. These sequence data were combined with published ApeKI-GBS sequence data from 3302 diverse accessions (DA3302) (Morris et al. 2013a; Lasky et al. 2015) to call SNP genotypes, as follows. Reads were trimmed, and genotypes were called and filtered (Supplemental Material, File S1 and File S2) using TASSEL 5 GBS v2 Pipeline (https://bitbucket.org/tasseladmin/tassel-5-source/wiki/Tassel5GBSv2Pipeline) (Glaubitz et al. 2014). Among the 1.5 billion reads, 7.6 million unique 64 bp tags (DNA sequence) were identified. Overall, 90% of unique tags aligned to version 2.1 of the sorghum BTx623 reference genome (Paterson et al. 2009; Goodstein et al. 2011). (Note, all gene and QTL positions listed in this study are given in version 2.1 coordinates so may differ from the original published coordinates.) Raw genotypes were filtered for tag coverage (tag found in >5% of taxa), minor allele frequency (MAF) (>0.03), and single marker missing data (<0.8). After filtering, 90,441 SNPs (90K_SNPs) were retained for further analysis of the NAM population (File S3) and 282,400 SNPs were retained for analysis of the DA3302 (File S4).
Of the 39,441 annotated genes in the sorghum reference genome (version 2.1), 22% were tagged by a SNP in the gene, and 70% were tagged by a SNP within 10 kb. The average SNP density was one SNP per 7500 bp. The physical position of markers on version 1.4 and 2.1 of the sorghum genome are provided in File S5. Missing genotypes in the NAM RILs were imputed using the FSFHap Plugin (Swarts et al. 2014) implemented in TASSEL 5, which corrects genotyping errors for inbred individuals in full-sib families. Missing genotypes in diverse accessions were imputed using Beagle 4 (Browning and Browning 2013), which is more accurate than FSFHap for diverse germplasm (Swarts et al. 2014). We removed 96 RILs with >10% residual heterozygosity, and retained 2214 RILs for further analyses (NAM2214). The number of RIL per family ranged from 199 for the Ajabsido family to 232 for the SC971 family.
Genomic analyses
Quantitative assignments of DA3302 genotypes to genetic groups were computed with ADMIXTURE (Alexander et al. 2009). Based on cross-validation, we used four genetic groups to describe the diverse accessions (File S6). To characterize the diversity of the NAM population with respect to global sorghum germplasm, we used principal component analysis with the same number of lines coming from both panels and shared good quality markers. We used a subset of 60,864 SNPs (60K_SNPs) that were polymorphic in both populations with MAF >0.01 in the diverse accessions and MAF >0.03 in the NAM population. Principal component axes were built using 2148 diverse accessions (DA2148), a balanced subset of DA3302 including 537 accessions from each genetic group, with the FactoMineR R package (Lê et al. 2008). The NAM RILs were projected on these axes. Identity-by-state (IBS) was evaluated among parents and RILs using TASSEL 5 (Bradbury et al. 2007). Allelic frequencies, MAF, residual (observed) heterozygosity (Ho), and expected heterozygosity (He) were calculated using the Hierfstat R package (Goudet 2005). The intensity of selection at each SNP in DA3302 was estimated using BayeScan (Foll and Gaggiotti 2008). For the NAM population, marker density, gene density and monomorphism rate were calculated using a sliding window of 1 Mb with 500 kb steps. LD was calculated as r2 using the models of Sved (1971) and Hill and Weir (1988).
Genetic maps and recombination rates
Genetic maps were built for each individual family, as well as for the whole NAM population, using CarthaGène (de Givry et al. 2005) (File S7, File S8, and File S9). All markers grouped according to the correct physical chromosomes with LOD scores >15. In the first step, statistically robust framework maps were built using an incremental insertion procedure. Markers were retained only if the difference of log-likelihood between maps was >3.0. Finally, markers with LOD score >2.0 and 1.0 were inserted. For the composite map, monomorphic markers within each population were set to missing data. Genetic distances in centiMorgan (cM) were calculated using Haldane’s mapping function (Haldane 1919). The boundaries of the pericentromeric regions were estimated from inflection points of the sigmoid curve created by plotting genetic position vs. physical position. Using that definition, 20% of mapped markers were located in pericentromeric regions. Chi squared tests for segregation distortion within, and across, families were calculated using the R/qtl package (Arends et al. 2010). Recombination rates were calculated within and across families using the MareyMap R package (Rezvoy et al. 2007), with a sliding window of 1 Mb and 500 kb steps.
Phenotypic data
We phenotyped plant height for F6 NAM RILs at two locations, in western Kansas (Hays, KS, 38.8541°N 99.3385°W, semi-arid climate), and eastern Kansas (Manhattan, KS, 39.2125°N 96.5983°W, continental-humid climate) in 2014 (File S10, File S11, and File S12). Plant height was estimated as the mean of two representative plants per row, measured using a barcoded ruler after physiological maturity. We also phenotyped flowering time in the Manhattan, KS, experiment. Flowering time was defined as number of days until 50% of plants were in anthesis. Families were each grown in a block, and RILs were randomized within family. Each plot consisted of a 3 m row with ∼45 plants. The corresponding planting density was 200,000 plants per hectare—typical for commercial production in this region. For comparison with the NAM population, we used previously generated phenotypes (File S13, File S14, File S15, and File S16) for two diverse association panels of global germplasm (SAP340 and GRIN700), which are subsets of the DA3302 described above. The first panel, SAP340 (n = 340), consisted of accessions from the sorghum association panel (Casa et al. 2008) for which flowering time and plant height phenotypes were available (Lubbock, TX, semi-arid climate; Weslaco, TX, continental-humid climate) (Brown et al. 2006; Casa et al. 2008). The SAP340 accessions included global breeding lines and tropical landraces converted to short-stature and early maturity (Casa et al. 2008; Morris et al. 2013a). The second panel, GRIN700 (n = 700), consisted of global breeding lines and landrace accessions for which flowering time data were available in GRIN (scored 1–6 in Lubbock, TX in 2005) (Kimber et al. 2013).
QTL mapping
Simulations and power estimation
To compare the power of QTL detection using NAM vs. DP-GWAS, without any bias due to gene-environment interactions (G×E), we investigated simulated traits. Genotyping for the NAM population and the association panel were conducted in different experiments using different sequencing depth. This can explain part of nonoverlapping, high-quality polymorphic markers between the two populations. As it was difficult to distinguish monomorphic from bad quality markers, for simulations (File S20) we used the subset (60K_SNPs) that were good quality and polymorphic in both the NAM population and DA2148 (File S21, File S22, File S23, File S24, File S25, File S26, File S27, File S28, and FileS29). Most of the removed markers were rare in DA2148 (75% had MAF <0.01) and monomorphic in the NAM (Figure S2). Given that these markers would not be detected in association studies with high confidence, the bias toward NAM for power estimation should be limited. For simulation, 50 random samples of 50 SNPs were assigned as QTL with additive effects following a geometric series (Lande and Thompson 1990; Yu et al. 2008). The genotypic value of each line (RIL or diverse line) was defined as the sum of genotypic values across all loci. The entry-mean heritability (h2) was set to either 0.4 or 0.7. Phenotypic values of lines were obtained by adding normally distributed error to the genotypic values, such that the residual variance was 60% (h2 = 0.4) or 30% (h2 = 0.7) of phenotypic variance.
Power was compared between a diverse association panel (using MLMM) and the NAM population (using JL or MLLM). The power was calculated for 50 independent runs, and then averaged for each simulation scheme. First, we quantified global power and power for different classes based on variance explained by the QTL. The variance explained was calculated as pqb2, with p the frequency of allele 1, q the frequency of allele 2, and b the SNP effect. Second, we characterized QTL detection power for different classes of selection intensity inferred in DA3302, defined by log10(Posterior Odds) >0.5 according to BayeScan. In order to take into account the greater extent of LD in the NAM2214 compared to the DA3302, a true positive was counted (i) when a QTL at the same genetic position was identified as significant in the final model, and (ii) when a QTL in a window of 2 cM was identified as significant in the final model. The false discovery rate (FDR) was calculated as the number of independent positives at a distance (i) >0 cM or (ii) >2 cM from the closest QTL, divided by the total number of positives.
Data availability
Sequencing data are available in the NCBI Sequence Read Archive under project accession SRP095629. Other data are available from Dryad Digital Repository (doi:10.5061/dryad.gm073). Plant material: NAM RIL seeds will be submitted to GRIN. Please contact corresponding author for availability.
Results and Discussion
Genetic diversity and structure of the NAM population
To evaluate the genetic diversity and structure of the NAM population, we characterized 2214 NAM RILs at 90,441 high-quality GBS SNPs, which corresponds to an average density of one SNP per 7.5 kb. Based on technical replicates, the genotyping error rate was 0.001. Comparing the number of SNPs discovered in the NAM population to the number of SNPs discovered in global accessions (DA2148) (Lasky et al. 2015), we estimate that the NAM population captures ∼70% of known polymorphism (MAF <0.01) in sorghum. To compare the genetic structure of the NAM population to global accessions, we built four PCA axes using lines from the global accessions, and projected NAM RILs on those axes. As expected, the global accessions were structured by botanical race and geographic origin (Harlan and de Wet 1972; Morris et al. 2013a), and the NAM families were clearly clustered, capturing multiple axes of genetic variation (Figure 1). The similarity among full-sib RILs (0.85) was higher than among half-sib RILs (0.75), as expected. Pairwise similarity between the common parent RTx430 and each alternate parent line ranged from 0.71 for SC1103 to 0.77 for Ajabsido. Differences in pairwise similarity between the common parent and each alternate parent led to variation in monomorphism across the genome (Figure 2A and File S30), and among families (ranging from 0.68 for Segaolane to 0.78 for Ajabsido). Monomorphism rate in pericentromeric regions was similar to the rest of the genome (0.75 vs. 0.73).
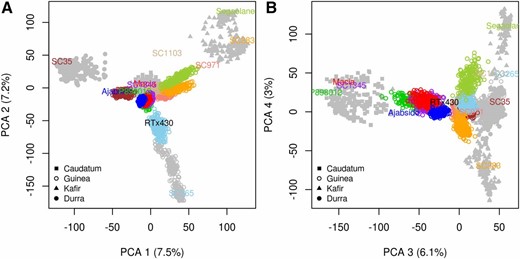
Principal component analysis of NAM RILs in comparison to global diversity. NAM RILs (n = 2214) were projected on axes built with 2148 accessions representing global diversity. The first four axes are displayed: (A), 1–2; (B), 3–4, with the proportion of variance explained by each axis in parentheses. Each of the 10 diverse parents and corresponding RILs are represented with a unique color. Classification into four major botanical races (Guinea, Kafir, Caudatum, and Durra) based on the diverse parent is noted with symbols.
![Genome-wide map of polymorphism and recombination in the NAM population. (A) Percentage of monomorphic markers (“Mono rate”) in sliding windows of 5 Mb with 2.5 Mb steps. (B) The percentage of RIL with heterozygous genotypes (“Hetero rate”) after imputation, using a window of 1 Mb and 500 kb steps. (C) Segregation distortion estimated as the percentage of RIL with RTx430 allele (“RTx430 rate”), using a window of 1 Mb and 500 kb steps. Horizontal dashed lines stand for 0.35 and 0.65 threshold for significant segregation distortion. (D) Recombination rate [“Rec (cM/Mb)”] was calculated for the NAM population using the composite map, using a window of 1 Mb and 500 kb steps.](https://oup.silverchair-cdn.com/oup/backfile/Content_public/Journal/genetics/206/2/10.1534_genetics.116.198499/10/m_573fig2.jpeg?Expires=1716398245&Signature=bMc7sCfhTO~Cd7X8Xdm1X0kF3NQXk0NlmQ2d2epzB7rC3vJd5S1ty0xe19mPHAx6cu~GIse3yTHgHqT14goGOf~sbyNxU1wDLlCLud0nxSOPrqiuulmN5O4c8NOGghi1t8GXVsicJbmFUi9QM~gSBsTBXRFaS1HSpUqwBeBUHC7pS9VuUHClMXWTuiw5oXmOS8EFCAFuSv0YNTLOVaALWSIloJOxUqEabfkOqRII8kRomBfuoZr6sAhPoUzw2Z0cnY0nQuhw1Je6JptX5fCop1huELSCPaQY-5myKMBVAkzXpzZJPQQWiMXhuMNosmVWnOsT1g8TKexgVmCJWrzt9A__&Key-Pair-Id=APKAIE5G5CRDK6RD3PGA)
Genome-wide map of polymorphism and recombination in the NAM population. (A) Percentage of monomorphic markers (“Mono rate”) in sliding windows of 5 Mb with 2.5 Mb steps. (B) The percentage of RIL with heterozygous genotypes (“Hetero rate”) after imputation, using a window of 1 Mb and 500 kb steps. (C) Segregation distortion estimated as the percentage of RIL with RTx430 allele (“RTx430 rate”), using a window of 1 Mb and 500 kb steps. Horizontal dashed lines stand for 0.35 and 0.65 threshold for significant segregation distortion. (D) Recombination rate [“Rec (cM/Mb)”] was calculated for the NAM population using the composite map, using a window of 1 Mb and 500 kb steps.
The genetic structure and diversity of the NAM population may be affected by unintentional selection during RIL development, which can lead to increased residual heterozygosity and segregation distortion (McMullen et al. 2009). Residual heterozygosity in the NAM population was 0.019, close to the expected value for F6 generation RILs (0.56 = 0.016). Across the genome 95% percent of markers exhibited heterozygosity <0.035 (Figure 2B and File S31), suggesting that balancing selection had little effect overall. Pericentromeric regions were enriched in high heterozygosity markers (34% of markers with Ho > 0.035, vs. 20% of all markers) suggesting that balancing selection did occur in these regions. With respect to segregation distortion, the percentage of alleles inherited from the common parent RTx430 (49%) was close to the neutral expectation (50%), suggesting no overall selection for or against common parent alleles. Still, a substantial proportion of markers (15%) showed skewed segregation, for either the common parent (7.8%), or alternate parent (7.7%) allele (Figure 2C and File S32), suggesting selection at some loci. No clear difference was observed among families in terms of proportion of distorted markers, and skewed chromosome regions were generally specific to one or a few families. One region around the Ma1-Dw2 locus (∼40–42 Mb on SBI-06), which harbors major effect loci for maturity and height (Thurber et al. 2013), was skewed toward RTx430 in eight of the 10 RIL families, suggesting selection may have acted on this region. The genetic properties for each family and each chromosome are detailed in File S29.
The genomic landscape of recombination
Recombination rates determine the resolution of QTL mapping, as well as the probability that favorable alleles combine during human and natural selection (Gaut et al. 2007; McMullen et al. 2009). The NAM population captured 57,411 crossovers across 2214 RILs, which corresponds to an average of two crossovers per gene (Figure 2D and File S33). The size of the composite map was 1314 cM (Table 2) (Note, the physical size of the version 2 genome was 658 Mb). The average genome-wide recombination rate was 2.0 cM/Mb, similar to previous estimates in sorghum (Mace et al. 2009). Among families, the genome-wide recombination rate ranged from 1.8 for SC1103 to 2.3 for Ajabsido. The number of crossovers per RIL was 24.9, or 2.5 per chromosome on average. Several low recombination rate regions were associated with high heterozygosity (Figure 2, A and D). The highest average recombination rate was observed on SBI-01 (2.4 cM/Mb), and the lowest on SBI-07 (1.8 cM/Mb). Crossover counts per chromosome were proportional to chromosome size, ranging from ∼4800 for SBI-08, SBI-09, and SBI-10, to >7600 for SBI-01. The recombination rate at each genome position was similar across the NAM families (r = 0.74, P < 10−16), as has been observed in maize (Rodgers-Melnick et al. 2015).
NAM composite map statistics
| Family | # RILs | # Markers | Length (cM) | # CO | Rec (cM/Mb) |
|---|---|---|---|---|---|
| Ajabsido | 199 | 19,545 | 1538.7 | 5,739 | 2.34 |
| Macia | 228 | 21,531 | 1225.6 | 5,540 | 1.86 |
| P898012 | 228 | 24,587 | 1273.6 | 5,657 | 1.93 |
| SC1103 | 229 | 25,706 | 1208.5 | 5,699 | 1.84 |
| SC1345 | 228 | 22,101 | 1257.6 | 5,713 | 1.91 |
| SC265 | 220 | 22,749 | 1238.6 | 5,403 | 1.88 |
| SC283 | 231 | 23,561 | 1284.9 | 6,036 | 1.95 |
| SC35 | 201 | 23,400 | 1293.4 | 5,175 | 1.96 |
| SC971 | 232 | 23,976 | 1384.1 | 6,308 | 2.10 |
| Segaolane | 218 | 28,906 | 1350.9 | 6,141 | 2.05 |
| Composite | 2214 | 90,441 | 1313.7 | 57,411 | 2.00 |
The recombination map revealed major regional differences in recombination rates associated with chromosome structure. Recombination was concentrated around chromosome ends (Figure 2D and File S34). Overall, 96% of the variation in recombination rate could be explained by gene content (r = 0.98) and 76% by the distance from the closest telomere (r = −0.87) (Figure S3). The chromosome-scale pattern of crossover events in the NAM population mirrors historical recombination rates in global sorghum diversity panels (Morris et al. 2013a), as well as the pattern of crossover events in experimental crosses in Arabidopsis (Marais et al. 2004) and maize (Bauer et al. 2013; Rodgers-Melnick et al. 2015). At a finer scale, the pattern of crossover events in the sorghum NAM was associated with gene structure. Crossover sites were generally in or close to genes (Figure 3A), with 95% occurring <20 kb from a gene, and 54% occurring within genes. The enrichment of crossovers in coding DNA sequence and 5′ untranslated regions was 4.0- and 4.6-fold, respectively (Figure 3B). The prevalence of crossovers near genes may be explained by the open chromatin (low DNA methylation and compaction) near genes facilitating access to recombination factors and chiasma formation (Saintenac et al. 2011; Rodgers-Melnick et al. 2015). The substantial enrichment of crossovers in and near genes should be useful for mapping and breeding, especially if most trait variation is due to variants located in, or just upstream of, genes, as has been observed in maize (Li et al. 2012). Recombination rate was positively correlated with monomorphism rate in all families (1 Mb windows; r = 0.2, P < 10−16), suggesting that greater sequence identity promotes crossover formation. This pattern was particularly pronounced in the Ajabsido family on SBI-06 (monomorphism rate = 0.88, recombination rate = 2.3 cM/Mb). Further studies of mechanisms underlying recombination rate differences are needed to predict local recombination rates, and to identify alleles that increase recombination (Mercier et al. 2015).
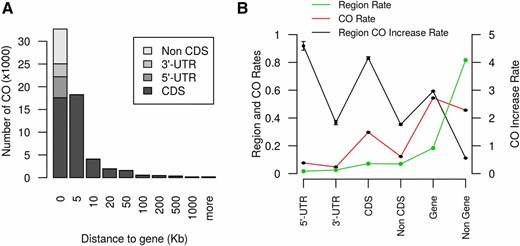
Crossover rate is greater near and in genes. (A) The number of crossovers (COs) with respect the distance to the nearest gene. The leftmost bar, which represents COs in genes (distance to gene = 0), notes the number of COs in 5′ untranslated regions (UTR), 3′ UTR, coding DNA sequence (CDS), and non-CDS regions of genes. (B) Comparison of CO rate in different gene regions. “Region Rate” indicates the percentage of base pairs in each category across the genome. “Region CO Increase Rate” is the ratio of the CO rate in specific regions over the genome rate (CO Rate/Region Rate). Plotted values are mean ± SD based on resampling of half the markers 50 times.
The genetic map presented in this study is the densest recombination map of the sorghum genome. In previous maps, the shortest average marker interval was 0.79 cM using 1997 markers (Mace et al. 2009). By contrast, the 90,441 markers in this study correspond to at least 8349 unique genetic loci, so the density of informative markers was one per 0.16 cM. The large number of markers and informative crossovers enabled the computation of a high-density recombination map of the sorghum genome, with a consequent substantial increase in resolution compared to previous maps. The individual map length is similar to previous maps (1314 cM in this study vs. 1528 cM for the TAMU-ARS map, and 1227 cM for the CIRAD map). We covered all distal gaps compared to the previous composite maps. The largest remaining gap is 3.9 cM at ∼44 Mb on SBI-06. For future map-based gene cloning, individual RIL families can be targeted or avoided based on recombination or monomorphism rates. For instance, Ajabsido and P898012 families may be excluded for QTL located on short arm of SBI-06 due to monomorphism.
Genetic dissection of flowering time and plant height
We characterized flowering time and plant height (Figure 4), which are important contributors to agro-climatic adaptation, and phenotypic covariates for other traits (Buckler et al. 2009; Russell et al. 2016). The percentage of variance explained by genetic effect was 77% for flowering time and 50% for height (P < 10−16). The percentage of variance explained by site for height was 34%. G×E was strongly significant for height (P < 10−16), and explained 11% of phenotypic variance. We did not have replicates to estimate G×E for flowering time. In the semi-arid environment, plants were shorter and phenotypic variance was reduced (Figure 4B). This decrease in height was more pronounced for families with tall plants (size decrease ranged from 19% for SC35 to 33% for SC971). We observed abundant transgressive segregation, especially pronounced in families with tall and late phenotypes, like the P898012 family. Considering the significant effect of environment, we performed QTL analyses separately for both environments. Using MLLM and JL, we detected several major QTL for flowering time and plant height in the NAM population with high resolution (Figure 5, File S35, File S36, File S37, File S38, File S39, File S40, File S41, File S42, File S43, File S44, and File S45). Overall, 18 and 23 highly significant associations (passing the E−05 threshold) were identified for flowering time and plant height, respectively, in at least one environment. The JL QTL are listed in Table S1, and are described further below.
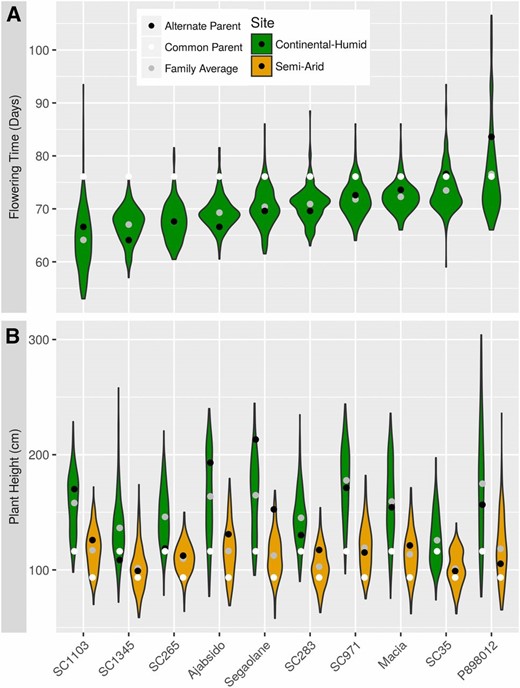
Variation of flowering time and plant height in the NAM families. (A) Flowering time distribution for each NAM family in a continental humid (CH; Manhattan, KS) environment. (B) Plant height distribution for each NAM family in a CH environment (green) or a semi-arid environment (Hays, KS) (orange).
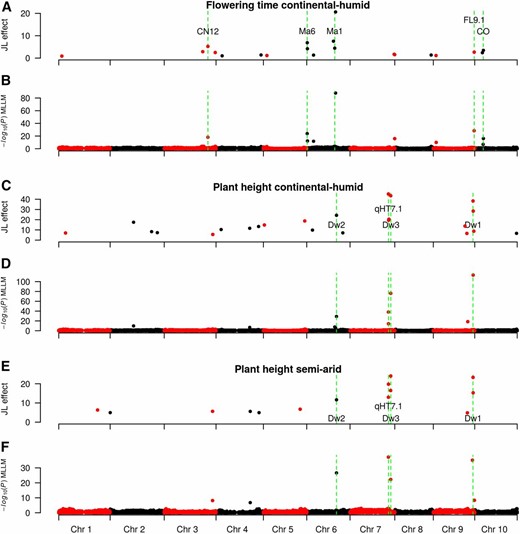
QTL mapping for flowering time and plant height in the NAM population. Flowering time QTL effect sizes in a continental humid (CH; Manhattan, KS) environment estimated with a JL model (A), and flowering time QTL identified using a MLLM model (B). Known flowering time genes in sorghum that colocalize with the QTL are noted green dashed lines. Plant height QTL effect sizes in the CH environment estimated with a JL model (C), and plant height QTL identified using a MLLM (D). Plant height QTL effect sizes in a semi-arid (SA; Hays, KS) environment estimated with a JL model (E), and plant height QTL identified using a MLLM (F). Known plant height genes in sorghum that colocalize with the QTL are noted with green dashed lines.
Genetic variation considering all SNP simultaneously (fit with a random polygenic term) explained 65% of phenotypic variance for flowering time. Eighteen QTL for flowering time were observed, with major effect QTL (>2 days) on SBI-06 (S6_758162, S6_38361618, S6_40204294, S6_41417540), SBI-03 (S3_62707083, S3_55337873, S3_73262074), SBI-10 (S10_12485175), and SBI-09 (S9_58743830). Considering known floral regulators in sorghum (Murphy et al. 2014; Yang et al. 2014a,b), there were QTL near Ma6/Ghd7, SbCN12, Ma1/SbPRR37, and SbCO (Figure 5, A and B), but not near Ma3/PhyB, Ma5/PhyC, SbGI, SbCN4, SbCN8, or SbCN15. One flowering time QTL was 2 kb from Ma6 (Murphy et al. 2014) with MLLM or 84 kb from Ma6 with JL. Other flowering time QTL were detected 64 kb from SbCN12 (Yang et al. 2014a), and 63 kb from Ma1 (Murphy et al. 2011). Surprisingly, the two largest effect QTL (at S6_38361618 and S6_41417540) were near Ma1 (1.2 Mbp downstream and 1.9 Mbp upstream) but not colocalized with this major effect gene. No orthologs of known maize inflorescence regulators (Zhang and Yuan 2014) were located near these QTL, and we did not observe any obvious a posteriori candidate genes under these QTL. They may be synthetic associations (Dickson et al. 2010; Platt et al. 2010) or additional floral regulators that are not orthologous to known floral regulators in cereals.
Genetic variation explained 74% of phenotypic variance in plant height. Twenty-three QTL for plant height were observed, with major effect QTL (>15 cm) on SBI-07 (S7_55156401, S7_58487616), SBI-09 (S9_57069231), SBI-06 (S6_42726152), and SBI-02 (S2_33698052) (Figure 5, C–F and Table S1). Plant height QTL were found 122 kb from the Dw3 gene (Multani et al. 2003), 25 kb from the Dw1 gene (Hilley et al. 2016; Yamaguchi et al. 2016), and at the Dw2 (Morris et al. 2013a) and qHT7.1 (Li et al. 2015) loci. We confirmed that a region on SBI-09 selected in the sorghum conversion program (Stephens et al. 1967; Morris et al. 2013a) fractionates into two QTL, one underlying plant height (Dw1), and one underlying flowering time (SbFL9.1) (Thurber et al. 2013; Higgins et al. 2014). The most significant SNP in the Dw2 region (S6_42726152) was 6 kb from a histone deacetylase (Sobic.006G067600) that was previously identified as a candidate for Dw2 based on GWAS in the SAP (Morris et al. 2013a), and was homologous to genes controlling height in maize and rice (Rossi et al. 2007; Hu et al. 2009).
To compare the power of NAM vs. DP-GWAS to detect flowering time and plant height QTL, we mapped these traits in the NAM population, and two diverse association panels (SAP340 and GRIN700), using either the maximum number of RILs available (Figure S4, Figure S5, File S46, and File S47), or equal-size subsets of RILs, as described below. Unless noted, the given QTL was observed in all runs (nrun = 10) when data subsets were used (i.e., NAM340 and NAM700). For plant height, the two QTL on chromosome 7 at qHT7.1 and Dw3 (55.16 and 58.48 Mb) were detected with NAM2214 and SAP340, and with NAM340 (8/10 and 10/10 runs, respectively). The QTL on SBI-09 (57.07 Mb), 25 kb from Dw1, was detected with NAM2214, NAM340, and SAP340. The Dw2 QTL on SBI-06 (42.72 Mb) was detected with NAM2214 and NAM340 (6/10 runs). For Ma1 (SBI-06, 40.27 Mb), the QTL was detected for NAM2214 (62 kb away), and GRIN700 but not for SAP340. One QTL was detected for SAP on SBI-06 at 48 Mb. In subsets of the NAM population, the Ma1 QTL was observed using NAM700 (6/10 runs), while a QTL located 1 Mb away was observed using NAM340 (6/10 runs). The Ma6 locus (SBI-06, 0.67 Mb) was detected with NAM2214 (84 kb away), while the nearest QTL was 2 Mb away for GRIN700, and no QTL was detected in this region with SAP340. The Ma6 locus was detected in NAM340 (3/10 runs) and NAM700 (7/10 runs). The major flowering time QTL on SBI-09 (58.74 Mb; colocalized with SbFL9.1) was detected with NAM2214, GRIN700, SAP340, NAM700, and NAM340 (4/10 runs). Taken together, these findings suggest that the NAM approach more consistently identified known QTL for flowering time and height loci compared to DP-GWAS with equal-size data sets.
Power of NAM vs. DP-GWAS for simulated QTL
Given that this initial study was conducted in a small number of environments, and environments were different for NAM and DP-GWAS, we investigated simulated traits to circumvent any effect of G×E. To test whether NAM is generally more powerful than DP-GWAS to dissect adaptive traits, we simulated QTL and compared the power of NAM (using JL mapping with NAM2214) vs. DP-GWAS (using MLMM with DA2148) in panels of the same size (full sets, n ≈ 2200, or subsets, n = 400) (Figure 6 and File S47). With a large panel and high heritability (n ≈ 2200, h2 = 0.7), the ratio of power for the NAM compared to DP-GWAS (“NAM power ratio”) was 1.2. The NAM power ratio was higher under low-power scenarios, e.g., when sample size was small (2.2 when n = 400, h2 = 0.7), or heritability was low (3.6 when n = 400, h2 = 0.4; 1.3 when n ≈ 2200, h2 = 0.4) (Figure 6, A and B). Similarly, the NAM power ratio was higher when QTL have low effect (4.1 when pqb2 = 0.05, n ≈ 2200, h2 = 0.7). Importantly, the power ratio was higher when QTL were under strong selection pressure in diversity panels [BayeScan log10(Posterior Odds) >1.5] (1.8 when n = 2200, h2 = 0.7; 7.5 when n ≈ 2200, h2 = 0.4) (Figure 6, C and D). Interestingly, under a high power scenario (large sample size and high heritability), the power of DP-GWAS was greater than NAM for QTL under moderate selection, perhaps due to the loss of allelic diversity in the NAM population. One special case of interest was SBI-06, where a low recombination rate and history of strong selection limit mapping of key loci, including Dw2 (Klein et al. 2008; Morris et al. 2013a; Thurber et al. 2013). The NAM power ratio was much higher for QTL on SBI-06 and under selection pressure (5.1 when h2 = 0.7, n ≈ 2200). In contrast, no QTL could be detected on SBI-06 in the diverse association panel (Figure S6 and File S47). Finally, we considered whether the larger extent of LD in the NAM population lead to a higher FDR. The FDR was <1% using DP-GWAS, but 13% in the NAM using JL (2 cM window, n ≈ 2200). Reduced recombination between markers in the NAM population compared to the diverse association panel increases FDR, and decreases the power of QTL detection. One solution to increase power and decrease FDR could be to nest markers within families in the model, increase allelic diversity by combining NAM populations with different common parents, and selecting a subsample of RIL that maximize the number of crossing-overs.
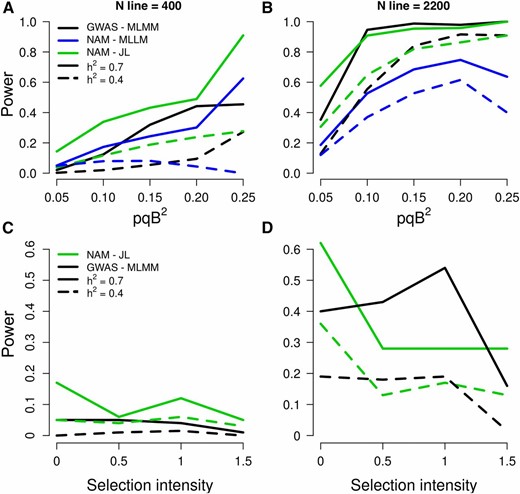
Power of QTL detection using the NAM population vs. a diverse association panel. In top row (A, B), the power of association studies is represented as a function of pqb2, where p and q are the frequencies of alleles 1 and 2, respectively, and b is the QTL effect. In bottom row (C, D), the power of association studies is represented as a function of selection intensity in diverse accessions calculated with BayeScan. The models plotted are JL and MLLM for NAM and MLMM for GWAS.
Our simulations confirm previous findings in maize (Yu et al. 2008) that demonstrate the power of NAM to detect small effect QTL compared to diverse association panels. Further, we demonstrate the power of NAM to detect QTL at loci under strong selection pressure, especially when heritability or panel size is low. This increase in power is especially important on SBI-06, where low recombination rate and low polymorphism due to selection during breeding have led to low power for QTL detection in temperate association panels (Morris et al. 2013a; Thurber et al. 2013). In practice, the greater size of the NAM population compared to existing association panels or RIL families can be a challenge for phenotyping. Therefore, field-based high-throughput phenotyping is needed to reveal the full potential of the NAM population, especially for ecophysiological traits that vary on short time scales (Araus and Cairns 2014). If phenotyping the entire NAM population is not possible due to technical or resource constraints, the NAM parent lines can be screened to identify individual families that segregate for the trait of interest. Note, even if parent lines do not vary for a given trait, the NAM population may segregate transgressively for that trait, as occurs for several traits in the maize NAM population (Cook et al. 2012; Peiffer et al. 2014), and for flowering time and plant height in this study. Alternatively, as our simulations demonstrate, when heritability is high, a smaller subset of the NAM population can be used effectively for trait mapping.
Conclusions
The sorghum NAM population captures much of the species’ global allelic diversity, and is well suited for mapping complex traits that are difficult to map using DP-GWAS. Since much of the global sorghum breeding effort is focused on stress adaptation traits (National Research Council 1996), the improved power to dissect structured adaptive traits with NAM promises to be valuable for marker-assisted breeding. For breeding programs focused on commercial hybrid sorghum, the sorghum NAM population can facilitate prebreeding by putting exotic alleles into an elite background suitable for QTL discovery. For breeding programs focused on smallholder varieties, the NAM population can facilitate identification of genetic variants from landraces in an international reference background. By leveraging genetic resources and bridging global germplasm, the sorghum NAM resource provides a new platform to understand and improve this climate-resilient crop.
Acknowledgments
The authors thank Renaud Rincent and Heloïse Giraud for sharing scripts; Daniel Hopper, Halee Hughes, and Gerald Rohleder for technical support; Alina R. Ahkunova, Katherine Jordan, Paul St. Amand, and Shuangye Wu for technical assistance; and two anonymous reviewers and the editor for suggestions that improved the manuscript. The study was carried out using resources at KSU Integrated Genomics Facility and Beocat High Performance Computing cluster. Support for this study was provided by Kansas Grain Sorghum Commission and K-State Research and Extension. This study is contribution 17-280-J from the Kansas Agricultural Experiment Station.
Footnotes
Supplemental material is available online at http://www.genetics.org/lookup/suppl/doi:10.1534/genetics.116.198499/-/DC1.
Communicating editor: J. B. Holland
Literature Cited
Rosenow, D. T., J. A. Dahlberg, G. C Peterson, L. E. Clark, J. W. Sij et al., 1999 Release of 27 converted sorghum lines. Int. Sorghum Millets Newsl. 40: 29–30.
Author notes
Present address: Génétique, Diversité, Ecophysiologie des Céréales (GDEC), Institut National de la Recherche Agronomique (INRA), l’Université Clermont II Blaise Pascal (UBP), 63039 Clermont-Ferrand, France.
