


Abstract
The extent to which selection and demography impact patterns of genetic diversity in natural populations of Drosophila melanogaster is yet to be fully understood. We previously observed that linkage disequilibrium (LD) at scales of ∼10 kb in the Drosophila Genetic Reference Panel (DGRP), consisting of 145 inbred strains from Raleigh, North Carolina, measured both between pairs of sites and as haplotype homozygosity, is elevated above neutral demographic expectations. We also demonstrated that signatures of strong and recent soft sweeps are abundant. However, the extent to which these patterns are specific to this derived and admixed population is unknown. It is also unclear whether these patterns are a consequence of the extensive inbreeding performed to generate the DGRP data. Here we analyze LD statistics in a sample of >100 fully-sequenced strains from Zambia; an ancestral population to the Raleigh population that has experienced little to no admixture and was generated by sequencing haploid embryos rather than inbred strains. We find an elevation in long-range LD and haplotype homozygosity compared to neutral expectations in the Zambian sample, thus showing the elevation in LD is not specific to the DGRP data set. This elevation in LD and haplotype structure remains even after controlling for possible confounders including genomic inversions, admixture, population substructure, close relatedness of individual strains, and recombination rate variation. Furthermore, signatures of partial soft sweeps similar to those found in the DGRP as well as partial hard sweeps are common in Zambia. These results suggest that while the selective forces and sources of adaptive mutations may differ in Zambia and Raleigh, elevated long-range LD and signatures of soft sweeps are generic in D. melanogaster.
DISENTANGLING the effects of demography and selection on patterns of genomic variation remains a central challenge in evolutionary biology. Until recently, inference of demography and selection primarily relied on short genomic fragments sampled from a limited number of individuals (e.g., Pritchard et al. 2000; Molina et al. 2001; Li and Stephan 2006; Thornton and Andolfatto 2006; Gutenkunst et al. 2009; Duchen et al. 2013). While these studies provided important insights into the evolutionary forces acting on populations, they were ultimately limited by both sample size and the physical scale in which patterns of polymorphism and linkage could be investigated. The recent availability of whole-genome sequences from multiple individuals with populations in a variety of species (e.g., Abecasis et al. 2010; Cao et al. 2011; Mackay et al. 2012) is enabling us to examine long-range patterns of linkage disequilibrium (LD) (∼10 kb), measured either as correlations between pairs of sites or as haplotype homozygosity. LD offers powerful insights into selective and demographic processes shaping genetic variation in a natural population, such as bottleneck or admixture events (Andolfatto and Przeworski 2000; Wall and Pritchard 2003; Pennings and Hermisson 2006; Pokalyuk 2012). In addition, haplotype homozygosity is very sensitive to recent and strong adaptation leading to both classical hard and soft selective sweeps (Pennings and Hermisson 2006; Garud et al. 2015; Garud and Rosenberg 2015).
In the case of Drosophila melanogaster, the most recent demographic models were inferred using short intergenic and intronic sequence fragments on the X chromosome of lengths no longer than a few hundred base pairs in tens of individuals (Duchen et al. 2013). Because the data were so sparse, models assuming independence between polymorphic sites were fit to statistics sensitive to the site frequency spectrum (SFS) and to short-scale LD measuring the correlation between polymorphic sites separated by short distances (Duchen et al. 2013).
The availability of the Drosophila Genetic Reference Panel (DGRP) (version 1), consisting of 168 fully-sequenced D. melanogaster strains from a single population in Raleigh, North Carolina (Mackay et al. 2012), offered the opportunity to study genome-wide signatures of demography and selection in a deep sample. Recently, we analyzed patterns of LD and haplotype homozygosity at distances of ∼10 kb in the DGRP data set (Garud et al. 2015) and compared these patterns with neutral expectations generated under several demographic models of North American D. melanogaster, including two constant Ne models, two bottleneck models, and two recently inferred admixture models (Duchen et al. 2013), one of which is considered to be the most accurate model of the admixture between the European and African flies founding North American D. melanogaster. We found that LD and haplotype homozygosity in the DGRP data are elevated relative to expectations under any of the demographic models tested and that this elevation remained even after controlling for several potential sources of elevated LD, including close relatedness between individuals, presence of genomic inversions, recombination rate variation, and population substructure.
In addition, we identified regions in the DGRP data with the elevated haplotype homozygosity, measured using statistic H12, designed to detect both hard and soft sweeps (Garud et al. 2015). H12 calculates haplotype homozygosity after combining the frequencies of the first- and second-most common haplotypes in order to increase the power to detect soft sweeps. Among the three highest-ranking candidates in the H12 scan were the prominent known cases of soft sweeps at the loci Ace, Cyp6g1, and CHKov1 (Karasov et al. 2010; Schmidt et al. 2010; Magwire et al. 2011). All 50 outlier H12 peaks in the DGRP data showed signatures of partial soft sweeps, suggesting that soft sweeps were common in the DGRP data (but see Schrider et al. 2015).
The extent to which soft sweeps are specific to this Raleigh population remains unknown. Several factors challenge the interpretation of the results of the DGRP data set, and we sought to address them in this study. First, the Raleigh population, like all other North American populations of D. melanogaster, is a recently-derived population resulting from admixture between European and African lineages of flies (Pool et al. 2012; Duchen et al. 2013; Bergland et al. 2015). The effects of admixture on patterns of LD and haplotype homozygosity are still yet to be fully understood, and furthermore, the true demographic history of North American flies is undoubtedly much more complex than our current models can possibly capture. For example, Pool (2015) showed that epistatic interactions between African alleles and European alleles are abundant in the North American population and that these combinations of alleles appear to be experiencing selection against them.
Second, the flies composing the DGRP data set were extensively inbred to result in mostly homozygous genomes. This inbreeding process left behind tracts of residual heterozygosity, which were suggested by Houle and Marquez (2015) to result from epistatic interactions between inversions (particularly heterozygous inversions that may be lethal as homozygotes) maintained on different chromosomes or other deleterious mutations in repulsion. Unfortunately, this may result in elevations in long-range LD, since regions of the genome bearing deleterious mutations may have to be maintained in sync with other potentially nondeleterious regions of the genome. Otherwise, the compound effect of two deleterious regions present in the genome could be lethal.
Recently, the Drosophila Genome Nexus dataset was published (Lack et al. 2015), consisting of 205 DGRP strains from Raleigh (inclusive of the original 168 DGRP strains available in the initial release) as well as 197 strains from Zambia. The Zambian data set offers the opportunity to test whether signatures observed in the Raleigh population are generic to multiple populations of D. melanogaster. Importantly, the two features of extensive admixture in the Raleigh population and inbreeding of the flies to generate the data set are absent from the Zambian lines. First, as the likely ancestral D. melanogaster population, the Zambian population has experienced relatively little admixture (Pool et al. 2012). Second, since Zambian flies have a much higher level of genetic diversity (Pool et al. 2012) and deleterious load, the flies cannot be fully inbred to generate phased haplotypes for the sequenced data set. Instead, Langley et al. (2011) used a crossing technique to generate and sequence haploid embryos from isofemale strains. The lack of admixture and lower levels of inbreeding in the Zambian lines make a comparison of patterns of LD and haplotype homozygosity between the Zambian data and the Raleigh data particularly informative in understanding general patterns of soft selective sweeps in D. melanogaster.
In this article, we compared patterns of LD and haplotype homozygosity in flies sampled from Raleigh and Zambia. We found that LD and haplotype homozygosity in both Raleigh and Zambian lines were elevated relative to neutral expectations, suggesting that elevated LD and haplotype homozygosity is a generic feature of multiple D. melanogaster populations. Furthermore, our H12 scan of the Zambian lines revealed several peaks in genomic locations different from that of the scan in Raleigh lines, many of which showed signatures of soft sweeps with multiple haplotypes at high frequencies, and several which showed signatures of hard sweeps with one main haplotype at high frequency. In the Zambian data set, we recovered peaks at two positive controls, Ace and Cyp6g1, but these were not the highest-ranking peaks as in the Raleigh data set; reflecting the lower frequencies at which the adaptive mutations are found in ancestral African populations than in derived populations. We do not recover a peak at CHKov1, which is a negative control in African populations since the adaptive mutation has been shown to be present at high frequencies only in non-African populations (Aminetzach et al. 2005). While the patterns of elevated long-range LD and multiple haplotypes at high frequencies in both populations show that soft sweeps may be common in both populations, the differences in genomic locations of individual selective sweeps were consistent with different underlying selective pressures and evolutionary processes in the two populations.
Materials and Methods
Data
In this article we compare patterns of LD and haplotype homozygosity in the Raleigh and Zambian D. melanogaster populations measured along the four autosomal arms. In our analysis, we masked regions of identity by descent (IBD), regions between genomic inversion breakpoints, and tracts of residual heterozygosity resulting from the inbreeding of the Raleigh strains, which were all previously inferred by Corbett-Detig and Hartl (2012), Huang et al. (2014), and Lack et al. (2015). For Zambian strains, we also masked previously inferred regions of admixture from Europe into Africa (Pool et al. 2012; Lack et al. 2015) (see Supplemental Material, File S1 for details). Finally, we excluded regions of the genome with low recombination rates <1 cM/Mb, using female meiosis rates from Comeron et al. (2012). The extensive masking of this data set resulted in large tracts of missing data across several individuals and introduced variation in the sample size at different sites in the genome. To account for this variation, we subsampled both the Raleigh and Zambian data to 100 strains, excluding the worst strains in terms of missing data (File S1). We refer to this first data set as the stringently-filtered data set (Table S2).
Later in this article we perform an H12 scan of the Zambian and Raleigh data sets along the four autosomal arms to identify individual selective events in each population. To maximize our coverage and power to identify selective sweeps, we applied less-stringent filters to the data by masking tracts of residual heterozygosity and additional heterozygous sites as before, but not masking any inversions, regions of inferred admixture, or IBD tracts. Instead, we a posteriori tested for enrichment of selective sweeps in genomic regions with inversions present at high frequency in the data set. In addition, instead of masking IBD tracts, we excluded all individuals with genome-wide IBD levels with at least one other individual at >20% (File S1). This resulted in 178 and 188 strains in the Raleigh and Zambian data sets, respectively. We further downsampled the data sets to 145 strains excluding the strains with the highest amount of missing data (File S1) to match the sample depth of our previous H12 scan (Garud et al. 2015). Finally, we excluded regions of the genome with recombination rates <0.5 cM/Mb (using female meiosis rates from Comeron et al. 2012). We refer to this second data set as the less-stringently-filtered data set.
LD estimates
We measured LD in the stringently-filtered data and in neutral simulations using the r2 statistic (Figure 1, Figure S1, and Figure S2). If any SNP had missing data in the stringently-filtered data, the individuals with the missing data were excluded from the LD calculation as in Jakobsson et al. (2008). At least four individuals without missing data at both SNPs were required to compute LD, otherwise the SNP pair was discarded.
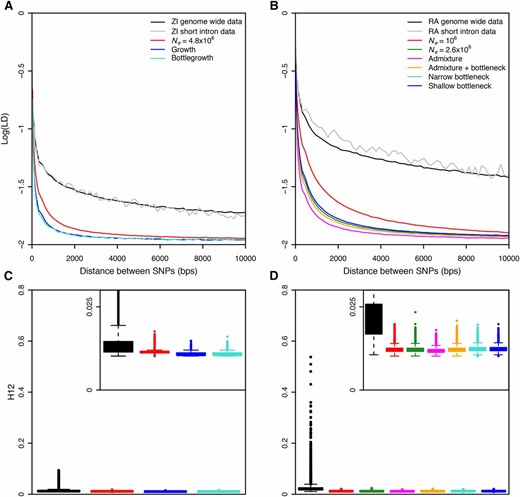
Elevated long-range LD and haplotype homozygosity in Zambia and Raleigh populations. LD in (A) Zambia (ZI) and (B) Raleigh (RA) is elevated as compared to any neutral demographic model, especially for long distances. H12 values measured in (C) 801 SNP windows downsampled to 401 SNPs in Zambian data and (D) 401 SNP windows in Raleigh data were higher than expectations under any neutral demographic model tested. Pairwise LD and H12 were calculated in Zambian and Raleigh data along the regions of the autosomal arms of the D. melanogaster genome in samples of 100. Since low recombination can result in elevated LD, we excluded regions of the genome with recombination rates <1 cM/Mb (Comeron et al. 2012) and performed all neutral simulations with this recombination rate. This recombination rate should be conservative for our purposes as this was the lowest recombination rate in our data. In (A) and (B), pairwise LD was averaged over 107 simulations in each neutral demographic scenario. In (C) and (D), H12 values measured in ∼1.5 × 10⁵ simulations under each neutral demographic model, which represents >10 times the number of analysis-observed windows in the data, are plotted.
We smoothed the LD plots in Figure 1, Figure S1, and Figure S2 by averaging LD values binned according to the distance between SNPs. We initially binned LD values in nonoverlapping 20-bp windows until a distance of 300 bp. After that, LD values were binned in 150-bp nonoverlapping windows. We chose two different bin sizes for short-range and long-range LD because LD decays rapidly at short distances.
Genomic scan for selective sweeps in Zambian and Raleigh data using H12
We scanned the autosomal arms of the Zambian and Raleigh genomes in the less-stringently-filtered data sets for selective sweeps using the haplotype homozygosity statistic H12, designed to detect hard and soft sweeps (Garud et al. 2015) (Figure 2). For the Zambian data we used analysis windows of 801 SNPs randomly downsampled to 401 SNPs (Figure 2). For the Raleigh data, we used windows of 401 SNPs. The centers of the windows were separated by 50 SNPs. Haplotypes were grouped together only if they matched at all sites. Any haplotype with missing data matching multiple haplotypes at all sites except the sites with missing data were randomly grouped with one other matching haplotype.
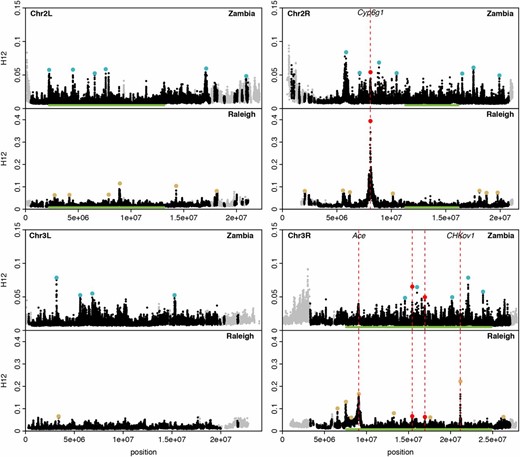
H12 scan in Zambian and Raleigh data. We performed an H12 scan in Zambian data with windows of size 801 SNPs downsampled to 401 SNPs and in Raleigh data with windows of size 401 SNPs. Each data point represents the H12 value calculated in an analysis window centered at that particular genomic position, with window centers separated by 50 SNPs. Gray points indicate regions on the autosomal arms with recombination rates lower than 0.5 cM/Mb (Comeron et al. 2012) excluded from our analysis. Green bars indicate common inversions. There are multiple overlapping inversions on chromosome 3R. Red, blue and yellow points highlight the top 25 H12 peaks in each respective scan relative to the median H12 value in the data. Red points indicate peaks that overlap both scans whereas blue and yellow points indicate peaks unique to Zambia and Raleigh, respectively. The three highest peaks in the Raleigh scan correspond to known cases of soft sweeps at Ace, CHKov1, and Cyp6g1. We also observed peaks at Ace and Cyp6g1 in the Zambian scan, but these did not rank as highly because the adaptive alleles at these loci were at lower frequencies at these sites. See Figure S5 for a higher-resolution H12 scan.
To identify selective events, we called H12 peaks in the data. We grouped together consecutive tracts of H12-analysis windows lying above the median H12 value in the data, and chose the highest H12 value among all windows in the peak to represent the H12 value of the entire peak. We defined the edge coordinates of each peak as the smallest and largest coordinates of all SNPs comprising a peak across all windows. After identifying all peaks, we iterated through the peaks in reverse order starting with the highest H12 value and excluded all peaks within 500 kb from the center of each peak, until all peaks had been accounted for. This avoided the potential problem of identifying multiple peaks in the same genomic region belonging to the same selective event. Finally, we excluded peaks with edge coordinates overlapping any region identified by Comeron et al. (2012) with ρ <0.5 cM/Mb.
To identify selective events occurring in both the Zambian and Raleigh populations, we found overlapping peaks, where an overlap was defined as the intersection of coordinate pairs for the peaks identified in the Zambian and Raleigh data sets. For more details on calculating the probability of an overlap of peaks by chance in the Zambian and Raleigh scans, see File S1.
Demographic inference
To assess whether LD and haplotype homozygosity levels observed in the Zambian and Raleigh data are elevated relative to neutral expectations, we measured LD and haplotype homozygosity in neutral models inferred for Zambian and Raleigh data. We inferred demographic models for the Zambian data using the program DaDi (Gutenkunst et al. 2009) and used previously inferred demographic models for the Raleigh data (Duchen et al. 2013; Garud et al. 2015). DaDi calculates a log-likelihood of the fit of a model based on an observed SFS. We estimated the SFS for presumably neutral SNPs in Zambian data using segregating sites in short introns (Parsch et al. 2010) from the stringently-filtered data set. We used every site in a short intron of length <86 bp, with 16 bp removed from the intron start and 6 bp removed from the intron end (Lawrie et al. 2013). Unlike the stringently-filtered data set we used to calculate estimates of LD, we did not remove any strains before inferring the models, and instead projected the SFS down to 100 samples at each polymorphic site. This procedure resulted in 73,197 SNPs in the Zambian data out of a total of 738,024 bp.
The models we fit to the Zambian short-intron data include a bottleneck model, a growth model, a three-epoch model with a bottleneck followed by expansion (hereafter, ‘bottlegrowth’), and a constant Ne model (Table S1). For the bottleneck and bottlegrowth models, we inferred four free parameters: the bottleneck size, the bottleneck time, final population size, and the final population time. For the growth model, we inferred two free parameters: final population size and duration of growth. Finally, we also inferred a constant Ne = 4,789,108 (∼4.8 × 10⁶) for the constant-population-size model using a Watterson’s θ estimate of the Zambian data and assuming a mutation rate of 10−9/bp/generation.
To compare levels of LD and haplotype homozygosity in Raleigh data, we used six neutral demographic models fit to Raleigh data: an admixture model for North American flies (Duchen et al. 2013); a variant of the admixture model which includes a bottleneck in one of the contributing populations (Duchen et al. 2013); two bottleneck models we previously fit to the DGRP data (Garud et al. 2015); and two constant Ne models, one where Ne = 106 and the other where Ne = 2,603,678 (∼2.6 × 10⁶), fit to Watterson’s θ estimate for the short-intron region of the stringently-filtered Raleigh data, similar to the constant Ne model we previously inferred (Garud et al. 2015).
Simulations of neutral demographic scenarios and selection scenarios
To compare LD and haplotype homozygosity levels measured in the stringently-filtered data vs. in simulations under neutral demographic scenarios, we simulated population samples under the neutral demographic models fit to Zambian and Raleigh data with the coalescent simulator MSMS (Ewing and Hermisson 2010). We simulated samples of size 100 with a recombination rate of 1 cM/Mb to match the sample depth and the minimum recombination rate observed in the stringently-filtered data. We assumed a neutral mutation rate of 10−9 mutations/bp/generation (Keightley et al. 2009).
To assess whether H12 and H2/H1 [a ratio of haplotype homozygosity calculated without (H2) and with (H1) the most frequent haplotype in the sample] values observed at the top H12 peaks are more likely under hard vs. soft sweeps, we performed a Bayes factor (BF) analysis. In our BF analysis, we used MSMS to simulate hard and soft sweeps in sample sizes of 145, matching the sample depth of the less-stringently-filtered data. We simulated hard and soft sweeps arising from de novo mutations by specifying the population parameter θA = 4NeµA at the adaptive site to be 0.01 and 10, respectively; matching the parameter estimates used in Garud et al. (2015). The adaptive site was always placed in the center of the locus. We performed 106 hard and soft sweep simulations in constant Ne ≈ 4.8 × 10⁶ and 2.6 × 10⁶ scenarios, matching the expected constant Ne population sizes for the Zambian and Raleigh populations, respectively. We assumed a neutral mutation rate of 10−9 events/bp/generation (Keightley et al. 2009) and recombination rates of 0.5 and 5 cM/Mb, reflecting the range of recombination rates observed in the data. We also assumed codominance, whereby a homozygous individual bearing two copies of the advantageous allele has twice the fitness advantage of a heterozygote. The selection coefficient (s), partial frequency of the adaptive allele after selection ceases (PF), and time since selection ceased (TE) were drawn from uniform prior distributions (U) as follows: s ∼ U(0,1), PF ∼ U(0,1), and TE ∼ U(0,1000) generations.
Data availability
The authors state that all data necessary for confirming the conclusions presented in the article are represented fully within the article.
Results
Slow decay of LD in the Zambian and Raleigh populations relative to neutral expectations
We compared the decay in LD in the Zambian data with expectations under neutral demographic models fit to the data (Figure 1A). We inferred four simple neutral demographic models fit to short introns in the Zambian lines using the program DaDi (Gutenkunst et al. 2009): a constant Ne demographic model, a bottleneck model, a growth model, and a bottlegrowth model). The number of segregating sites (S) and pairwise diversity (π) for each model match empirical estimates from short-intron data in the Zambian population (Table 1). The log-likelihoods of each model and their inferred parameters are presented in Table S1. Based on the log-likelihoods, the bottlegrowth model and bottleneck models have the best fits. However, since even the bottleneck model experiences a growth in population size, we decided to focus on the bottlegrowth model. In addition, we estimated the decay in LD in simulations of the constant Ne and growth models as points of comparison.
S and π measured in neutral demographic models of Zambian and Raleigh populations of D. melanogaster
| Data/model | S/bp (%) | π/bp (%) |
|---|---|---|
| Zambia | ||
| Short-intron data | 10.1 | 1.6 |
| Constant Ne ≈ 4.8 × 10⁶ model | 9.9 | 1.9 |
| Growth model | 10.2 | 1.1 |
| Bottlegrowth model | 12.1 | 1.7 |
| Raleigh | ||
| Short-intron data | 5.8 | 1.2 |
| Admixture model | 5.8 | 1.1 |
| Admixture + bottleneck model | 5.6 | 1.3 |
| Constant Ne = 106 model | 2.3 | 0.4 |
| Constant Ne = 2.6 × 10⁶ model | 5.8 | 1.1 |
| Severe short bottleneck model | 5.7 | 1.1 |
| Shallow long bottleneck model | 5.5 | 1.1 |
S and π estimates for Zambian and Raleigh short-intron data and demographic models fit to their corresponding short-intron data. Estimates of S and π were averaged over 30,000 simulations of 10,000 bp for each demographic model.
| Data/model | S/bp (%) | π/bp (%) |
|---|---|---|
| Zambia | ||
| Short-intron data | 10.1 | 1.6 |
| Constant Ne ≈ 4.8 × 10⁶ model | 9.9 | 1.9 |
| Growth model | 10.2 | 1.1 |
| Bottlegrowth model | 12.1 | 1.7 |
| Raleigh | ||
| Short-intron data | 5.8 | 1.2 |
| Admixture model | 5.8 | 1.1 |
| Admixture + bottleneck model | 5.6 | 1.3 |
| Constant Ne = 106 model | 2.3 | 0.4 |
| Constant Ne = 2.6 × 10⁶ model | 5.8 | 1.1 |
| Severe short bottleneck model | 5.7 | 1.1 |
| Shallow long bottleneck model | 5.5 | 1.1 |
S and π estimates for Zambian and Raleigh short-intron data and demographic models fit to their corresponding short-intron data. Estimates of S and π were averaged over 30,000 simulations of 10,000 bp for each demographic model.
We observed a substantial elevation in LD in the data relative to neutral expectations under all demographic models (Figure 1A). We estimated LD for different minor allele frequency (MAF) classes of SNPs in which both SNPs in an LD pair had MAFs between 0.05 and 0.5 (Figure 1A), 0.3 and 0.5 (Figure S1A), and 0 and 0.05 (Figure S1B). Using a two-sided Wilcoxon rank sum test to test the significance of the deviation in LD from neutral expectations, the P-value was <10−15 in all cases. The deviation in LD in the data from expectations is apparent at short distances <100 base pairs, consistent with observations of Przeworski et al. (2001) for multiple species of Drosophila, as well as for long distances, consistent with our previous results (Garud et al. 2015).
In Figure 1B and Figure S1, C and D, we reiterated our previous result in Garud et al. (2015) in the Raleigh data set and confirmed that there is an elevation in LD in the Raleigh population relative to the six neutral demographic models fit to the Raleigh data in terms of S and π (Table 1). The models we tested included admixture, bottleneck, and constant Ne models (see Materials and Methods). Unlike the LD in the Zambian data set, the deviation in LD from neutral expectations is even more exaggerated in the Raleigh data set (for all MAFs conditioned on and demographic models tested, P < 10−15 for a two-sided Wilcoxon rank sum test). These findings are consistent with previous findings showing that the elevation in LD is muted in an ancestral Zimbabwean population relative to non-African populations (Andolfatto and Wall 2003). The elevation of LD in both Zambian and Raleigh data suggests that elevated LD is a generic feature of multiple D. melanogaster populations.
To confirm that the elevation in LD is not driven by any anomaly in the data; such as unaccounted related individuals, inversions, or strains with unusually high polymorphism or sequencing error rates; we subsampled the Zambian and Raleigh data sets 10 times to 50 strains to test whether any subset of individuals may be driving the elevation in LD. In all subsampled data sets, LD remains elevated in contrast to expected LD measured in all tested demographic models simulated with a sample size of 50 (P < 10−15 for all scenarios tested, two-sided Wilcoxon rank sum test) (Figure S2), suggesting that the elevation in LD is driven by population-wide phenomena.
Finally, although we excluded the intervals between all inversion breakpoints from our stringently-filtered data (File S1), we tested whether LD within 100 kb of the inversion breakpoints is elevated relative to the rest of the genome since inversions can impact LD at long ranges. We found that the mean difference in LD in regions within 100 kb vs. beyond 100 kb of inversions have little biological difference for both the Raleigh and Zambian populations (Table S3).
Elevation of haplotype homozygosity in the Zambian and Raleigh populations relative to neutral expectations
We compared the distribution of haplotype homozygosity measured with H12 in the Zambian and Raleigh data sets with the distribution of H12 values measured in neutral demographic scenarios fit to the two populations (Figure 1, C and D). H12 is designed to detect both hard and soft sweeps and is calculated by combining the frequencies of the two most abundant haplotypes in an analysis window (Garud et al. 2015). For the Raleigh data, we applied the statistic in analysis windows of 401 SNPs (200 SNPs on each side of the central SNP of each window) with the centers of each window iterated by 50 SNPs. 401 SNPs correspond to ∼10 kb in the Raleigh data (Garud et al. 2015). In the Zambian data, however, 801 SNPs correspond to ∼10 kb. Therefore, we applied the statistic in 801 SNP windows randomly downsampled once to 401 SNPs in the Zambian data to have comparable analysis windows sizes in terms of SNPs and base pairs for both scans. As we show in Figure 1, C and D, a window of this length scale is unlikely to generate high values of LD or haplotype homozygosity by chance under neutrality. We measured H12 in 150,000 simulations of each neutral demographic scenario, representing >10 times the number of analysis windows observed in the data.
Figure 1, C and D, shows that there is a long tail of high H12 values in both the Zambian and Raleigh data sets relative to the distribution of H12 measured in simulations under all neutral demographic models tested, confirming our previous results (Garud et al. 2015) that showed that all the neutral demographic scenarios we tested are unable to generate the haplotype structure observed in the Raleigh data by chance (P < 10−15, Wilcoxon rank sum test, for all neutral demographic scenarios tested). The elevation in H12 values in the tail is muted in the Zambian data set with the highest H12 value reaching only 0.0936, whereas in the Raleigh data set, the highest value reached 0.5374. In the Raleigh data set, the median H12 value (0.0202) is sharply elevated above the median H12 value measured in simulations (∼0.012 across all demographic scenarios). In the Zambian data set, we found that the median H12 value in the data (0.0124) is also elevated relative to the median H12 value measured in simulations (∼0.0109 across all demographic scenarios). To identify analysis windows with H12 values significantly higher than expected under neutrality, we calculated critical values (H12o) under the constant Ne models fit to Zambian and Raleigh data using a one-per-genome false discovery rate (FDR) criterion (File S1). We found that ∼64 and ∼19% of the windows in the Raleigh and Zambian data sets, respectively, have H12 > H12o, where H12o = 0.0182 and 0.0152 in the Raleigh and Zambian data sets, respectively. Note that these H12o values are comparable to the median values observed in the data, as we observed previously (Garud et al. 2015).
Identification of selective sweeps in the Zambian and Raleigh data
To identify individual selective sweeps, we performed an H12 scan along the four autosomal arms of D. melanogaster in the less-stringently-filtered Zambian and Raleigh data sets (Figure 2). We used the less-stringently-filtered data sets to avoid missing sweeps due to the extensive masking in the stringently-filtered data. Before performing the scan, we compared the distributions of H12 values measured in the stringently- and less-stringently-masked data sets and found that the distributions are similar (Figure S3 and Figure 1, C and D) with an elevation of the tails and medians of H12 values in the data relative to neutral demographic simulations. To perform the scan, we applied H12 to Raleigh data in windows of 401 SNPs and to Zambian data in windows of 801 SNPs randomly downsampled once to 401 SNPs (Figure 2).
To identify individual selective sweeps in the Zambian and Raleigh data, we called H12 peaks, where a peak is defined as a consecutive tract of H12 windows lying above the median H12 value in the data (Garud et al. 2015; File S1). To focus on the most extreme selected events, we highlighted the top 25 H12 peaks in each scan in Figure 2. As previously observed in Figure 1, C and D, and Figure S3; the H12 values at the peaks in the Zambian data are lower overall than in the Raleigh data. Reflecting this lower level of H12 in Zambian data, in Figure 2 the Zambian scan has a shorter y-axis than the Raleigh scan to have better resolution to identify individual selection events, but we show this data again in Figure S4 with the same y-axis as in Raleigh. In Table S4, we give the start and end coordinates of the top 25 peaks found in the Zambian and Raleigh data sets.
H12 peaks are distributed across the autosomal arms in both the Zambian and Raleigh populations, suggesting that no single region of the genome is driving the elevation of H12 values observed in the data. The exception to this is an enrichment of peaks on chromosome 3R where there are inversions present at high frequencies in Zambian data (Figure 2; see Table S5 for the enrichment calculations).
The overlap in peaks in the Zambian and Raleigh scans in Figure 2 is small but significant. Exactly 3 of the top 25 peaks in the Raleigh scan overlap, which is greater than expected by chance (one-sided binomial probability < 0.022, see File S1 for calculations). One of the overlapping peaks coincides with the positive control Cyp6g1 on chromosome 2R, and two of the overlapping peaks are on chromosome 3R.
The lack of coincidence at the rest of peaks does not necessarily mean that the selective events in Zambia and Raleigh are independent; in cases where there is no overlap, it is possible that there are sweeps in one of the populations that did not rank among the top 25 peaks. For example we recovered H12 peaks at the positive controls Cyp6g1 and Ace in both the Raleigh and Zambian data sets. While peaks at Cyp6g1 and Ace rank 1st and 3rd in the Raleigh scan, they rank 14th and 35th in the Zambian scan. Therefore Ace does not show up as an overlap among the top 25 peaks. The lower rank of the peaks at Ace in the Zambian scan reflects the lower frequencies at which the adaptive mutations at Ace are present in the Zambian and Raleigh data respectively: ∼16% in the Zambian and ∼40% in the Raleigh populations. The second-ranking peak in the Raleigh data is at the positive control CHKov1, reiterating our previous result (Garud et al. 2015). However, this peak is absent in the Zambian scan, consistent with the previous observation that the adaptive mutation at CHKov1 is present at high frequencies in out-of-Africa populations and rare in Africa (Aminetzach et al. 2005).
To determine if the peaks in Zambia are truly independent from those in Raleigh, we investigated whether any of the top three common haplotypes among the 25 peaks in the Zambian data are also common in Raleigh. We focused on the top three haplotypes because these compose the bulk of the haplotype homozygosity, H12, at the top peaks. To identify shared common haplotypes, we examined haplotype frequency spectra in a joint data set consisting of both Zambian and Raleigh lines. We looked for matching haplotypes in the analysis windows matching the start and end coordinate positions of the analysis windows with the highest H12 values in each of the 25 Zambian peaks. We found only one peak with a common haplotype shared among nine Zambian individuals and eight Raleigh individuals. This peak is at the location of the Cyp6g1 selective sweep. We did the reverse and investigated whether any of the top three common haplotypes among the 25 peaks in the Raleigh data are also common in Zambia. We found substantial haplotype sharing at Ace with 7 Zambian haplotypes matching 34 Raleigh haplotypes. The peak closest to Ace had three Zambian haplotypes matching seven Raleigh haplotypes, potentially because this peak belongs to the same selective event as Ace. At CHkov1, 8 Zambian haplotypes matched 34 Raleigh haplotypes. We did not find any significant haplotype sharing at Cyp6g1. This may be because the centers of the peaks at Cyp6g1 in the Zambian and Raleigh populations are slightly offset.
Haplotype structure at the top H12 peaks in the Zambian and Raleigh scans
To gain intuition about the haplotype structure at the top peaks in the H12 scans of the Raleigh and Zambian data sets, we visualized the haplotype frequency spectra in the analysis window with the highest H12 value at each of the top 25 peaks (Figure 3). There is substantial haplotype homozygosity in the two populations, which we previously saw cannot be generated by the simple neutral demographic scenarios tested in Figure 1.
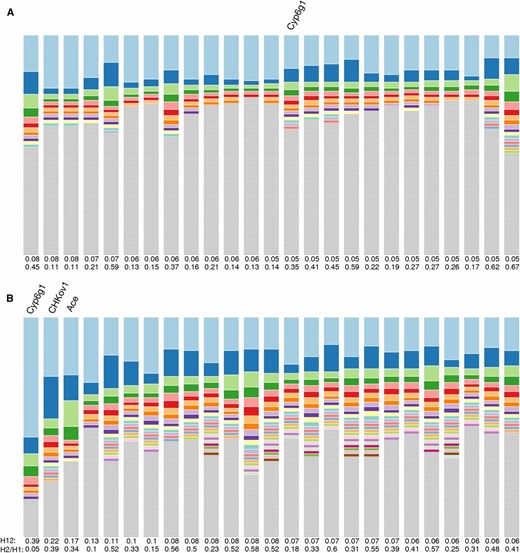
Haplotype frequency spectra for the top 25 H12 peaks in Zambian and Raleigh data. Shown are haplotype frequency spectra for the top 25 peaks in the (A) Zambian scan conducted in 801 SNP windows downsampled to 401 SNPs and the (B) Raleigh scan conducted in 401 SNP windows. For each peak, the frequency spectrum corresponding to the analysis window with the highest H12 value was plotted. The height of the top shaded region (light blue) in each bar indicates the frequency of the most prevalent haplotype in the sample of 145 individuals, and heights of subsequent colored bars indicate the frequency of the second, third, and so on most-frequent haplotypes in a sample. Gray bars indicate singletons. In Zambia, sweeps reach a smaller partial frequency than in Raleigh. Many peaks in the Zambian data have multiple haplotypes present at high frequency, indicative of soft sweeps; and many peaks have a single haplotype dominating the haplotype spectra, indicative of hard sweeps. In Raleigh all sweeps have multiple haplotypes at high frequency consistent with signatures of soft sweeps.
The signals in Zambian data are weaker than in Raleigh with the sweeps reaching a smaller partial frequency. This is consistent with the muted elevation in LD and haplotype homozygosity in the Zambian data set relative to the Raleigh data set. In the Zambian data, some peaks have a single dominant haplotype, which is consistent with signatures of hard sweeps; while many peaks have multiple frequent haplotypes, consistent with signatures of soft sweeps. This is unlike Raleigh data where multiple high-frequency haplotypes appear at all the top peaks, as we previously observed (Garud et al. 2015).
In the next section, we will consider several scenarios that can generate the haplotype structure we observe in the data including (i) more complex demographic processes than we have already tested, such as undetected admixture and backflow, (ii) hard sweeps that have decayed early in the sweep trajectory (Messer and Neher 2012; Schrider et al. 2015), and (iii) soft sweeps.
Could demographic processes generate the bulk of the haplotype structure in Zambian data?
We showed earlier in Figure 1 that simple neutral demographic models including bottleneck models, bottlegrowth models, and constant Ne models cannot generate the elevated LD and haplotype homozygosity observed in the data. However, it is possible that more complex effects that are not captured by the tested demographic models may be contributing to the elevated H12 values in the data. The demographic processes we test in this section include structure, admixture, and backflow of individuals from North America to Zambia.
We tested for any underlying population structure in the Zambian data. To do so, we tested whether the same strains show up more often than others among the top three haplotypes at each peak. We focused on the top three haplotypes because they comprise the bulk of the haplotype homozygosity measured by H12. Almost all the Zambian strains (186 out of 188) appear at least once among the top three haplotypes across all 25 peaks. However, some strains are found in the top haplotypes more often than others. There is a slight enrichment of strains appearing in the top haplotypes: 15 strains show up in the top 3 haplotypes in 9 or more peaks, but not necessarily in the same peak (P = 0.0017, see File S1 for permutation analysis). This suggests that some of the long-range LD observed in Figure 1 can be explained by some low-level structure in the data, but that the majority of the haplotype homozygosity at the peaks is not driven by the same strains.
Undetected backflow of flies from North America to Zambia could result in common haplotypes in North America migrating to Zambia, which could generate H12 peaks in the Zambian data. Thus we tested whether the bulk of the homozygosity at the top 25 peaks in the Zambian data set can be explained by backflow from North America to Zambia. Pool et al. (2012) inferred admixture tracts for each Zambian strain, which we used to determine if there is enrichment for admixture in strains comprising the three most common haplotypes vs. strains comprising all other haplotypes in the analysis window with the highest H12 value at each of the 25 peaks. We first overlapped the start and end coordinates of all admixture tracts with the start and end coordinates of the window with the highest H12 value in each peak and found that 21 peaks overlap at least one tract. We then checked if the strains harboring the tracts are among the top three haplotypes and found that only one peak has one strain with an admixture tract in the top three haplotypes. The rest of the strains with admixture tracts overlapping the top 25 peaks were either among lower-ranking haplotypes or were not included in the analysis window because of missing data (see Materials and Methods and File S1). This result indicates that admixture is not driving the bulk of the haplotype homozygosity at the top 25 peaks.
We also compared genome-wide admixture levels in strains comprising the three most common haplotypes vs. strains comprising all other haplotypes in the analysis window with the highest H12 value at each of the 25 peaks. We found that of the 25 peaks tested, only 1 peak, located on chromosome 3R, had significant differences in levels of admixture (P = 0.01743997, Wilcoxon two-sided test), consistent with the expected number of false positives in 25 tests with a 0.05 significance level.
Backflow of flies from North America to Zambia could result in the sampling of genomic regions of low π since the haplotypes in these regions might be at greater frequencies in North America. As a consequence, these regions could generate H12 peaks in Zambia. We tested this scenario by measuring π in the less-stringently-filtered Raleigh data set in regions corresponding to the locations of top 25 peaks in the Zambian data vs. all other regions in the Raleigh data. We found that the mean π in the two types of regions are similar (P = 0.5393864, see File S1), which indicates that backflow is not responsible for generating the bulk of the haplotype structure at the top 25 peaks.
Finally, we also tested the reverse scenario of whether H12 peaks identified in the Raleigh data are enriched in the ancestry disequilibrium hubs identified by Pool (2015). An ancestry disequilibrium hub is characterized as a cluster of several African-African or European-European pairs of SNP with higher than expected levels of LD, suggesting that African-European SNP pairs are less compatible. We found that 2 of the top 25 peaks identified in the Raleigh scan overlap ancestry disequilibrium hubs (P = 0.2820319, binomial; see Materials and Methods), which is not different from what is expected by chance.
Given the lack of evidence for admixture or backflow driving the elevation in haplotype homozygosity at the top peaks in the Zambian data, it is likely that the majority of H12 peaks observed in the Raleigh and Zambian data sets are driven by independent forces in the two populations, with the exception of the positive controls, as we saw previously and will investigate further below.
Haplotype sharing in the Zambian and Raleigh populations at Ace, Cyp6g1, and CHKov1
In Figure 4 we further examine the haplotype frequency spectra at the Ace, Cyp6g1 and CHKov1 loci in a joint data set consisting of both Zambian and Raleigh lines to determine the extent of haplotype sharing at these loci. The population each haplotype is from is indicated. In this figure, the analysis window is centered around the known center of the selective sweep instead of the start and end positions of the analysis windows with the highest H12 values the selective sweep scans.
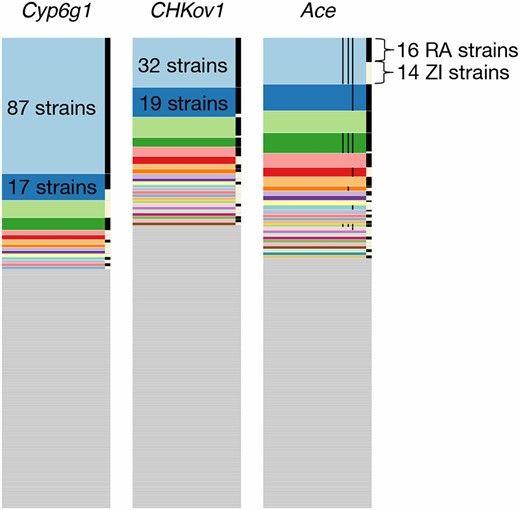
Haplotype frequency spectra at Cyp6g1, CHKov1, and Ace. Shown are haplotype frequency spectra at the three positive controls in a joint data set, comprising 300 Raleigh strains and Zambian strains in 801 SNP windows positioned at the sweep centers. 801 SNP windows in the joint data set correspond to a slightly smaller analysis window size (<10 kb) in terms of base pairs on average than in the Raleigh or Zambian data alone. On the right side of each of the frequency spectra are black and white bars, indicating which strains are from Raleigh (RA) and Zambia (ZI), respectively. At all three positive controls, common haplotypes are shared across the two populations. The thin black lines shown in the haplotype spectrum for Ace correspond to the presence of three adaptive mutations that confer resistance to pesticides at Ace. Three haplotypes have all three adaptive mutations. Raleigh and Zambian strains share two of these haplotypes.
At Ace, a common haplotype bearing three adaptive mutations previously discovered to confer resistance to pesticides in both Zambia and Raleigh is shared between 14 strains from Zambia and 39 strains from Raleigh. Another common haplotype in the Raleigh data comprised of 17 strains matches 1 Zambian strain and also bears the three adaptive mutations. The sharing of these haplotypes support the finding by Karasov et al. (2010) where it was observed that North American and Australian D. melanogaster strains share a haplotype bearing the three adaptive mutations, suggesting an out-of-Africa origin for this haplotype. Our finding provides a more complete adaptation history of Ace. All remaining high-frequency haplotypes are comprised exclusively of either Raleigh or Zambian strains, many of which bear one or three adaptive mutations, suggesting that this soft sweep has arisen multiple times on multiple continents.
At the CHKoV1 locus, we observe two common Raleigh haplotypes matching rare Zambian haplotypes: 17 Raleigh individuals and 2 Zambian individuals share one haplotype and 12 Raleigh individuals and 1 Zambian individual share another haplotype. Additionally, a third haplotype is shared between one Raleigh individual and two Zambian individuals. The sharing of common Raleigh haplotypes with rare Zambian haplotypes is consistent with the result in Aminetzach et al. (2005) that the adaptive allele at CHKoV1 is rare in African populations and common in derived populations.
At Cyp6g1, we observe a common haplotype shared in 10 Raleigh individuals and 7 Zambian individuals. All other haplotypes are comprised exclusively of Raleigh or Zambian strains. This result suggests that this sweep has either arisen multiple times on different continents, and/or may share a common origin, similar to the sweep at Ace.
Bayesian analysis of the softness of the peaks
The simple demographic models and the admixture and backflow scenarios tested previously in this article do not provide an obvious explanation for the elevated haplotype homozygosity observed in the Zambian and Raleigh data. In this section, we test whether selective sweeps can generate the patterns observed in the data.
To assess whether the top peaks in the two scans can be generated more easily under simulated hard and soft sweeps, we measured H2/H1 (Garud et al. 2015) in the windows with the highest H12 values at each of the top peaks. The statistic H2/H1, used in conjunction with H12, can distinguish hard and soft sweeps as long as the sweeps are not too weak, old, or soft (Garud et al. 2015). As we previously showed (Garud et al. 2015), a sweep that is too weak or old cannot be distinguished from neutrality with H12 because recombination events have decayed the sweep. Similarly, a sweep that is too soft to be detected by H12 has such a high number of unique haplotypes bearing an adaptive mutation that the sweep also cannot be distinguished easily from neutrality (Garud et al. 2015).
H2/H1’s ability to differentiate hard and soft sweeps is dependent on the value of H12 measured in the same analysis window. We previously demonstrated (Garud and Rosenberg 2015) that the range of possible H2/H1 values varies inversely with H12, and therefore the two statistics must be used in conjunction with each other. H2/H1 has high power to differentiate hard and soft sweeps when H12 is large and there is strong evidence for a sweep in the first place (Garud et al. 2015). Therefore, we measured H2/H1 at the top 25 peaks in the window with the highest H12 value where there is greatest evidence for a sweep.
We performed a BF analysis to assess the likelihood of a hard vs. soft sweep generating a particular pair of H12 and H2/H1 values for each of the top peaks. BFs are calculated as follows: BF = P(H12obs, H2obs/H1obs | Soft Sweep)/P(H12obs, H2obs/H1obs | Hard Sweep). We approximated BFs using an approximate Bayesian computation approach similar to our previous analysis (Garud et al. 2015) (see Materials and Methods). Similar to our previous analysis (Garud et al. 2015), we simulated hard sweeps with an adaptive mutation rate θA = 0.01 and soft sweeps with θA = 10. To assess the softness of the top 25 peaks in the Zambian data, we performed simulations with a constant Ne ≈ 4.8 × 10⁶ demographic model (matching the inferred Ne for the Zambian population, see Materials and Methods) and measured H12 and H2/H1 at the sweep center in windows of 801 SNPs downsampled to 401 SNPs. To assess the softness of the top 25 peaks in the Raleigh data, we performed simulations with a constant Ne = 2.6 × 10⁶ demographic model (matching the inferred Ne for the Raleigh population, see Materials and Methods) and measured H12 and H2/H1 at the sweep center in windows of 401 SNPs. We performed simulations with recombination rates of 0.5 and 5 cM/Mb, reflecting the range of recombination rates observed in the top 25 peaks in Zambian and Raleigh data (0.54–6.7 cM/Mb).
In Figure 5 we present panels of BFs measuring the relative support of hard vs. soft sweeps for a grid of different values of H12 and H2/H1 for the Zambian and Raleigh data. We tested two recombination rates for our analyses: in Figure 5, A and B, we use ρ = 0.5 and 5 cM/Mb, respectively. We measured H12 in a window centered at the selective site. As we already showed, the H12 values measured in Zambian data are lower relative to Raleigh. Given that signals are muted in Zambian data, for some peaks it is difficult to distinguish whether the sweeps are hard or soft. Nonetheless, the analysis shows that when ρ = 0.5 cM/Mb, 13 of the top 25 peaks in the Zambian data have H12 and H2/H1 values that are supported by soft sweeps, 10 peaks have H12 and H2/H1 values that are supported by hard sweeps, and 2 peaks that are borderline supported by hard or soft sweeps. This is in contrast to Raleigh data which all have high H12 and H2/H1 values that are well supported by soft sweeps, as we have seen previously (Garud et al. 2015). When ρ = 5 cM/Mb, we find that 18 of the top 25 peaks in the Zambian data have H12 and H2/H1 values that are supported by soft sweeps, 5 peaks have H12 and H2/H1 values that are supported by hard sweeps, and 2 peaks that are borderline supported by hard or soft sweeps. Again, all peaks in the Raleigh data are well supported by soft sweeps.
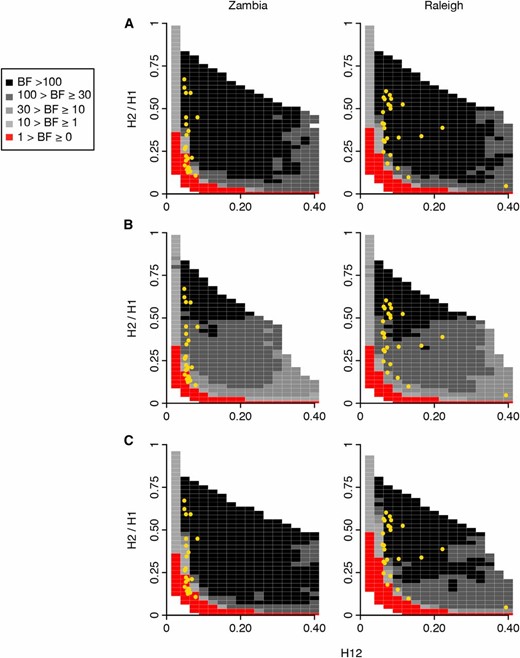
Range of H12 and H2/H1 values expected under hard and soft sweeps for Zambian and Raleigh data. BFs were calculated for a grid of H12 and H2/H1 values to demonstrate the range of H12 and H2/H1 values expected under hard vs. soft sweeps for the top 25 peaks in the Zambian and Raleigh scans. BFs were calculated by taking the ratio of the number of soft sweep vs. hard sweep simulations that were within a Euclidean distance of 0.1 of a given pair of H12 and H2/H1 values. Red portions of the grid represent H12 and H2/H1 values with stronger support for hard sweeps, while gray portions represent regions of space with stronger support for soft sweeps. Each panel presents the results from 106 hard sweep simulations generated with θA = 0.01 and 106 soft sweep simulations generated with θA = 10. For any colored square, at least 1000 hard and soft sweep simulations match the corresponding pair of H12 and H2/H1 values of the grid. White portions of the grid represent cases where fewer than 1000 simulations match the pair of H12 and H2/H1 values. Simulations were performed in samples of 145 individuals with a constant Ne ≈ 4.8 × 10⁶ demographic model for comparison with the Zambian data and a constant Ne ≈ 2.6 × 10⁶ demographic model for comparison with the Raleigh data. Overlaid on each plot in yellow are the observed H12 and H2/H1 values for the top 25 peaks for each scan. We tested the effect of varying recombination rates on the BF analysis: (A) ρ = 0.5 cM/Mb, and in (B) ρ = 5 cM/Mb. In (A) and (B) H12 was measured in an analysis window centered on the selected site. Panels (A) and (B) show that the H12 and H2/H1 values measured at the top 25 peaks in Zambian data are supported by both hard and soft sweeps, whereas the H12 and H2/H1 values measured in Raleigh are supported by soft sweeps rather than hard sweeps in all scenarios. Varying ρ changes a small number of peaks identified as hard vs. soft sweeps in the Zambian data. These peaks have low H12 values to begin with, making them difficult to distinguish between hard and soft sweeps definitively. In (C), instead of measuring H12 in a window centered on the selected site, the analysis window with the highest H12 value was first identified in a simulation of 100 kb, and then H2/H1 was measured. Here, ρ = 0.5 cM/Mb. In this scenario, a few peaks in the Raleigh data are borderline supported by soft sweeps, but the results in Zambia do not change.
In Figure 5C, we tested whether measuring H12 and H2/H1 at the sweep center in simulations is anticonservative for detecting soft sweeps. Schrider et al. (2015) showed that regions with the highest LD measured with the integrated haplotype score (Voight et al. 2006) are offset from the sweep center. Furthermore, Schrider et al. (2015) have suggested that this may be problematic for differentiating hard and soft sweeps since ‘soft shoulders’ of hard sweeps may not be distinguishable from soft sweeps. Soft shoulders are soft-looking sweeps to the left and right of hard sweeps that have decayed from recombination and mutation events. In Figure 5C we repeated our analysis in Figure 5A, except instead of centering our analysis window at the sweep center, we first identified the analysis window with the highest H12 value in a 100 kb simulated chromosome and then measured H2/H1 in this window. We found that our results do not change at all from Figure 5A for Zambian data. However, for Raleigh data, it is difficult to distinguish whether four peaks are best supported by hard or soft sweeps as they are borderline supported by both hard and soft sweeps since both can generate the observed H12 and H2/H1 values in the data.
Overall the substantial number of peaks with H12 and H2/H1 values consistent with soft sweeps in both populations suggests that soft sweeps are in general common in D. melanogaster.
Discussion
We previously showed that patterns of elevated LD and haplotype homozygosity consistent with soft sweeps are common in D. melanogaster strains from Raleigh (Garud et al. 2015). Here we compared these patterns with that of a second population from Zambia to test the extent to which this signal in the Raleigh population may be driven by peculiarities of the data such as the extensive admixture of the Raleigh population or the inbreeding performed to generate the sequenced lines. Unlike the Raleigh population, the Zambian population has undergone relatively little admixture, and instead of inbreeding lines, the data set was generated by sequencing haploid embryos.
We found that both LD and haplotype homozygosity were elevated at all distances in the Zambian and Raleigh data, relative to expectations in several neutral demographic models that match S and π estimates in the data. This elevation remained despite controlling for inversions, admixture, regions of low recombination, relatedness between individuals, missing data, sample size, and allele frequency. We conducted a scan for selective sweeps with the haplotype homozygosity statistic H12 and found signatures of multiple haplotypes at high frequency at the top 25 peaks in both the Zambian and Raleigh data sets. We did not find evidence for admixture or backflow generating the haplotype structure observed in Zambian data. Instead, we found that the signatures observed in this population are independent of the Raleigh population, with the exception of specific cases at the positive controls Ace, Cyp6g1, and CHKov1.
We performed a BF analysis to test whether the haplotype structure observed at the top 25 peaks can be generated by hard or soft sweeps. We used H12 and H2/H1 jointly to distinguish hard and soft sweeps since H2/H1 has power only when H12 is large and distinguishable from neutrality (Garud et al. 2015). We found that the H12 and H2/H1 values observed at the top 25 peaks in the Zambian data set are supported by hard and soft sweeps and that all of the top 25 peaks in the Raleigh data set are supported by soft sweeps, consistent with our previous observation that soft sweeps are common in Raleigh (Garud et al. 2015).
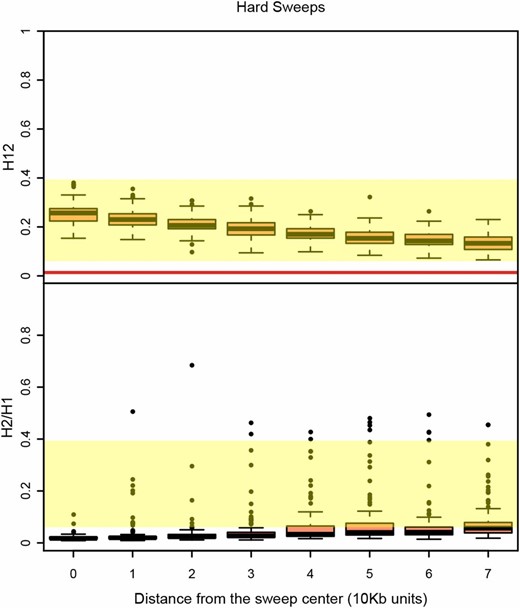
Why do we see so few hard sweeps, especially in Raleigh? One possibility is that hard sweeps are driven by weaker selection than we can detect with large ∼10-kb H12 analysis windows. To hone our intuitions about the range of H12 and H2/H1 values that we can expect for sweeps of varying selective strength, in Figure 6 and Figure S6 we measured H12 and H2/H1 in simulated partial hard and soft sweeps of varying selection coefficients ranging from 10−6 to 1 with ρ = 0.5 and 5 cM/Mb, reflecting the range of recombination rates observed at the top peaks in Zambian and Raleigh data (0.54–6.7 cM/Mb). We find that hard and soft sweeps must experience strong selection in order to be differentiable from neutrality. We also find that H12 has greater power to detect hard sweeps than soft sweeps, especially for strong selection coefficients. Strong selection generates high H12 values and low H2/H1 values for hard sweeps. For weaker selection, it is possible to generate high H2/H1 for hard sweeps, but then H12 values are muted. In general, hard sweeps do not naturally generate both high H12 and H2/H1, although weak selection can generate peaks with significant values of H12 and H2/H1. Indeed, in the Zambian data, we do observe several peaks with low H12 values and high H2/H1 values; these peaks could potentially be hard sweeps that have experienced weak selection and these are the peaks for which our Bayesian analysis fails to distinguish between soft and hard sweeps. However, many peaks in the Raleigh and Zambian data have very high H12 and H2/H1 values and these peaks are much more easily explained by soft sweeps driven by very strong selection.
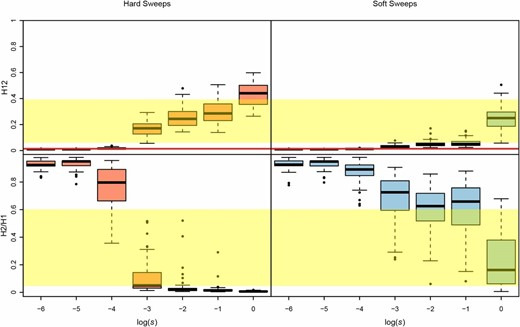
H12 and H2/H1 measured in sweeps of varying selective strength. Hard and soft sweeps were simulated with θA of 0.01 and 10, respectively, and with selection strengths (s) ranging from 10−6 to 1. All simulations were conducted with a ρ = 0.5 cM/Mb in a sample size of 145 individuals and with a constant Ne ≈ 2.6 × 10⁶ model fit to Raleigh data (see Materials and Methods). Each boxplot comprises 100 simulations with the frequencies of the adaptive allele ranging from 0.4 to 0.6. The yellow region shows the range of H12 and H2/H1 values observed in Raleigh data at the top 25 peaks. The red line shows the one-per-genome FDR value of H12 measured under neutrality with the Ne ≈ 2.6 × 10⁶ model (File S1). H12 values are distinguishable from neutrality only when s ≥ 10−3. Hard sweeps can generate high H12 and H2/H1 values in the scenario when s = 10−3. However, this changes when ρ = 5 cM/Mb (Figure S6), whereby sweeps are distinguishable from neutrality only when s ≥ 10−2 and hard sweeps can generate high H12 and some high H2/H1 values when s = 10−2.
Could hard sweeps that have had a chance to decay for varying amounts of time generate soft-looking sweeps? In Figure 7 and Figure S7 we measured the range of H12 and H2/H1 values we can expect for strong hard and soft sweeps that have decayed for varying amounts of time. We focused on strong sweeps in this example because in Figure 6 and Figure S6 we showed that weak sweeps could not be detected easily even when there has not been any decay. We find in Figure 7 and Figure S7 that hard sweeps that have the opportunity to decay for a specific amount of time can generate high H2/H1 values, but the H12 values in these cases are extremely muted and are only borderline higher than values expected under neutrality. We also find that decay eliminates the ability to detect soft sweeps. Thus, the soft sweeps we find in the data are likely to be very young.
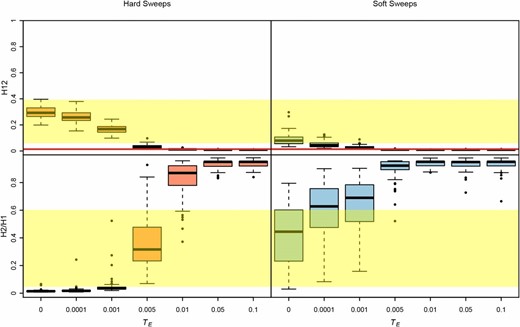
H12 and H2/H1 measured in sweeps decayed for varying amounts of time. Partial hard and soft sweeps were simulated with s = 10−1 and ρ = 0.5 cM/Mb. All sweeps ended at a frequency of 0.5 when selection ceased. Sweeps were allowed to decay for varying amounts of time after selection ceased (TE), ranging from 0 to 0.1*4Ne generations. Simulations were performed in a sample size of 145 individuals and with a constant Ne ≈ 2.6 × 10⁶ model fit to Raleigh data (see Materials and Methods). Each boxplot is comprised of 100 simulations. The yellow region shows the range of H12 and H2/H1 values observed in Raleigh data at the top 25 peaks. The red line shows the one-per-genome FDR value of H12 measured under neutrality with the Ne ≈ 2.6 × 10⁶ model. In most evolutionary scenarios, hard sweeps cannot produce both high H12 and H2/H1 values, unlike soft sweeps. Hard sweeps that have not decayed for >0.005*4Ne generations have H12 values that are large enough to be differentiated from neutrality. Hard sweeps that have decayed for 0.005*4Ne generations have high H2/H1 values, but the H12 values in this scenario are borderline distinguishable from neutrality. Figure S7 shows additional evolutionary scenarios.
Could the sides of hard sweeps, which have decayed due to recombination events, generate soft-looking sweeps, or soft shoulders (Schrider et al. 2015)? In Figure 8 and Figure S8, we measured H12 and H2/H1 values in windows at varying distances away from the center of hard sweeps where the selected site is located. Again, in this example we focused on strong sweeps because we showed in Figure 6 and Figure S6 that sweeps could not be detected easily when experiencing weak selection. We found that while H2/H1 values do increase to some extent further away from the sweep center, H12 values are the highest at the selected site where H2/H1 values are also low. This highlights the importance of first detecting a sweep with an H12 value that is significantly differentiable from neutrality before testing whether it is hard or soft. Additionally, within a peak, it is crucial to first identify the analysis window with the highest H12 value in a peak before applying H2/H1; otherwise, there is a risk of misclassifying hard sweeps as soft. Note that in our analysis, we define a peak as a consecutive tract of analysis windows lying above the median H12 value in the data, which as we showed previously, is similar to the one-per-genome FDR value for H12 under neutrality (Garud et al. 2015).
H12 and H2/H1 measured in hard sweeps at varying distances from the selected site. Partial hard sweeps were simulated with s = 10−2 and ρ = 0.5 cM/Mb. All sweeps were sampled when selection ceased and had a frequency of 0.5. Simulations were performed in a sample size of 145 individuals and with a constant Ne ≈ 2.6 × 10⁶ model fit to Raleigh data (see Materials and Methods). Each boxplot comprises 100 simulations with H12 and H2/H1 values measured in 401 SNP windows centered varying distances away from the selected site. The yellow region shows the range of H12 and H2/H1 values observed in Raleigh data at the top 25 peaks. The red line shows the one-per-genome FDR value of H12 measured under neutrality with the Ne ≈ 2.6 × 10⁶ model. The center of the sweep where the selected site is located generates the highest H12 values. Analysis windows in the shoulders of the hard sweeps further away from the sweep center generate higher H2/H1 values. However, conditioning on the highest H12 value in a peak (defined as a consecutive tract of analysis windows with H12 values greater than the one-per-genome FDR values) results in low H2/H1 values for hard sweeps. Figure S8 shows similar results for complete sweeps and partial sweeps that have decayed for some time.
The extent of the elevation in LD and haplotype homozygosity, and the number of soft sweeps in both populations is surprising and simultaneously confirms that these results are generic to multiple populations of D. melanogaster. Yet, there are some differences in the patterns observed in the Zambian and Raleigh data set. For example, the elevation in LD and haplotype homozygosity is muted in the Zambian population relative to the Raleigh population and all the selective sweeps in Zambia have lower partial frequencies and H12 values than in Raleigh. In addition, while many of the top 25 peaks’ H12 and H2/H1 values in the Zambian data are strongly supported by soft sweeps, several top peaks are consistent with hard sweeps driven by weaker selection. Note that it is difficult to differentiate whether these sweeps are truly hard or soft because H2/H1 has poor ability to differentiate the softness of a sweep with a low H12 value (Garud et al. 2015).
Much stronger signals of soft sweeps in the Raleigh data set could in principle be driven by the inbreeding and admixture experienced by the Raleigh population, but it is clear that these two forces alone cannot explain all of the elevation in haplotype homozygosity and LD given that these signatures are generic to both populations. Instead, another possibility why the signals in the Raleigh population are more pronounced could be that Raleigh has experienced stronger and more recent selection pressures, especially due to anthropogenic pressures such as those arising from the presence of pesticides or due to novel selective pressures associated with migration to novel temperate habitats. The patterns at the positive controls, Ace, Cyp6g1, and CHKov1, which are cases of recent and strong positive selection arising from the presence of pesticides and viruses are consistent with this interpretation. The frequencies of the adaptive mutations at the positive control Ace shows that the adaptive mutations have reached frequencies of ∼40% in Raleigh and only ∼16% in Zambia. The peaks at Cyp6g1 and Ace rank 14th and 35th in the H12 scan in Zambia, in contrast to 1st and 3rd in the Raleigh scan likely because the adaptive mutations have reached lower frequencies in Zambia. We do not even observe a peak at CHKov1 in Zambia, consistent with the finding in Aminetzach et al. (2005) that the adaptive allele is rare in Africa and common only in derived populations at this locus.
At all three loci (Ace, CHKov1, and Cyp6g1) multiple haplotypes at high frequencies are unique to both the Zambian and Raleigh populations, showing that independent soft sweeps are common in different locations around the world. Additionally, at all three loci, we observed that a common haplotype is shared by both Zambian and Raleigh strains, suggesting that migration also plays a role. At Ace, the shared common haplotype bears three adaptive mutations in contrast to haplotypes bearing the single adaptive mutation present at high frequencies comprised uniquely of Zambian or Raleigh strains. This suggests that this haplotype arose once in Africa and spread worldwide, confirming the results of Karasov et al. (2010). At Cyp6g1 we find for the first time that a common haplotype is shared in both Zambia and Raleigh. At CHKov1 we find that common haplotypes in Raleigh are shared with rare haplotypes in Zambia, consistent with the result of Aminetzach et al. (2005), showing that the adaptive allele originated in Africa and rose to high frequencies in derived populations.
Intriguingly, we notice that virtually all sweeps in Raleigh and Zambia reach an intermediate frequency and none go to completion. It is possible that most adaptation is local, environment-specific, or that most adaptive alleles are only adaptive when rare and driven by frequency-dependent selection and then maintained at intermediate frequencies by balancing selection. The prevalence of incomplete sweeps may have gone unnoticed until now because previous studies often relied on shallower sample sizes in which sweeps may have looked like fixations due to sampling or could not be distinguished from neutrality. Current McDonald–Kreitman estimates of the rate of adaptive mutations entering the population (Fay et al. 2002; Smith and Eyre-Walker 2002; Bierne and Eyre-Walker 2004; Andolfatto 2005; Shapiro et al. 2007; Eyre-Walker and Keightley 2009; Sella et al. 2009; Schneider et al. 2011; Kousathanas and Keightley 2013) may be underestimates if partial sweeps are common and often fail to go to fixation in the long term because McDonald–Kreitman estimates measure rate of adaptation by focusing on the rate of fixation over long time scales. This will need to be tested further with forward simulations of realistic demographic and selection scenarios.
Although we tested several neutral demographic scenarios fit to the Zambian and Raleigh data, we could not match the overall elevation in LD and haplotype homozygosity observed in the data. It is possible that there is a demographic scenario yet to be identified that can generate the observed levels of LD and haplotype homozygosity. One such extreme scenario that could generate the patterns observed is an admixture model where two parental populations undergo sharp bottlenecks resulting in virtually isogenic populations, followed by an expansion before mixing. Alternatively, there could be demes within each population-generating structure in the data that we are unable to model. Going forward, simulations of more realistic demographic scenarios potentially also incorporating selection are needed to fully understand the underlying forces in these populations.
Although background selection and gene conversion act pervasively throughout the D. melanogaster genome (Comeron et al. 2012; Comeron 2014), it is unlikely that these forces significantly influence the patterns of LD and haplotype homozygosity: while background selection can depress levels of polymorphisms, on its own it cannot elevate haplotypes to high frequencies (Enard et al. 2014; Fagny et al. 2014). Gene conversion has been shown to act on short scales of 50–2000 bp at most (Hilliker et al. 1994; Jeffreys and May 2004) and should thus only impact LD on short scales and not long-range LD. In fact, gene conversion should decrease LD on short scales, thereby making haplotype homozygosity tests that do not take into account gene conversion conservative (Andolfatto and Nordborg 1998).
The nature of selective or demographic forces that generate such high levels of LD in D. melanogaster is puzzling and remains to be elucidated. Likewise, we do not yet understand the nature of selection that generates such abundant partial strong soft sweeps and weaker hard sweeps. High levels of long-range LD has been observed in many other organisms in addition to D. melanogaster including cattle, wheat, maize, sheep, and humans (Farnir et al. 2000; Pritchard and Przeworski 2001; Rybicki et al. 2002; Palaisa et al. 2004; Maccaferri et al. 2005; Miller et al. 2011). Thus the evolutionary forces explored in this study and future analysis of LD and haplotype homozygosity in D. melanogaster should prove illuminating for other species as well.
Acknowledgments
We gratefully thank Philipp Messer, David Enard, Noah Rosenberg, Shaila Musharoff, Alan Bergland, Emily Ebel, David Lawrie, Arbel Harpak, and Gary Howard for their invaluable help. Part of this article was written in Katie Pollard’s laboratory at the University of California San Francisco. This work was supported by the Stanford Center for Evolution and Human Genomics fellowship to N.R.G. and National Institutes of Health grants R01 GM-100366, R01 GM-097415, and R01 GM-089926 to D.A.P.
Footnotes
Communicating editor: R. Nielsen
Supplemental material is available online at www.genetics.org/lookup/suppl/doi:10.1534/genetics.115.184002/-/DC1.
Literature Cited
Houle, D., and E. J. Marquez, 2015 Linkage Disequilibrium and Inversion-Typing of the Drosophila melanogaster Genome Reference Panel. G3 (Bethesda) 5: 1695–1701.
