


Abstract
Hundreds of wild-derived Drosophila melanogaster genomes have been published, but rigorous comparisons across data sets are precluded by differences in alignment methodology. The most common approach to reference-based genome assembly is a single round of alignment followed by quality filtering and variant detection. We evaluated variations and extensions of this approach and settled on an assembly strategy that utilizes two alignment programs and incorporates both substitutions and short indels to construct an updated reference for a second round of mapping prior to final variant detection. Utilizing this approach, we reassembled published D. melanogaster population genomic data sets and added unpublished genomes from several sub-Saharan populations. Most notably, we present aligned data from phase 3 of the Drosophila Population Genomics Project (DPGP3), which provides 197 genomes from a single ancestral range population of D. melanogaster (from Zambia). The large sample size, high genetic diversity, and potentially simpler demographic history of the DPGP3 sample will make this a highly valuable resource for fundamental population genetic research. The complete set of assemblies described here, termed the Drosophila Genome Nexus, presently comprises 623 consistently aligned genomes and is publicly available in multiple formats with supporting documentation and bioinformatic tools. This resource will greatly facilitate population genomic analysis in this model species by reducing the methodological differences between data sets.
RECENT advances in next-generation sequencing have led whole-genome sequencing to be extended from only a few genetic strains of select model organisms to many genomes from humans and from model and nonmodel taxa. While all fields of genetic analysis have benefited from these technological advances, population genetics has been especially affected as hundreds or even thousands of whole-genome sequences have been generated for some organisms (e.g., 1000 Genomes Project Consortium 2010; Pool et al. 2012; Long et al. 2013; Huang et al. 2014; Wallberg et al. 2014). As a result of these large population genomic databases, we have gained considerable power in detecting and understanding species history (e.g., Li and Durbin 2011), the genome-wide consequences of natural selection (e.g., Comeron 2014), structural variation (e.g., Corbett-Detig and Hartl 2012), and patterns of linkage disequilibrium and recombination (e.g., Chan et al. 2012).
While these data sets have undeniable utility, the rapid development and deployment of next-generation technologies have been accompanied by a diversity of opinions on the most appropriate ways to assemble, filter, and curate extremely large, complex data elements. As a result, each population genomic data set is generated using unique combinations of library preparation chemistry and sequencing platform, different short-read aligning programs or pipelines with distinct biases and error rates, a wide range of quality filters and thresholds, and often distinct data formats. Ultimately, this renders population genomic data sets difficult to combine and jointly analyze. For example, it is difficult to understand whether population genetic statistics (e.g., nucleotide diversity) are directly comparable given potential differences in error rate or mapping/coverage biases.
Drosophila melanogaster has played a pivotal role in essentially every field of genetic analysis from population and evolutionary genetics to the development of fly models for understanding human disease. While D. melanogaster likely originated in Sub-Saharan Africa (Lachaise et al. 1988; Pool et al. 2012), natural populations now occur in essentially all temperate and tropical localities and are typically commensal with humans. There are currently multiple independently generated population genomic data sets available that differ in the sequencing platform, assembly pipeline, and the data formats released to the public (Langley et al. 2012; Mackay et al. 2012; Pool et al. 2012; Huang et al. 2014). To address at least the last two of these issues, we present the assembly of 623 genomes from natural populations of D. melanogaster, all assembled using a common approach. This data set includes the previously published diploid Drosophila Population Genomics Project (DGRP) freeze 2.0 genomes from Raleigh, North Carolina (Huang et al. 2014), the DPGP collection of homozygous chromosomes from Malawi (Langley et al. 2012), the haploid DPGP2 (Pool et al. 2012) collections of genomes from Sub-Saharan Africa, and the founder lines from the Drosophila synthetic population resource (DSPR) (King et al. 2012). In addition, we publish 53 additional haploid embryo and inbred African genomes from Egypt, Ethiopia, Kenya, South Africa, and Uganda, along with the DPGP3 data set of 197 haploid embryo genomes from a single population in Zambia.
This deep genomic sequencing of the Zambia sample (denoted “ZI”) was motivated by preliminary data suggesting that this population has maximal genetic diversity among known D. melanogaster populations, along with minimal levels of admixture from non-sub-Saharan (“cosmopolitan”) populations (Pool et al. 2012). While the sample size of DPGP3 is comparable to that of DGRP, each data set has particular strengths. DGRP includes a substantial inbreeding effort to facilitate genotype–phenotype comparisons, whereas DPGP3 uses a haploid embryo sequencing effort method (Langley et al. 2011) to generate fully homozygous genomes for population genetic analysis. Because of its location within the sub-Saharan ancestral range of the species, the Zambia sample has not experienced the out-of-Africa bottleneck or New World admixture that is relevant to the DGRP population (Duchen et al. 2013). By providing a clear picture of diversity in the ancestral range of D. melanogaster, the DPGP3 collection will aid in understanding the histories of other worldwide populations and the species as a whole, as illustrated by studies of sub-Saharan human populations (Bhatia et al. 2014; Elhassan et al. 2014). While Zambia may not necessarily represent a population at demographic equilibrium, the relative simplicity of its history will also facilitate studies of the effects of natural selection and other processes on genomic diversity.
The Drosophila Genome Nexus (DGN) created from these alignments is intended to facilitate population genetic analyses focused on single nucleotide polymorphisms (SNPs). We do not claim that our assembly pipeline produces the best possible alignments. It does represent a modest advance over standard methodology, but its primary virtue is to increase the comparability of population genomic data sets. For example, there would be scientific value in comparing the North Carolina DGRP population against separately published genomes from the European and African source populations from which North American populations may derive (Caracristi and Schlötterer 2003; Duchen et al. 2013). Detailed population genetic inference is not a focus of the present study, but we present basic summaries of genetic diversity and structure, as well as patterns of admixture into sub-Saharan African populations from cosmopolitan populations.
Materials and Methods
Reassembly of previously published genomes
We obtained the raw sequencing reads from the National Center for Biotechnology Information short read archive (SRA; http://www.ncbi.nlm.nih.gov/sra) for Illumina data from the DGRP freeze 2.0 (Mackay et al. 2012; Huang et al. 2014), DPGP (Langley et al. 2012), DPGP2 (Pool et al. 2012), and DSPR (King et al. 2012) collections of genomes (SRA accession numbers are given in Supporting Information, Table S1). See the above citations for information concerning DNA extraction, library preparation, and sequencing, as these varied considerably among data sets. For the DSPR, we assembled all resequenced genomes associated with that project, but did not generate consensus sequences for the t0XSS and t0XSAM libraries, as these were completely heterozygous crosses generated for the sole purpose of determining genotypes in the t0 strain, which possessed an inversion polymorphism on chromosome arm 2L.
Newly sequenced genomes
We present a considerable expansion of the genomic sequences available for D. melanogaster with the addition of 246 African lines. Table S1 provides descriptions of fly stocks and their availability, genome and alignment characteristics, and raw data accession numbers. Table S2 gives information about sampling locations. This expansion consists of 193 additional lines (primarily isofemale, some inbred for five generations) collected from Siavonga, Zambia (collectively referred to as the DPGP3 data set), in addition to the 4 Zambia ZI genomes previously published (Pool et al. 2012). We also include here 53 additional genomes (referred to here as the African Genomes Extended Sampling, or the AGES data set) from 12 African populations. Isofemale lines for these populations were collected following Pool (2009). For all DPGP3 genomes, genomic library preparation from haploid embryos followed the protocol of Langley et al. (2011). Sequencing for DPGP3 was performed on an Illumina Genome Analyzer IIx (Langley lab, University of California at Davis). From the AGES data set, all but the Egyptian (EG) and Kenyan (KM) paired-end libraries were prepared from haploid embryos using the same methods as for DPGP3. All AGES genomes were sequenced at the University of Wisconsin-Madison Biotechnology Center on the Illumina HiSequation 2000 platform. For the three EG genomes, inbred lines were established through full-sib mating for eight generations, while the four KM genomes were sequenced directly from isofemale lines that had been maintained in the laboratory for 12 years and therefore passively inbred. For these seven genomes, we extracted DNA from 30 females; paired-end library preparation and size selection for 300-bp inserts was conducted using the NEBNext DNA Library Prep Reagent Set (New England BioLabs), and sequencing was conducted at the University of Wisconsin-Madison Biotechnology Center on the Illumina HiSequation 2000 platform.
Genome assembly pipeline
In reference assembly of short-read sequencing data, a major limitation is SNP and indel divergence of sequenced genomes from the reference. This issue could result in alignment biases if reads derived from low-diversity regions of the genome can be aligned more confidently, in addition to biases among genomes that vary in their overall divergence from the reference sequence (e.g., sub-Saharan vs. cosmopolitan D. melanogaster). In an attempt to ameliorate such effects, we developed and applied a pipeline that combines two aligners with different degrees of sensitivity to nonreference variation and speed and utilizes two rounds of mapping (Figure S1). In brief, we first mapped short read data to the D. melanogaster reference genome (release 5.57; http://flybase.org) using BWA v0.5.9 (Li and Durbin 2010) using default settings, followed by mapping of all unmapped reads using Stampy v1.0.20 (Lunter and Goodson 2010). This approach combines the rapid but strict BWA algorithm to first map the relatively “easy-to-align” reads with the more sensitive but computationally intensive Stampy algorithm, which more effectively and accurately aligns the relatively divergent reads (Lunter and Goodson 2010). All reads with mapping quality scores <20 were excluded. Optical duplicates were then removed using Picard v1.79 (http://picard.sourceforge.net/), and assemblies were improved around indels using the GATK v3.2 Indel Realigner (McKenna et al. 2010; Depristo et al. 2011). The Unified Genotyper (Depristo et al. 2011) was then used to call indels and SNPs for each individual genome. Among the indel calling criteria, >50% of the reads at a given position had to support the existence of that indel, with a minimum of three reads containing the variant. For SNP calling in this first round, we required a minimum phred-scaled quality value of 31 and that >75% of the reads at a given position support the SNP. For the second round of assembly, the SNPs and indels called in the first round were introduced into the D. melanogaster reference, and this modified reference was then used for a second round of mapping. Following indel realignment, the Unified Genotyper was then used to call all sites in the modified reference genome. To generate reference-numbered consensus sequences, a custom perl script was used to shift all base coordinates back to those of the original D. melanogaster reference. Deletions and all sites within 3 bp of a called indel were coded as “N” (based on the error analysis described in the Results), while insertions do not appear in reference-numbered consensus sequences.
Consensus error rate and sequence generation
To estimate the actual error rate of our assemblies and to determine the optimal trade-off between error rate and genomic coverage (the number of euchromatic bases with called alleles), we evaluated base-calling accuracy using the previously published resequenced reference genome (y1 cn1 bw1 sp1) (Pool et al. 2012), sequenced on a GAIIx to an ∼25× average depth with 76-bp paired-end reads (Table S1). Variation was simulated via dwgsim v0.1.10 (https://github.com/nh13/DWGSIM/wiki); we introduced substitutions randomly across the genome at a rate of 0.012/bp, with an indel rate of 0.002/bp and a probability of 0.6 of indel extension (the dwgsim command line options used were -1 100 -2 100 -d 200 -s 25 -C 25 -q 30 -r 0.012 -R 0.166666 -X 0.6 -H -m). The variation in the *.mutations file produced by dwgsim was then inserted into the release 5 D. melanogaster reference sequence. The resequenced reference reads were then mapped to the modified reference using the pipeline described above, as well as several variations, to investigate the performance of our pipeline vs. more standard alignment approaches and various degrees of filtering. Analysis of simulated sequence reads via dwgsim gave highly concordant results (not presented).
Heterozygosity filtering
For the DGRP data set, the EG and KM samples from the AGES data set, and the ZK genomes from the DPGP2 data set, libraries were constructed from pools of flies following varying degrees of inbreeding. For these genomes, tracts of heterozygosity can remain (and can even be substantial), presumably due to the presence of multiple recessive lethal and sterile mutations that are segregating in repulsion. These linked lethals may often occur, for example, within large inversions that are polymorphic within a line and suppress crossing over. To allow consistency between haploid and diploid genomes, entire heterozygous regions must be filtered out prior to generating homozygous consensus sequences.
For the samples mentioned above, the Unified Genotyper was run in diploid mode to enable the calling of heterozygous sites. To identify and mask residually heterozygous regions, we scanned the five euchromatic arms of each diploid genome for heterozygous calls in 100-kb windows advancing in 5-kb increments. Rather than use a hard boundary for delineating windows of residual heterozygosity, we chose to scale the threshold for a given window to the level of genetic diversity observed in that window within either sub-Saharan or cosmopolitan populations (henceforth referred to as πsub and πcos, respectively), depending on the geographic origin of each individual genome. To determine these thresholds, we estimated nucleotide diversity (π) in 100-kb windows advancing in 5-kb increments for the large Rwandan (RG) sample of 27 haploid embryo genomes and the French sample of 9 haploid embryo genomes to represent sub-Saharan and cosmopolitan diversity, respectively. Then to scan each genome for heterozygosity, whenever the proportion of heterozygous sites in a given window exceeded π/5, a masking interval was initiated, and this interval was extended in both directions on the chromosome arm until encountering a window with heterozygosity <π/20. The thresholds (π/5 and π/20, respectively) were selected heuristically based on two factors: (1) the expected rate of heterozygous sites when genuine heterozygosity is present (π)and (2) the expected rate of erroneous heterozygote calls in homozygous sequence (examined using the diploid variant calling on genomes derived from haploid embryos). Although the latter quantity showed some variability across the genome, it consistently stayed below π/5 (except for masked cases of “pseudoheterozygosity”; see below) and generally stayed below π/20 as well. In contrast, true heterozygosity will typically yield rates above π/5 for a 100-kb region and nearly always above π/20. The above procedure was conducted beginning from both ends of each chromosome arm. Tracts of heterozygosity were masked to N and are provided in Table S3.
For the DGRP data set, a subset of these genomes had elevated baseline levels of heterozygosity for unknown technical reasons. For the majority of these genomes, this constituted <10% of all sites, while 29 genomes had >10% of sites masked for this reason (Table S3). Regions with elevated numbers of putatively heterozygous sites were masked from consensus sequences regardless of whether they reflected true heterozygosity, cryptic structural variation, or technical artifacts. However, we also used a normalization approach to identify the DGRP genome regions that reflect genuine heterozygosity. We generated normalization factors using the following procedure: (1) For each euchromatic chromosome arm in each genome, we first determined the mode of heterozygous calls per site (hets/site) in the same windows above (in bins of 0.00001), only including windows with a hets/site between 0 and that window’s πcos/2 to remove the effects of true heterozygosity in determining the mode of the baseline (“genomic noise factor”). (2) We obtained each genome’s normalization factor by dividing the above genomic noise factor by the mode of all DGRP genomic noise factors, truncating this normalization factor at 1 (since we are interested only in reducing the influence of nongenuine heterozygosity calls). (3) For each window in the heterozygosity scan, we divided the hets/site by its genome’s normalization factor to provide a corrected hets/site appropriate for the identification of true heterozygosity, using the criteria described above.
While haploid embryo genomes are not expected to contain any true heterozygosity, repetitive and/or duplicated regions can cause mismapping that results in tracts of “pseudoheterozygosity.” To detect these tracts and remove them, we implemented the same threshold approach as outlined above (without normalization, since none of these genomes showed elevated background levels of putative heterozygosity). For these genomes, the Unified Genotyper was run in haploid mode, and so read proportions were analyzed in place of called heterozygous sites, and specifically the proportion of sites in which less than 75% of reads supported the consensus base. For windows in which more than the proportion π/5 of all sites fit the above criterion, a masking tract was initiated and extended in both directions until encountering a window below π/20. This procedure was conducted starting from both ends of the chromosome arms, overlapping windows were merged, and all pseudoheterozygosity tracts are reported in Table S3.
Chromosomal inversion detection
Chromosomal inversions are known to be common in natural D. melanogaster populations (e.g., Krimbas and Powell 1992; Aulard et al. 2002) and can significantly impact the distribution of genetic diversity (e.g., Kirkpatrick and Barton 2006; Hoffman and Rieseberg 2008; Corbett-Detig and Hartl 2012). For the Drosophila Genome Nexus, we compiled known inversions for the previously published genomes and also identified inversions for the newly sequenced genomes. For DGRP genomes, inversions were previously identified cytogenetically (Huang et al. 2014). For the DPGP2 data set, common inversions were previously detected using the approach of Corbett-Detig et al. (2012). For the newly sequenced DPGP3 and AGES data sets, inversions were also detected using this method, and we provide the identified inversions for all of the analyzed genomes in Table S4.
Detection of identical-by-descent genomic regions
Tracts of identical-by-descent (IBD) may reflect the sampling of related individuals and can contradict theoretical assumptions and complicate many population genetic analyses. To identify tracts of IBD, we implemented the approach of Pool et al. (2012), but with slight modifications for the diploid genomes and for the large DPGP3 population sample (described below). All possible pairwise comparisons were made for each of the five euchromatic arms of each genome, and pairwise differences per site were calculated in 500-kb windows advanced in 100-kb increments. Windows with <0.0005 pairwise differences per site were deemed putatively IBD. Some chromosomal intervals (including centromere- and telomere-proximal regions) exhibited large-scale, recurrent IBD between populations, suggesting explanations other than close relatedness, and therefore did not contribute to a genome’s IBD total unless they extended outside these recurrent IBD regions. Elsewhere, within-population IBD (presumably due to very recent common ancestry) was determined to be that which totaled genome-wide >5 Mb for a pairwise comparison of genomes.
For the DPGP2 and AGES genomes, we excluded the same recurrent IBD regions as those of Pool et al. (2012). However, for the much larger DGRP and DPGP3 samples of genomes, we visually reexamined these recurrent IBD tracts and generated new regions to be excluded for each of these data sets (provided in Table S5).
Due to heterozygosity filtering, some diploid genomes had genomic coverages far less than the typical ∼111 Mb. Therefore, the genome-wide threshold for IBD filtering was adjusted to 5% of all called positions rather than 5 Mb. In addition, only 500-kb windows with >100-kb pairwise comparisons were allowed to contribute to the 5% total, minimizing the influence of windows with large numbers of masked sites. All masked IBD tracts are given in Table S6.
Detection of cosmopolitan admixture
Because admixture from cosmopolitan gene flow into Africa can significantly impact estimates of genetic diversity and violate demographic assumptions of some analyses, it is important to identify instances of cosmopolitan ancestry in the sub-Saharan genomes. We used the HMM approach outlined in detail by Pool et al. (2012), but with updated reference panels. The sub-Saharan reference panel included 27 RG genomes, but chromosome arms with known inversions were excluded (as identified by Corbett-Detig and Hartl 2012). The cosmopolitan reference panel included 9 French genomes, again excluding inversions, since inverted arms were previously found to have unusually high divergence from standard arms in this population (Corbett-Detig and Hartl 2012; Pool et al. 2012). Pairwise distance comparisons indicated that the Egyptian genomes were genetically cosmopolitan. To augment the cosmopolitan sample, we included homozygous regions of standard arrangement Egypt chromosome arms in the cosmopolitan reference panel.
Aside from these modifications to the reference panels, we implemented the admixture HMM as described in Pool et al. (2012). Briefly, this HMM works in the following way. For a focal African genome within a particular window, the method compares this genome against a cosmopolitan reference panel and assesses whether its genetic distance to this reference panel is on the level expected for a sub-Saharan genome or if instead this resembles a comparison of one cosmopolitan genome against others (indicating admixture). As before, window size for the analysis was based on 1000 nonsingleton SNPs among the RG sample, roughly corresponding to a mean window size of 50 kb. The analysis was initially calibrated using the 27 RG genomes to represent the putative non-admixed state, and emission distributions for the non-admixed state were generated as in Pool et al. (2012). A revised sub-Saharan panel was then generated through an iterative analysis of the RG genomes. Following a single round of the method, RG genomes were masked for admixture, and then these masked genomes served as the African panel for a second round. RG genomes were then masked for admixture again, and a third round of the method was applied to the RG genomes to produce a final set of emission distributions that were used in the analysis of all other African genomes.
Genetic diversity and population structure
For all of the analyses described below, only heterozygosity- and IBD-filtered genomes were utilized. Sub-Saharan genomes were also filtered for cosmopolitan admixture as detailed above. Nucleotide diversity (π) was initially calculated in windows of 2000 nonsingleton RG SNPs, corresponding to a median window size of 100 kb for all populations with at least two genomes sampled. For more efficient analysis of the large Raleigh (DGRP) and Siavonga, Zambia (DPGP3), populations, we selected 30 genomes from each of these populations with the highest genomic coverage and with at least 30× average depth. To remove the effects of spurious estimates due to low coverage windows, we excluded windows for a given population if site coverage (the number of sites with alleles called for two or more genomes) was below half the coverage in the large RG sample for that window. To obtain whole-arm and genome-wide estimates, we conducted a weighted average of windows (weighted by the number of sites in each window with data from at least two genomes).
To examine patterns of population structure, we calculated Dxy and FST (Hudson et al. 1992) for all populations with at least two high-coverage genomes (after IBD and admixture filtering) and including the D. melanogaster reference genome for Dxy. Both analyses were conducted in windows of 2000 nonsingleton RG SNPs, and a weighted average of windows was used to obtain whole-arm and genome-wide estimates. In addition, to lessen the influence of large inversions on estimates of genetic diversity and population structure, we estimated nucleotide diversity and pairwise FST excluding inverted arms for a subset of populations with larger sample sizes (inversion presence/absence is given in Table S4).
Data and pipeline files provided
A complete set of files needed to implement this alignment pipeline is provided at https://github.com/justin-lack/Drosophila-Genome-Nexus.git, along with a step-by-step list of commands, which is also provided here as Supporting Information, File S1. From the DGN web site (http://johnpool.net/genomes.html), three types of alignment files are provided. Sequence text files provided the reference-numbered consensus sequences described above. Only these files are subject to heterozygosity filtering in the downloaded state. Scripts and instructions are provided to enable the filtering of identity-by-descent and admixture in African populations, as indicated above. Sequence text files are the recommended starting point for most users performing SNP-oriented analyses. We also provide two forms of variant call files (VCFs). Indel VCFs summarize the short insertions and deletions called for this genome relative to the reference sequence. These files are provided from both rounds of mapping (with positions in the round 2 file altered to match reference numbering). Many users may find the indel VCFs to be a useful complement to the sequence text files, which contain no explicit information about indels. We also provide site-by-site, substitution-oriented VCFs. These files are intended for advanced users. They have not been filtered around indels, for heterozygous regions, or for any other reason, instead representing a distilled raw output of the alignment pipeline. Since each genome was aligned to a distinct modified reference sequence, individual genome VCFs may differ in the “reference” column; these files are not intended for merging via common software. To reduce file size, the downloaded SNP VCFs do not contain the typical “ID,” “FORMAT,” and “FILTER” columns. A script to restore conventional VCF format is available on the DGN and GitHub web sites referenced above.
Results
The Drosophila Genome Nexus
The resulting data set, which we have named the Drosophila Genome Nexus (http://www.johnpool.net/genomes.html), consists of 623 sequenced genomes (varying slightly in number among the five euchromatic chromosomal arms) from 36 populations from Africa, Europe, and North America. The consensus sequences analyzed below and made available online include only the five euchromatic chromosome arms. These consensus sequences have been filtered for heterozygosity, with additional files provided to facilitate masking of IBD and cosmopolitan admixture as well as locus-specific analysis. SNP and indel VCFs are also available online, both for these five arms and for other arms (mitochondria, chromosomes 4 and Y, and heterochromatic components of the euchromatic arms). The repetitive nature of non-euchromatic arms may entail much higher error rates; we do not focus on their analysis here.
While the consensus sequences made available online specifically focus only on SNP variants, the provided indel VCFs will also be of considerable utility. For indels, the Unified Genotyper is limited to detecting only those encapsulated entirely within a single read. Therefore, read lengths will limit the size of detected indels. To examine the extent of this effect on indel detection, we examined indel length distribution for two DPGP3 genomes with 76-bp paired-end reads as well as for two DPGP3 genomes with much longer read lengths (146 and 150 bp) (Figure S2), each with similarly low cosmopolitan admixture and high mean depth. For indels ∼25 bp or shorter, the long and short read lengths appeared to have no effect on indel length frequencies. However, for longer indels (>25 bp) the gap in detection between the two read lengths gradually increased, illustrating the decreasing ability of the present approach to detect indels as they approach the read length. This potential bias is important to consider when examining the provided indel calls. A more comprehensive analysis of structural variation within and between these populations will be a target of future research.
While there is considerable variation among genomes in terms of average sequencing depth and coverage, the majority of this variance lies in the DGRP and AGES data sets, which range from ∼12× to >100× mean depth, while the remaining genomes are primarily haploid embryo genomes of ∼30× mean depth or higher (Table S1). In addition, coverage varies considerably among the inbred/isofemale genomes from the AGES and DGRP data sets due to heterozygosity filtering.
Genome assembly pipeline performance
To investigate pipeline performance, base-calling bias, and consensus error rate, we assembled a resequenced D. melanogaster reference strain to an artificially mutated reference genome to simulate variation. Overall, adding a second round of mapping that incorporated SNP and indel variants called in the first round of mapping resulted in an ∼1% increase in sequence coverage (just over 1 million sites added) and a modest improvement in error rate relative to performing only a single round of mapping with only BWA (Figure 1 and Figure S3). This improvement was observed irrespective of the nominal quality value threshold for base calling (which had only a modest effect on error rates), with error rates for the two round assemblies completely distinct from the distribution of error rates observed for a single round of assembly. We investigated the contribution of Stampy to this improvement and found that, while both error rate and coverage improved, the vast majority of improvement was due to adding the second round of mapping (Figure 1 and Figure S3).
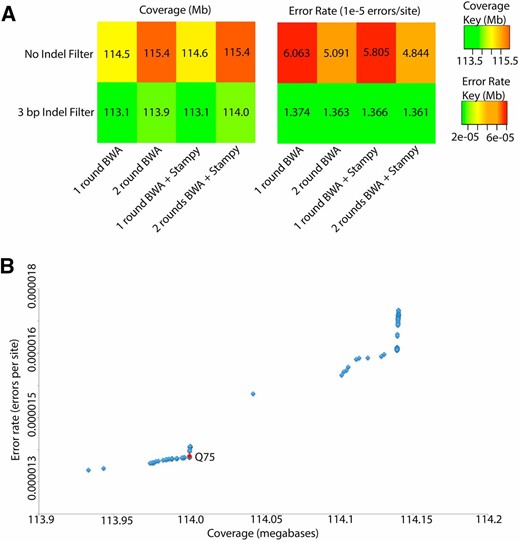
Comparison of genomic coverage and error rate for various genome assembly pipeline variations, based on resequencing of the D. melanogaster reference. (A) Heat maps illustrating variation in coverage (left) and error rate (right) at the Q75 threshold chosen to optimize the trade-off between coverage and error rate. (B) Evaluation of the trade-off between genomic coverage and error rate for the haploid caller of the Unified Genotyper; quality values ranged from 10 to 100. Resequenced genomes from the reference strain (y1 cn1 bw1 sp1) were modified to simulate realistic levels of variation. We chose a cutoff of Q75 (red) to maximize coverage and minimize error.
We also investigated the impact of filtering around indels, as past analyses have found that positions directly adjacent to indels are difficult for aligners to correctly align and a major contributor to error (Meader et al. 2010; Alkan et al. 2011). We found similar results, with approximately a fivefold reduction in error rate by masking 3 bp on either side of consensus indels. Assessing the possible benefit of masking 5 bases rather than 3, we observed almost no improvement in error rate to justify the nearly 1% reduction in coverage and therefore used the 3-bp mask. Our use of the GATK Indel Realigner (McKenna et al. 2010; Depristo et al. 2011), in conjunction with incorporating indels into the reference used in the second round of mapping, may have improved our ability to align around these regions. Finally, to determine the optimal alignment quality value threshold for consensus sequence generation and to estimate the expected error rate of our assemblies, we examined the trade-off between coverage and error rate at a range of quality values for both the haploid and the diploid callers of the Unified Genotyper (Depristo et al. 2011), and we selected a minimum of Q75 and Q32 for calling a position in haploid or diploid genomes, respectively (Figure 1 and Figure S4, respectively). These thresholds corresponded to an error rate of ∼1.36 × 10⁻⁵ errors per site.
To further examine our two-round pipeline performance, we compared sites called only by the two-round pipeline vs. those called using just a single round of BWA to map and estimated both error rate and diversity for both classes of sites. In terms of error rate, sites called in both pipelines possessed an error rate of 9.3 × 10⁻⁶, just below the genome-wide rate, while sites added only in our two-round pipeline had an error rate of 2.9 × 10⁻⁵, roughly twofold higher than our genome-wide average. This increase in error rate is not surprising given that these sites added by our two-round pipeline likely constitute highly diverse, hard-to-align regions relative to those confidently called by both pipelines.
To further examine the sites added by our two-round pipeline, we identified bases called in both pipelines vs. those called only in our two-round pipeline for a single RG genome (RG33) and then calculated nucleotide diversity at each class of sites for the RG sample of 27 genomes. In addition, for two RG genomes sequenced at similar depths (RG33, RG5) we determined both the number of sites added by our two-round pipeline and the number of indels (indel “rate”) in 100-kb nonoverlapping windows. For sites called only by our two-round pipeline, nucleotide diversity was over threefold higher than that for sites called in both pipelines (Table 1), and we observed a clear positive relationship between the number of sites added with the new pipeline and the number of indels in that region of the genome (Figure 2). These lines of evidence support the idea that the sites added by our pipeline are found in high diversity, difficult-to-align genomic regions.
Chromosome-arm nucleotide diversity (π) for the RG population based on sites called in both rounds of our pipeline and on sites called only by adding the second round of mapping
| RG nucleotide diversity | ||
|---|---|---|
| Chromosome | Both rounds | Second round only |
| X | 0.0083 | 0.0277 |
| 2L | 0.0086 | 0.0259 |
| 2R | 0.0077 | 0.0252 |
| 3L | 0.0079 | 0.0248 |
| 3R | 0.0065 | 0.0260 |
| RG nucleotide diversity | ||
|---|---|---|
| Chromosome | Both rounds | Second round only |
| X | 0.0083 | 0.0277 |
| 2L | 0.0086 | 0.0259 |
| 2R | 0.0077 | 0.0252 |
| 3L | 0.0079 | 0.0248 |
| 3R | 0.0065 | 0.0260 |
| RG nucleotide diversity | ||
|---|---|---|
| Chromosome | Both rounds | Second round only |
| X | 0.0083 | 0.0277 |
| 2L | 0.0086 | 0.0259 |
| 2R | 0.0077 | 0.0252 |
| 3L | 0.0079 | 0.0248 |
| 3R | 0.0065 | 0.0260 |
| RG nucleotide diversity | ||
|---|---|---|
| Chromosome | Both rounds | Second round only |
| X | 0.0083 | 0.0277 |
| 2L | 0.0086 | 0.0259 |
| 2R | 0.0077 | 0.0252 |
| 3L | 0.0079 | 0.0248 |
| 3R | 0.0065 | 0.0260 |
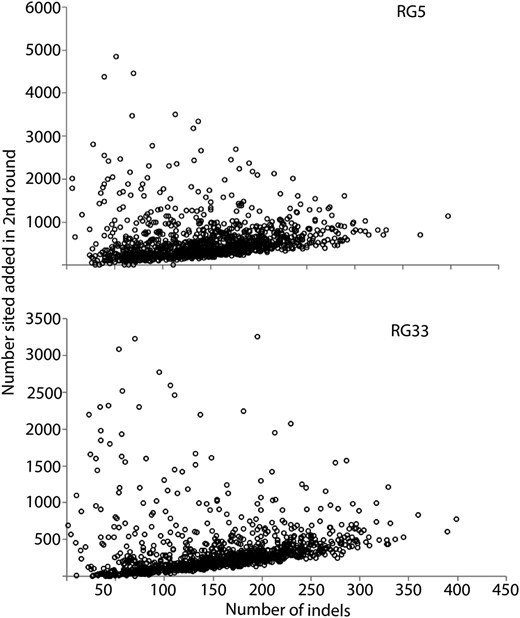
Relationship between the number of indels and the number of sites called by our two-round pipeline but not called in a single-round pipeline for two RG genomes (RG5 and RG33). Site counts (y-axis) and indel counts (x-axis) were determined in 100-kb windows across each genome.
To determine whether any particular functional class of sites contributed disproportionately to the sites added by our two-round pipeline, we used the D. melanogaster reference genome annotations (v5.57) to assign each individual site called only by our two-round pipeline for RG33 and RG5 to one of nine site classes: nonsynonymous; two-, three-, or fourfold synonymous; 5′ UTR; 3′ UTR; intronic; short intron (Halligan and Keightley 2006); or intergenic. While all classes of sites contributed to the total sites added by our two-round pipeline, only intergenic and intronic sites were positively enriched for both RG genomes (Figure 3), suggesting that our pipeline disproportionately added these two functional classes of sites to the assemblies. However, the representation of each functional category in the “added sites” class is fairly close to null expectations, and we even added 41,368 and 36,990 nonsynonymous sites, which we would expect to be the least diverse and therefore easiest to align confidently, to RG33 and RG5, respectively, by applying the full pipeline. We also characterized the tract length and genomic distribution of sites added in the second round of our assembly for both RG5 and RG33. In terms of tract length, the vast majority of bases added occurred in short tracts of 1–10 bases (Figure S5). To examine genomic location of these sites, we calculated the number of sites in 100-kb windows across the five euchromatic arms of the genome (Figure S6). While sites were added somewhat uniformly across the genome, repetitive telomeric regions were especially enriched.
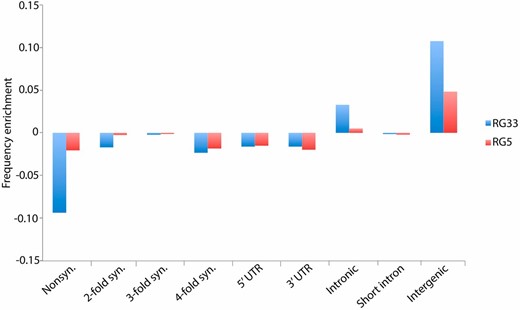
Enrichment of each of nine annotation classes in the sites added by our two-round pipeline, but not called by a single-round pipeline, relative to genome-wide frequencies. We examined two RG genomes (RG5 and RG33) with an ∼30× mean depth and comparable coverage.
Impact of sequencing depth on genetic distance
In a previous assembly of the DPGP2 data set, Pool et al. (2012) found a positive, nonlinear relationship between mean sequencing depth (the average number of reads per base pair) and genetic distance to both the reference and the Siavonga, Zambia (ZI) population. This relationship is especially pronounced below the 25× mean depth. Here, we ameliorated that issue by using a consensus caller that is less vulnerable to reference sequence bias and by adding more stringent quality filtering (http://www.dpgp.org/dpgp2/DPGP2.html). To examine the impact of this base-calling bias in our pipeline, we quantified the recall rate of reference and nonreference alleles in the resequenced reference. The recall rate for reference and nonreference alleles was nearly identical (0.958 vs. 0.959), suggesting that reference bias has a minimal effect. To further examine this relationship for our two-round pipeline vs. the single round of mapping with only BWA (but including the indel filter), we calculated mean genome-wide distance to the ZI population for each of the genomes in the AGES data set (excluding genomes with whole arms masked due to heterozygosity). For the single round of mapping, a positive relationship between mean depth and distance to ZI was apparent below the 20× mean depth, but for our two-round pipeline distances remained flat even approaching 10× depth (Figure 4A). When limiting this analysis to sites called in all analyzed genomes, the bias observed below 20× mean depth for single-round genomes disappeared, and distance estimates were essentially identical to those of the two-round pipeline (although greatly reduced in both cases, reflecting the exclusion of more diverse genomic regions). These results suggest that the depth-related bias observed for the single-round alignments (Figure 4A) was not due to biased consensus calling (since that would still affect the filtered analysis), but instead stems from differences in genomic coverage between low- and high-depth genomes. And indeed, we observe that genomic coverage is more dependent on depth in the single-round alignments than for the full pipeline (Figure 4B).
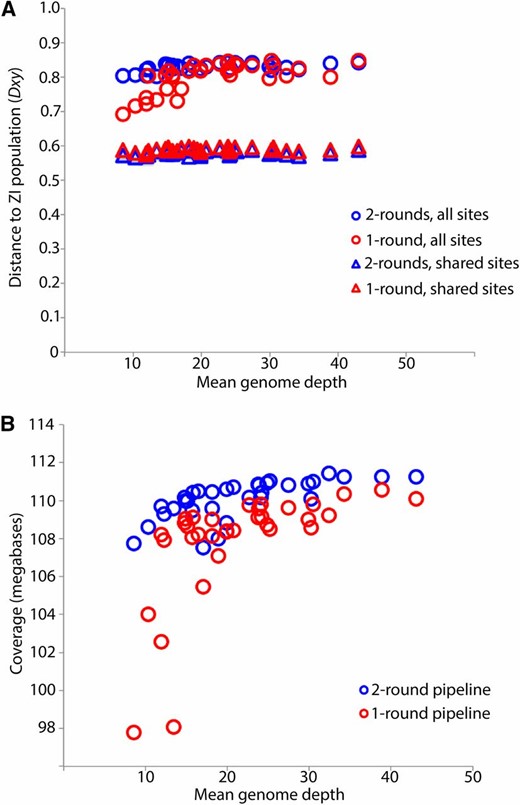
Mean sequencing depth vs. genetic distance (A) from the Zambia population and depth vs. coverage (B) for the AGES dataset genomes with high coverage on all chromosome arms (listed in Table S1). Circles indicate comparisons utilizing all windows with called sites, while triangles indicate comparisons including only sites called for all of the AGES and ZI genomes. Comparisons illustrate the effect of depth on genetic distance (A) and coverage (B) for genomes assembled using a single-round pipeline (red) vs. our two-round pipeline (blue). The two-round pipeline appears to alleviate the potential downward bias present in the single-round pipeline for depths below ∼20×, and the greater impact of depth on coverage for the single-round pipeline (B) suggests that the sites added by the two-round pipeline are driving the differences in distance to ZI.
Heterozygosity
Heterozygosity can persist in fly stocks even after many generations of full-sibling mating, probably due to the presence of recessive lethal or infertile mutations, which are commonly found on wild-derived Drosophila chromosomes (Greenberg and Crow 1960). Especially when combined with inversion polymorphism (e.g., one recessive lethal is fixed on the inversion-bearing chromsomes, and a different recessive lethal is fixed on the standard arms), recombination may be unable to generate reproductively viable homozygous progeny, and residual heterozygosity may extend over much of a chromosome arm.
We report heterozygosity tracts in Table S3, including those for the Egypt EG, Kenya KM, and Zimbabwe ZK samples. The largest non-isogeneous sample in our analysis is the 205 DGRP genomes originating from Raleigh, North Carolina. In spite of 20 generations of full-sib mating for the DGRP lines, considerable residual heterozygosity was maintained within the inbred lines. Overall, 12.6% of the total genomic sequence was masked due to apparent heterozygosity, and for each autosomal arm there were multiple fly lines for which the entire chromosome arm remained heterozygous. Considerably less masking was needed on the X chromosome than on the autosomes, which is expected given the increased efficacy of selection against recessive lethals and steriles in hemizygous males.
To examine the role of inversions in maintaining heterozygosity in inbred lines, we obtained inversion genotypes for each euchromatic arm of the DGRP lines from Huang et al. (2014). As is evident from the distribution of heterozygosity proportions for inverted vs. standard autosomal arms (Figure 5 and Table S7), >80% of the chromosome arms with inversion polymorphism retain >95% heterozygosity, compared to chromosome arms lacking inversion polymorphism for which >80% retained <10% heterozygosity. These results support the role of recessive deleterious mutations residing within large inversions driving chromosome arm-wide residual heterozygosity, but fail to explain the remaining residual heterozygosity evident in the standard arm distribution shown in Figure 5 (6.5% of non-inverted chromosome arms still retained >25% heterozygosity after 20 generations of inbreeding). While it is possible that inversion differences between sequenced and karyotyped sublines might exist in some cases, another explanation is that multiple recessive lethals in repulsion on a single chromosome arm might reduce the rate at which viable recombinants arise during inbreeding (Falconer 1989).
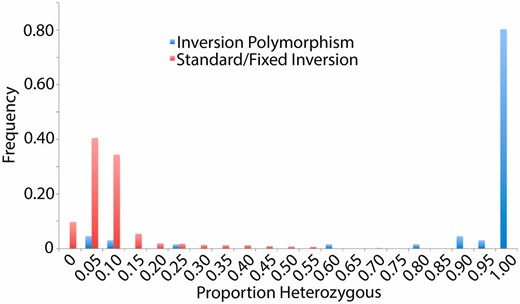
A histogram of the proportions of each autosomal chromosome arm called heterozygous from the 205 DGRP genomes. Based on the cytological analysis of Huang et al. (2014), red arms were reported to be free of inversion polymorphism, while blue arms contained polymorphic inversions. The greatly increased heterozygosity of the latter category illustrates the effects of inversion polymorphism on inbreeding efficacy.
In addition to true heterozygosity, artifactual “heterozygosity” (pseudoheterozygosity) can result from mismapping or other technical issues with genome assembly. For the haploid embryo genomes presented here, these positions constituted a very small proportion of total sites in a given genome (mean = 0.00798; SD = 0.00501; minimum = 0.00025; maximum = 0.0310).
Identity by descent
IBD regions passing all filters were flagged and are provided as an optional filter in the Drosophila Genome Nexus release (all IBD tracts are given in Table S6). For the DPGP2 data set, the IBD tracts that we identified were essentially identical to those of Pool et al. (2012) and therefore are not discussed. For the AGES data set, we detected IBD for a single pair of samples from the SF South African population, but this segment included one long tract encompassing all of chromosome 3R and half of chromosome 3L. For the DPGP3 data set, we detected IBD for 20 sample pairs, constituting only 3.2% of all called bases and 0.1% of all pairwise comparisons for those 197 genomes. For the 205 DGRP genomes, IBD appeared to be more widespread, with 9.8% of all called bases flagged for masking. For a case of two IBD genomes, these base counts refer to only the masked individual, and a total of 54 IBD sample pairs were detected.
Cosmopolitan admixture in African genomes
It has previously been noted that the introgression of cosmopolitan alleles into some African populations could have a significant influence on genetic diversity within Africa (Capy et al. 2000; Kauer et al. 2003), and cosmopolitan admixture proportions were previously estimated for the DPGP2 data set by Pool et al. (2012). We repeated this analysis for all sub-Saharan genomes published here, but with improved reference panels (including more genomes, but excluding inverted arms; see Materials and Methods). All identified cosmopolitan admixture tracts are given in Table S8 and are provided as an optional sequence filter in the Drosophila Genome Nexus release.
As in the DPGP2 analysis (Pool et al. 2012), admixture varied considerably among populations, from <1% in the Ethiopian EM population to >80% in the Zambian ZL population (Figure S7). Within-population variation was also striking, as is evident from individual genome plots of admixture (Figure 6). One important exception to the high level of interindividual variation in cosmopolitan admixture proportions was the large DPGP3 sample (ZI) from Siavonga, Zambia. We targeted this population sample for large-scale genome sequencing for multiple reasons, including its hypothesized position within the ancestral range of D. melanogaster (showing maximal genetic diversity), as well as its relatively low level of cosmopolitan admixture among four genomes surveyed in the DPGP2 analysis (Pool et al. 2012). Our analysis of the larger DPGP3 data set illustrates that the ZI population does in fact have a very low level of cosmopolitan admixture, with the population average at 1.1% of the genome, the highest individual genome at 26%, and the second highest at 9% (Figure 6). Looking across the genome, DPGP3 is similar to other sub-Saharan genomes in having the lowest admixture levels on the X chromosome (Figure S8), but has a pronounced increase in the middle of arm 3R (∼7.6–15.0 Mb), where up to 13 putatively admixed genomes are found in the maximal window (6.6% of the sample), compared with a genome-wide median of just 2 of 197 individuals.
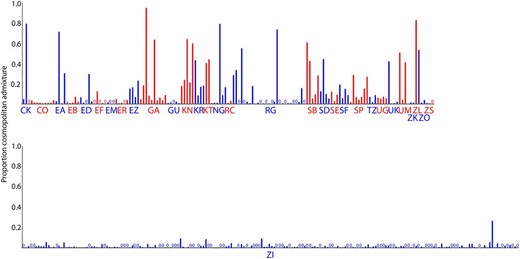
Heterogeneity in estimated cosmopolitan admixture proportions among individuals for each Sub-Saharan African population.
Genetic diversity and structure
Although the present study is not primarily focused on population genetics analysis, we present a few simple summaries of the data to guide potential users of these assemblies. First, we estimated nucleotide diversity for all populations with multiple high coverage genomes for all chromosome arms, both including and excluding inverted arms. For the DPGP2 data set, nucleotide diversity was largely consistent with the previous estimates of Pool et al. (2012), although estimates for the newly assembled sequences were generally slightly higher (Table S9), perhaps due to the improved coverage of more diverse regions.
Nucleotide diversity comparisons among populations revealed similar patterns of past analyses (Table S9). The French, Egyptian, and U. S. (DGRP) populations had much lower diversity levels than any sub-Saharan populations (Table S9), particularly on the X. This strong reduction in diversity has been previously documented (Begun and Aquadro 1993; Baudry et al. 2004) and presumably results from the bottleneck that occurred during expansion out of sub-Saharan Africa. With additional sub-Saharan African genomes, as well as the expansion of the Siavonga, Zambia, population to nearly 200 genomes, south-central Africa remains the most diverse portion of the D. melanogaster distribution. While Siavonga, Zambia, still has the highest nucleotide diversity at 0.854% (Table S9), samples from Zimbabwe and inland South Africa reach 0.814–0.850%. The ancestral range of the species may have included much of southern Africa, unless a more recent expansion occurred with very little loss of diversity. Both eastern and western African populations were still reduced in diversity relative to southern Africa (generally 0.73–0.80%). Pool et al. (2012) reported a further, mild diversity reduction in Ethiopian highland populations as previously described (Pool et al. 2012), but a lowland sample from far western Ethiopia (EA) showed little diversity reduction.
To examine the effects of inversions on diversity at the genome-scale, we estimated nucleotide diversity with inverted arms removed (Table 2). Previous analyses revealed that the effects of inversions on nucleotide diversity were not limited to regions surrounding breakpoints, but could affect entire chromosome arms (Corbett-Detig and Hartl 2012, Pool et al. 2012). Among the studied sub-Saharan populations, inversions appeared to have effects of both elevating and reducing arm-wide diversity (Table 2). The North American DGRP sample showed less diversity elevation from inversions compared with the European FR sample.
Chromosomal arm nucleotide diversity (π) for populations with inversion polymorphism
| X | 2L | 2R | 3L | 3R | ||||||
|---|---|---|---|---|---|---|---|---|---|---|
| Population | Standard | Total | Standard | Total | Standard | Total | Standard | Total | Standard | Total |
| CO | 0.0075 | 0.0075 | 0.0082 | 0.0083 | 0.0073 | No inversion | 0.0076 | No inversion | Non | 0.0058 |
| EA | 0.0071 | 0.0071 | 0.0087 | No inversion | 0.0074 | No inversion | 0.0075 | No inversion | 0.0060 | No inversion |
| EB | 0.0064 | No inversion | 0.0074 | No inversion | 0.0066 | No inversion | 0.0067 | No inversion | 0.0054 | 0.0060 |
| EG | 0.0034 | 0.0034 | Non | 0.0066 | 0.0053 | No inversion | Non | Non | Non | 0.0062 |
| FR | 0.0036 | 0.0036 | 0.0055 | 0.0061 | 0.0051 | No inversion | 0.0054 | 0.0063 | 0.0045 | 0.0058 |
| GA | 0.0077 | 0.0076 | 0.0087 | 0.0082 | 0.0077 | No inversion | 0.0080 | No inversion | 0.0066 | 0.0068 |
| GU | 0.0076 | 0.0076 | 0.0083 | 0.0084 | 0.0075 | No inversion | 0.0077 | No inversion | Non | 0.0066 |
| KN | 0.0087 | 0.0086 | 0.0061 | 0.0078 | 0.0077 | No inversion | 0.0082 | No inversion | 0.0070 | 0.0073 |
| KR | 0.0082 | 0.0085 | Non | 0.0068 | 0.0080 | 0.0081 | 0.0085 | No inversion | 0.0067 | No inversion |
| NG | 0.0076 | 0.0076 | 0.0109 | 0.0077 | 0.0075 | 0.0074 | 0.0085 | 0.0073 | 0.0054 | 0.0065 |
| RAL | 0.0041 | 0.0041 | 0.0068 | 0.0070 | 0.0062 | 0.0064 | 0.0064 | 0.0065 | 0.0052 | 0.0052 |
| RG | 0.0080 | No inversion | 0.0085 | 0.0094 | 0.0076 | 0.0081 | 0.0078 | No inversion | 0.0063 | 0.0065 |
| SB | 0.0088 | No inversion | 0.0106 | 0.0094 | 0.0082 | No inversion | 0.0083 | 0.0089 | 0.0072 | No inversion |
| SD | 0.0086 | No inversion | 0.0096 | 0.0097 | 0.0078 | 0.0078 | 0.0080 | No inversion | 0.0065 | No inversion |
| SE | 0.0083 | 0.0086 | Non | 0.0075 | 0.0079 | 0.0076 | 0.0081 | No inversion | 0.0072 | No inversion |
| SF | 0.0086 | No inversion | 0.0103 | 0.0094 | 0.0090 | 0.0085 | 0.0081 | No inversion | 0.0048 | 0.0065 |
| SP | 0.0090 | No inversion | 0.0099 | 0.0100 | 0.0083 | 0.0082 | 0.0083 | No inversion | 0.0065 | No inv. |
| TZ | Non | 0.0058 | Non | 0.0062 | 0.0077 | No inversion | 0.0075 | No inversion | 0.0056 | 0.0066 |
| UK | 0.0081 | 0.0081 | 0.0085 | 0.0086 | 0.0077 | 0.0078 | 0.0077 | No inversion | 0.0060 | 0.0065 |
| UM | 0.0080 | 0.0081 | Non | 0.0084 | 0.0078 | No inversion | 0.0068 | No inversion | 0.0075 | 0.0066 |
| ZI | 0.0089 | 0.0089 | 0.0099 | 0.0097 | 0.0083 | 0.0082 | 0.0084 | 0.0087 | 0.0076 | 0.0076 |
| ZS | 0.0089 | 0.0082 | 0.0099 | 0.0098 | 0.0083 | 0.0080 | 0.0082 | No inversion | 0.0074 | 0.0074 |
Nucleotide diversity estimates include both the total data set for a given population (“Total”) and excluding arms carrying inversions (“Standard”). “Non” denotes populations with fewer than two standard chromosome arms; “No inversion” denotes populations without inversion polymorphism. Values in boldface indicate a difference ≥5%.
| X | 2L | 2R | 3L | 3R | ||||||
|---|---|---|---|---|---|---|---|---|---|---|
| Population | Standard | Total | Standard | Total | Standard | Total | Standard | Total | Standard | Total |
| CO | 0.0075 | 0.0075 | 0.0082 | 0.0083 | 0.0073 | No inversion | 0.0076 | No inversion | Non | 0.0058 |
| EA | 0.0071 | 0.0071 | 0.0087 | No inversion | 0.0074 | No inversion | 0.0075 | No inversion | 0.0060 | No inversion |
| EB | 0.0064 | No inversion | 0.0074 | No inversion | 0.0066 | No inversion | 0.0067 | No inversion | 0.0054 | 0.0060 |
| EG | 0.0034 | 0.0034 | Non | 0.0066 | 0.0053 | No inversion | Non | Non | Non | 0.0062 |
| FR | 0.0036 | 0.0036 | 0.0055 | 0.0061 | 0.0051 | No inversion | 0.0054 | 0.0063 | 0.0045 | 0.0058 |
| GA | 0.0077 | 0.0076 | 0.0087 | 0.0082 | 0.0077 | No inversion | 0.0080 | No inversion | 0.0066 | 0.0068 |
| GU | 0.0076 | 0.0076 | 0.0083 | 0.0084 | 0.0075 | No inversion | 0.0077 | No inversion | Non | 0.0066 |
| KN | 0.0087 | 0.0086 | 0.0061 | 0.0078 | 0.0077 | No inversion | 0.0082 | No inversion | 0.0070 | 0.0073 |
| KR | 0.0082 | 0.0085 | Non | 0.0068 | 0.0080 | 0.0081 | 0.0085 | No inversion | 0.0067 | No inversion |
| NG | 0.0076 | 0.0076 | 0.0109 | 0.0077 | 0.0075 | 0.0074 | 0.0085 | 0.0073 | 0.0054 | 0.0065 |
| RAL | 0.0041 | 0.0041 | 0.0068 | 0.0070 | 0.0062 | 0.0064 | 0.0064 | 0.0065 | 0.0052 | 0.0052 |
| RG | 0.0080 | No inversion | 0.0085 | 0.0094 | 0.0076 | 0.0081 | 0.0078 | No inversion | 0.0063 | 0.0065 |
| SB | 0.0088 | No inversion | 0.0106 | 0.0094 | 0.0082 | No inversion | 0.0083 | 0.0089 | 0.0072 | No inversion |
| SD | 0.0086 | No inversion | 0.0096 | 0.0097 | 0.0078 | 0.0078 | 0.0080 | No inversion | 0.0065 | No inversion |
| SE | 0.0083 | 0.0086 | Non | 0.0075 | 0.0079 | 0.0076 | 0.0081 | No inversion | 0.0072 | No inversion |
| SF | 0.0086 | No inversion | 0.0103 | 0.0094 | 0.0090 | 0.0085 | 0.0081 | No inversion | 0.0048 | 0.0065 |
| SP | 0.0090 | No inversion | 0.0099 | 0.0100 | 0.0083 | 0.0082 | 0.0083 | No inversion | 0.0065 | No inv. |
| TZ | Non | 0.0058 | Non | 0.0062 | 0.0077 | No inversion | 0.0075 | No inversion | 0.0056 | 0.0066 |
| UK | 0.0081 | 0.0081 | 0.0085 | 0.0086 | 0.0077 | 0.0078 | 0.0077 | No inversion | 0.0060 | 0.0065 |
| UM | 0.0080 | 0.0081 | Non | 0.0084 | 0.0078 | No inversion | 0.0068 | No inversion | 0.0075 | 0.0066 |
| ZI | 0.0089 | 0.0089 | 0.0099 | 0.0097 | 0.0083 | 0.0082 | 0.0084 | 0.0087 | 0.0076 | 0.0076 |
| ZS | 0.0089 | 0.0082 | 0.0099 | 0.0098 | 0.0083 | 0.0080 | 0.0082 | No inversion | 0.0074 | 0.0074 |
Nucleotide diversity estimates include both the total data set for a given population (“Total”) and excluding arms carrying inversions (“Standard”). “Non” denotes populations with fewer than two standard chromosome arms; “No inversion” denotes populations without inversion polymorphism. Values in boldface indicate a difference ≥5%.
Estimation of FST and Dxy revealed patterns similar to those of Pool et al. (2012) for the DPGP2 populations (Table S9). Within the population groupings identified in that study, population differentiation was particularly low among southern African populations (mean FST = 0.0092) and somewhat elevated among Ethiopian samples (mean FST = 0.0331), which, as previously observed, showed moderate differentiation from other sub-Saharan samples (Table S9). Examination of FST restricted to standard chromosome arms (Table S10) indicated mainly small effects of inversions on genetic differentiation: in some cases, the addition of inversions increased genetic differentiation (e.g., Nigeria NG vs. other sub-Saharan samples), while in other cases inversions decreased genetic differentiation (e.g., for comparisons involving the French or U.S. samples). Concordant with previous observations (e.g., Caracristi and Schlotterer 2003; Haddrill et al. 2005) and the hypothesized admixed origin of New World populations from European and African sources, standard arms from the North American DGRP sample had consistently higher diversity than the European FR sample (Table 2), as well as closer relationships to sub-Saharan populations (Table 3).
Pairwise population FST for select populations averaged across chromosome arms
| FR | GA | NG | RAL | RG | SP | ZI | |
|---|---|---|---|---|---|---|---|
| FR | 0.0000 | 0.1898 | 0.2263 | 0.0376 | 0.2173 | 0.2213 | 0.2152 |
| GA | 0.2270 | 0.0000 | 0.0263 | 0.1626 | 0.0515 | 0.0955 | 0.0874 |
| NG | 0.2630 | 0.0133 | 0.0000 | 0.1954 | 0.0719 | 0.1128 | 0.1067 |
| RAL | 0.0444 | 0.1672 | 0.2000 | 0.0000 | 0.1879 | 0.1967 | 0.1911 |
| RG | 0.2545 | 0.0515 | 0.0631 | 0.1965 | 0.0000 | 0.0694 | 0.0595 |
| SP | 0.2565 | 0.0962 | 0.1034 | 0.2079 | 0.0768 | 0.0000 | 0.0130 |
| ZI | 0.2508 | 0.0939 | 0.1015 | 0.2025 | 0.0662 | 0.0127 | 0.0000 |
Comparisons utilizing the total data set for each population are above the diagonal, and comparisons using only arms without inversions are shown below the diagonal.
| FR | GA | NG | RAL | RG | SP | ZI | |
|---|---|---|---|---|---|---|---|
| FR | 0.0000 | 0.1898 | 0.2263 | 0.0376 | 0.2173 | 0.2213 | 0.2152 |
| GA | 0.2270 | 0.0000 | 0.0263 | 0.1626 | 0.0515 | 0.0955 | 0.0874 |
| NG | 0.2630 | 0.0133 | 0.0000 | 0.1954 | 0.0719 | 0.1128 | 0.1067 |
| RAL | 0.0444 | 0.1672 | 0.2000 | 0.0000 | 0.1879 | 0.1967 | 0.1911 |
| RG | 0.2545 | 0.0515 | 0.0631 | 0.1965 | 0.0000 | 0.0694 | 0.0595 |
| SP | 0.2565 | 0.0962 | 0.1034 | 0.2079 | 0.0768 | 0.0000 | 0.0130 |
| ZI | 0.2508 | 0.0939 | 0.1015 | 0.2025 | 0.0662 | 0.0127 | 0.0000 |
Comparisons utilizing the total data set for each population are above the diagonal, and comparisons using only arms without inversions are shown below the diagonal.
Discussion
We have presented a set of 623 consistently aligned D. melanogaster genomes. Although our pipeline primarily makes use of published methods, the resulting alignments are expected to yield a better combination of accuracy and genomic coverage than standard approaches. However, the primary motivation for the Drosophila Genome Nexus is to increase the comparability of population genomic data sets, as well as to make available >250 additional genomes, including the large Siavonga, Zambia, sample.
Our effort accounts for one category of potential biases between data sets (differences in alignment methodology and data filtering), but other potential concerns should still be recognized. Although not addressed here, differences in data generation, including (but not limited to) methods of obtaining genomic DNA and sequencing platform/chemistry, may influence the resulting genomic data (Quail et al. 2012; Ratan et al. 2013; Solonenko et al. 2013). Our pipeline reduces the population genetic consequences of differences in sequencing depth, but depth still has an important influence on genomic coverage. Mapping success may vary according to a genome’s genetic similarity to the reference sequence, which for D. melanogaster is expected to have a primarily cosmopolitan origin. This genetic similarity to the reference sequence will vary geographically (e.g., sub-Saharan genomes being more genetically distant from the reference) and across the genome (especially for admixed populations). Demography may also bias downstream population genetic analyses: for example, recent admixture and identity-by-descent are contrary to the predictions of models that assume random sampling of individuals from large randomly mating populations (thus we provide filters to reduce the effects of these specific issues).
It should be emphasized that the present DGN is primarily aimed at SNP-oriented analysis of the five major euchromatic chromosome arms. Aside from inversion calling and the detection of short indels, we do not address the important topic of structural variation. Furthermore, the challenge of reliably aligning heterochromatin and other repetitive regions (on a population scale) awaits further technological and methodological progress.
Thorough population genetic analysis of the DPGP3 Zambia (ZI) population sample will be a topic of future analyses. However, the preliminary statistics reported here support the notion that these genomes will be widely utilized in the field of population genetics. This population continues to present the maximal genetic diversity of any D. melanogaster population studied to date, offering hope that it may be the least affected by losses of genetic diversity via expansion-related population bottlenecks. Unlike many sub-Saharan populations, it also contains very little cosmopolitan admixture. The availability of nearly 200 genomes from this single sub-Saharan population sample, which may have a relatively simpler demographic history than many D. melanogaster populations, will be an asset for studies seeking to understand the genetic, selective, and demographic mechanisms that shape genomic polymorphism and divergence in large populations.
Acknowledgments
We thank Stephen Richards for assistance with the DGRP data; J. J. Emerson for packaging the admixture HMM method; Isaac Knoflicek for help with data management and the DGN web site; and the University of Wisconsin Center for High Throughput Computing for computational resources and assistance regarding our alignments. Funding was provided by National Institutes of Health (NIH) grant HG02942 (to C.H.L.), NIH grant R01 GM111797 (to J.E.P.), and support to J.B.L. from a Ruth L. Kirschstein National Research Service Award (F32 GM106594) and from the University of Wisconsin-Madison Genome Sciences Training Program.
Footnotes
Available freely online through the author-supported open access option.
Supporting information is available online at http://www.genetics.org/lookup/suppl/doi:10.1534/genetics.115.174664/-/DC1.
Reference numbers for data available in public repositories are given in Supporting Information, Table S1.
Communicating editor: J. D. Wall
Literature Cited
1000 Genomes Project Consortium et al., 2010 A map of human genome variation from population-scale sequencing. Nature
