


Abstract
Natural variation in gene expression is pervasive within and between species, and it likely explains a significant fraction of phenotypic variation between individuals. Phenotypic variation in acute systemic responses can also be leveraged to reveal physiological differences in how individuals perceive and respond to environmental perturbations. We previously found extensive variation in the transcriptomic response to acute ethanol exposure in two wild isolates and a common laboratory strain of Saccharomyces cerevisiae. Many expression differences persisted across several modules of coregulated genes, implicating trans-acting systemic differences in ethanol sensing and/or response. Here, we conducted expression QTL mapping of the ethanol response in two strain crosses to identify the genetic basis for these differences. To understand systemic differences, we focused on “hotspot” loci that affect many transcripts in trans. Candidate causal regulators contained within hotspots implicate upstream regulators as well as downstream effectors of the ethanol response. Overlap in hotspot targets revealed additive genetic effects of trans-acting loci as well as “epi-hotspots,” in which epistatic interactions between two loci affected the same suites of downstream targets. One epi-hotspot implicated interactions between Mkt1p and proteins linked to translational regulation, prompting us to show that Mkt1p localizes to P bodies upon ethanol stress in a strain-specific manner. Our results provide a glimpse into the genetic architecture underlying natural variation in a stress response and present new details on how yeast respond to ethanol stress.
NATURAL variation in gene expression is hypothesized to be a major source of phenotypic variation between individuals (King and Wilson 1975; Oleksiak et al. 2002). Gene expression variation underlies differences in susceptibility to infectious disease (Li et al. 2010; Barreiro et al. 2012), drug sensitivity (Fay et al. 2004; Kvitek et al. 2008; Maranville et al. 2011; Hodgins-Davis et al. 2012; Chang et al. 2013), inflammation (Gargalovic et al. 2006; Orozco et al. 2012), cardiovascular disease (Romanoski et al. 2010), metabolism (Fraser et al. 2010; Rossouw et al. 2012; Skelly et al. 2013), morphology (Yvert et al. 2003; Chin et al. 2012; Skelly et al. 2013), and even behavior (Ziebarth et al. 2012). Still, identifying the genetic and molecular mechanisms that underlie the expression variation is a major challenge.
Expression quantitative trait loci (eQTL) mapping (reviewed in Gilad et al. 2008) is a powerful approach to dissect the genetic basis of expression differences. Transcript abundance is treated as a quantitative trait whose genetic determinants can be implicated by well-established linkage mapping techniques. The first eQTL studies in yeast illuminated the genetic landscape of gene expression-variation determinants under standard growth conditions (Brem et al. 2002; Yvert et al. 2003). Subsequent eQTL studies surveyed the genetic control of transcript abundance in Arabidopsis (Keurentjes et al. 2007; West et al. 2007), maize (Schadt et al. 2003), mice (Schadt et al. 2003), worms (Li et al. 2006), and humans (Cowles et al. 2002; Schadt et al. 2003). Collectively, these studies have catalogued the number of variable traits caused by cis-polymorphisms that occur locally on the affected DNA molecule (e.g., promoter sequence variation) vs. those affected by distant polymorphisms that act in trans to the affected gene (e.g., upstream physiological or regulatory differences that can affect many target genes). Many studies have detected a larger fraction of locally acting polymorphisms than trans effects (Gilad et al. 2008) (arguably due to the higher statistical power for their detection; Rockman and Kruglyak 2006; Kliebenstein 2009), and a notable number of genes are affected by both local and distant effectors (Brem et al. 2002; Smith and Kruglyak 2008).
The effects of genetic variation often differ depending on environmental conditions, and several studies have characterized the effects of gene–environment interaction (GEI) on expression variation when cells are grown continuously in different environments (Smith and Kruglyak 2008; Gagneur et al. 2013). However, many environment-responsive transcript changes occur transiently when cells are first shifted between conditions (Gasch et al. 2000; Gunasekera et al. 2008; Marks et al. 2008; Eng et al. 2010; Stanley et al. 2010). As such, the genetic determinants of environmental responses are less well characterized by genetic mapping. To date, a small number of eQTL studies have examined dynamic responses to changing conditions (Gargalovic et al. 2006; Li et al. 2006; Smirnov et al. 2009; Yang et al. 2009; Barreiro et al. 2012; Gat-Viks et al. 2013). Gat-Viks et al. (2013) examined the response of mouse dendritic cells to multiple distinct stimuli, leading to the discovery of eQTL that were either common to many stimuli or specific to particular conditions. Leveraging “common” and “specific” eQTL allowed the authors to both refine known signaling pathways and pinpoint the true causative loci for eQTL.
Here we sought to identify the genetic determinants of variation in the ethanol-stress response in several strains of Saccharomyces cerevisiae. A prior study performed eQTL mapping of steady-state growth on ethanol as a carbon source, but did not interrogate the dynamic response to ethanol stress at high concentrations (Smith and Kruglyak 2008). We previously showed extensive natural variation in the response to acute ethanol stress in three yeast strains: a lab strain derived from the commonly used S288c, vineyard isolate M22, and oak-soil strain YPS163 (Lewis et al. 2010). Across these strains, we identified thousands of gene expression differences in response to ethanol. Many of these differences persisted across modules of coregulated genes, suggesting trans-acting variation in regulators, signaling proteins, and/or environmental sensing and response. For example, targets of the “general stress” transcription factor Msn2p, the oxidative stress factor Yap1p, and the proteasome regulator Rpn4p were all affected coordinately across the strains. At least in the case of Rpn4p targets, the genetic determinant lies outside of the RPN4 gene, since swapping RPN4 alleles across strains did not affect expression variation in downstream targets (J. Lewis and A. Gasch, unpublished data).
To elucidate the genetic basis for these expression differences, we here conducted an eQTL analysis of ∼100 F2 progeny of S288c crossed to M22 or to YPS163. Although local linkages were prevalent, we identified scores of “hotspot” loci that affected tens to thousands of transcripts in trans. Several of these hotspots included transcription factors and upstream regulators, pointing to their role in the ethanol response. Overlap in hotspot transcripts pointed to additive interactions between implicated regulators as well as “epi-hotspots” of interacting determinants. Together, our results shed new light on the ethanol signaling system and increase our understanding of the genetic complexity of the yeast ethanol response.
Materials and Methods
Strains and growth conditions
Strains are listed in Supporting Information, File S1. The parental strains for QTL mapping were YPS163, M22, and S288c-derived DBY8268 (hereafter referred to as S288c). The QTL mapping strains from the S288c × M22 and S288c × YPS163 crosses are described in Kim and Fay (2007) (kindly provided by J. Fay). Deletions in the BY4741 background were obtained from Open Biosystems and verified by diagnostic PCR. MKT1 was deleted from a haploid derivative of YPS163 (YPS163-1 hoΔ::HygMX; Lewis et al. 2010) by homologous recombination with the mkt1::KanMX cassette amplified from the yeast knockout strain (Winzeler et al. 1999) and subsequently verified by diagnostic PCR.
C-terminal Mkt1p-GFP and Edc3p-dTomato fusions were genomically integrated into the MKT1 or EDC3 locus of both the BY4741 and YPS163-1 hoΔ::HygMX backgrounds (verified via diagnostic PCR and sequencing). For GFP fusions, pFA6a-GFP(S65T)-NatMX6 was used as a PCR template (Van Driessche et al. 2005). To generate dTomato fusions, we used restriction-free (RF) cloning (van den Ent and Lowe 2006) to construct a new template vector (pFA6a-dTomato-KanMX6) by replacing the 13myc tag in pFA6a-13myc-KanMX6 (Longtine et al. 1998) with the dTomato coding sequence from pFA6a-TEF2Pr-dTomato-ADH1-NATMX4 (Breslow et al. 2008) (kindly provided by J. Weissman). Diploid hybrid strains for reciprocal hemizygosity were generated by mating YPS163-1 hoΔ::HygMX mkt1Δ::KanMX to BY4741 MKT1-GFP, or YPS163-1 hoΔ::HygMX MKT1-GFP to BY4741 mkt1Δ::KanMX. Images of cells expressing Mkt1p-GFP and/or Edc3p-dTomato were taken with a Carl Zeiss AxioVision microscope.
For all growth experiments, cells were grown in batch culture in YPD (1% yeast extract, 2% peptone, 2% glucose) at 30°. For ethanol shock experiments, cells were grown four generations to an optical density (OD600) of 0.3. A sample of unstressed cells was collected, and then ethanol was added to a final concentration of 5% (v/v) for 30 min, which comprises the peak expression response for each strain (Lewis et al. 2010).
Microarray hybridization and analysis
Six replicate cultures of each parental strain and duplicate cultures for each QTL mapping strain were used to collect unstressed and ethanol-stressed samples. Cell collection, RNA isolation, and cDNA labeling were performed as described in Lewis and Gasch (2012). cDNA was labeled with amino-allyl dUTP (Ambion) and cyanine dyes (Flownamics). Inverse dye labeling was used in replicates to control for dye-specific effects. The labeled cDNA sample from each ethanol-treated culture was mixed with the corresponding sample from the unstressed culture and hybridized to custom Nimblegen tiled arrays designed against the S288c genome (previously validated for gene expression analysis in Lee et al. (2011) and Huebert et al. (2012), spanning both strands of the yeast genome, according to the manufacturer’s instructions (Roche-Nimblegen). To eliminate hybridization differences across strains, we removed from analysis all probes with sequence variation between S288c, M22, and YPS163 (Doniger et al. 2008). Arrays were scanned and analyzed with a GenePix4000 scanner (Molecular Devices, Sunnyvale, CA), and the background-subtracted signal from both channels was extracted with the program NimbleScan. Data normalization was performed using quantile normalization of the pooled array data as in Wohlbach et al. (2011). Expression differences in response to ethanol were taken as the log2 ratio of the red/green signal from the arrays. To compare absolute transcript abundance for unstressed or ethanol-treated cells, the signal from the individual channels was extracted, compared, and quantile normalized as described above. File S2, File S3, and File S4 contain the normalized expression data. All microarray data are available through the National Institutes of Health Gene Expression Omnibus (GEO) database under accession no. GSE54196.
Genes with significant differences in ethanol responsive expression in the parental strains (compared to the mean expression across all strains) were identified using the BioConductor package Limma v 2.10.2 (Smyth 2004) and q-value correction (Storey and Tibshirani 2003) taking P < 0.01 as significant (see File S5 for Limma output). Gene expression differences were organized by model-based multinomial clustering, using the VII model in mclust and the Bayesian information criterion (BIC) (Fraley and Raftery 2002). The cluster centroids were organized by hierarchical clustering, and highly similar clusters were manually collapsed into 46 distinct clusters. Enrichment of gene ontology (GO) functional categories was performed using GO terms (5% false discovery rate, FDR) (Boyle et al. 2004) or compiled lists of transcription factor and RNA binding proteins (1% FDR) taken from Harbison et al. (2004); MacIsaac et al. (2006); Teixeira et al. (2006); Monteiro et al. (2008); and Abdulrehman et al. (2011).
eQTL mapping
Single mapping scans were performed using Haley–Knott regression (Haley and Knott 1992) implemented through the R/QTL software package (Broman et al. 2003). Single-cross scans were performed for the S288c-M22 and S288c-YPS163 crosses separately in three different “regimes”: by scoring absolute transcript abundance in unstressed (“basal”) or ethanol-stressed cells, and by mapping the log2 (fold-change) in abundance upon ethanol treatment (“ethanol response”). Because both crosses involve the S288c strain, we also performed a combined cross across both mapping sets, for each mapping regime. For markers where S288c differed from both M22 and YPS163, we set the M22 and YPS163 markers to be equivalent, and we included “cross” as an interactive covariate. In addition, “ploidy” was included as an additive covariate, since the segregants are either haploid or diploid strains depending on whether they inherited the wild or lab allele of the HO endonuclease (conferring mating type switching or not, respectively). Significant LOD scores (5% FDR) were determined by estimating the distribution of genome-wide maximum LOD scores under the global null hypothesis of no segregating QTL. This was performed via 100,000 simulations as follows. First, phenotypes for the segregants were randomly simulated using the rnorm function in the R stats package v. 2.15.2 (vector of means set to 0, vector of standard deviations set to 1). Single mapping scans were then performed on each set of simulated phenotypes using the same parameters as above, including appropriate covariates. This generated a simulated distribution of 100,000 maximum LOD scores. The maximum LOD scores were sorted, and the 95th percentile was used to set the global FDR at 5%. This corresponded to a LOD = 3.96 for the combined cross, LOD = 3.29 for the S288c-M22 cross, and LOD = 3.27 for the S288c-YPS163 cross. All significant linkages are reported in File S6. Linkages were considered local (cis) if they mapped within ±20 cM of the ORF of the trait. This threshold was chosen to increase our ability to detect local linkages that fall directly in-between markers, which were spaced ∼30 cM apart.
We identified hotspots as loci that affect many different traits. To infer the hotspot architecture, we counted the number of traits mapping significantly to each locus along the chromosome using a sliding 5-cM window. We defined the hotspot “peak” as the position with the maximum number of traits mapped to it. Traits were assigned to a particular hotspot if their 1.5 LOD support interval fell within 10 cM of that hotspot’s peak. We identified significant eQTL hotspots affecting at least 20 traits in one condition using the quantile-based permutation (NL) method of Neto et al. (2012), implemented through R/qtlhot. One thousand permutations were performed for each mapping regime, and hotspots passing a 5% FDR cutoff were called significant. To overcome differences in statistical power for each mapping regime, transcripts that mapped to the same hotspot (within 20 cM) in one or more mapping regime were pooled to identify 37 unique hotspots. Cross-specific hotspots were those identified in only one of the two single-cross mappings. Enrichment of gene functional groups or known regulators was performed using GO terms (5% FDR) (Boyle et al. 2004) or compiled lists of transcription factor and RNA binding proteins (1% FDR) taken from Harbison et al. (2004); MacIsaac et al. (2006); Teixeira et al. (2006); Monteiro et al. (2008); and Abdulrehman et al. (2011).
Interactions between hotspots and other loci were identified using the method described in Broman and Sen (2009). For a given hotspot, mapping of the combined crosses was reperformed by holding the marker nearest to that hotspot as an interactive covariate (LODf) or as an additive covariate (LODa). The interaction term (LODi) was calculated as LODf − LODa. Traits were considered to have a significant hotspot interaction if both LODf and LODi were significant at a 5% FDR (calculated via 100,000 simulations as described above).
Enrichment analyses were done using the hypergeometric distribution, calculating the probability of observing the number of observed occurrences or more from the appropriate background set of genes. Transcripts mapping to the MKT1 locus were clustered using Mclust as described above to identify 26 discrete clusters. Enrichment of regulator targets (including kinases, phosphatases, transcription factors, and RNA binding proteins) was performed using targets defined by D. Berry, Y. Ho, M. MacGilvray, A. Gasch, unpublished data.
Results
Extensive natural variation in ethanol-responsive transcriptional modules
To confirm the extent of natural variation in the parental strains responding to ethanol stress, we first analyzed changes to the transcriptome in the three diploid strains (S288c-derived DBY8268, M22, and YPS163) responding to 5% ethanol for 30 min, in six biological replicates. Over half of the genome (3287/6532 genes) exhibited differential ethanol-responsive expression (FDR < 0.01) in at least one strain (File S5). This fraction is significantly higher than that of our previous study (Lewis et al. 2010), likely a reflection of increased statistical power from additional replicates and improved array technology (Brem et al. 2002; Smith and Kruglyak 2008).
We used model-based clustering (see Materials and Methods) to categorize the gene expression differences into 46 distinct clusters (Figure 1). Most of these clusters were enriched for functionally related genes, as well as known targets of various transcription factors or RNA-binding proteins (File S7). This strongly suggests the prevalence of trans-acting effects on gene expression variation. Much of the expression variation was unique to the lab strain, including gene clusters related to glycogen (P = 2 × 10⁻⁵) and trehalose metabolism (P = 5 × 10⁻⁷), asparagine metabolism (P = 1 × 10⁻⁵), and the responses to heat (P = 8 × 10⁻⁷) and oxidative stress (P = 0.001). Several other clusters represented strain-specific responses between the oak and vineyard strains, suggesting natural variation in the ethanol response across wild isolates. M22-specific clusters were enriched for genes involved in telomere maintenance (0.001), cytoplasmic translation (2 × 10−190), and translation initiation (3 × 10⁻¹⁰). YPS163-specific clusters were enriched for proteolysis (1 × 10⁻¹³), regulation of translation (2 × 10⁻⁸), cellular localization (1 × 10⁻⁴), and ribosome biogenesis (1 × 10⁻³⁴).
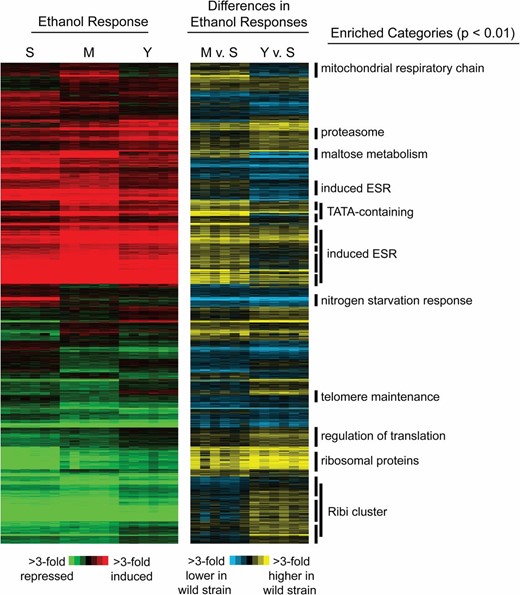
Extensive variation in the ethanol response between S288c, M22, and YPS163. A total of 3515 genes with differential ethanol responses in any strain relative to the average (FDR = 0.01) were organized by model-based clustering into 46 distinct clusters (see Materials and Methods). The left portion of the heat map displays expression changes in response to ethanol across six biological replicates for S288c-derived strain DBY8268 (S), M22 (M), and YPS163 (Y). Differences in ethanol response in each wild strain vs. the lab strain are shown in the right portion of the figure. Each row represents a gene, and each column represents a single microarray experiment or strain comparison. Red indicates induced and green indicates repressed expression in response to ethanol, while yellow indicates higher expression and blue indicates lower expression for M22 or YPS163 vs. S288c, according to the key. Enriched functional groups (Bonferroni corrected P < 0.01) are annotated to the right. ESR, environmental stress response; RiBi, ribosome biogenesis genes.
eQTL mapping of the ethanol response
The striking differences in the ethanol-dependent expression modules across strains suggested key differences in ethanol sensing and/or signaling. To explore the genetic basis for these differences, we measured changes in expression at 30 min after 5% ethanol treatment in 45 F2 strains from two crosses: S288c × M22 and S288c × YPS163, in biological duplicate. We performed eQTL mapping in three separate regimes for each cross: by comparing differences in absolute transcript abundance before (basal) and after ethanol treatment, and by scoring the fold change in transcript abundance upon ethanol treatment, which we refer to as the ethanol response (see Materials and Methods). Mapping the ethanol response inherently captures GEI interactions, because it compares expression across strains and across environments. Because of the prominent differences in the common S288c strain, we also performed a “combined-cross” analysis by pooling cross data together and using the cross identifier as a covariate in the mapping (see Materials and Methods). This combined strategy allowed us to identify cross-specific eQTL, implicating effects that were specific to M22, YPS163, or S288c.
Our initial mapping revealed that 1200 transcripts mapped to the HO locus, strongly suggesting that differences in ploidy have a significant effect on the ethanol response (Figure S1). The F2 strains resulting from the cross are either diploid or haploid, depending on whether they inherited a functional HO allele from the wild parent that allows mating-type switching and subsequent selfing to form diploids (Taxis et al. 2005). The ploidy-affected transcripts were strongly enriched for a variety of functions, including cytoplasmic translation (P = 4 × 10−88), ribosome biogenesis (P = 5 × 10⁻²⁴), nitrogen compound metabolism (1 × 10⁻²²), glucose metabolism (1 × 10⁻⁹), and response to pheromone (3 × 10⁻⁷). To better detect eQTL that represent natural variation across strain lineages, we therefore focused our attention on mapping regimes that included ploidy as a covariate to mitigate its effect.
Our analysis identified 4055 transcripts that could be mapped significantly to at least one locus, in one or more mapping regimes (Table 1, Figure S1, and Figure S2). Eighty to 87% of transcripts (depending on the mapping regime) mapped to a single locus, while 12–16% and 1–3% of eQTL mapped to two or more than two loci, respectively. Mapping the fold change in transcript abundance (ethanol response) identified significantly fewer eQTL linkages overall and pointed to a greater number of transcripts mapping to only a single locus, compared to other mapping regimes. This may reflect reduced statistical power when comparing fold changes in abundance across strains.
eQTL mapping summary
| Total transcripts mappeda | Number (%) mapping to 1 locus | Number (%) mapping to 2 loci | Number (%) mapping to 3 or more loci | |
|---|---|---|---|---|
| Basal abundance mapping | 2675 | 2149 (80) | 440 (16) | 85 (4) |
| Ethanol abundance mapping | 2499 | 2091(83) | 350 (14) | 58 (3) |
| Ethanol response mapping | 1847 | 1612 (87) | 213 (12) | 21 (1) |
| One or more mapping regime | 4055 |
The mapping was performed using the combined crosses.
| Total transcripts mappeda | Number (%) mapping to 1 locus | Number (%) mapping to 2 loci | Number (%) mapping to 3 or more loci | |
|---|---|---|---|---|
| Basal abundance mapping | 2675 | 2149 (80) | 440 (16) | 85 (4) |
| Ethanol abundance mapping | 2499 | 2091(83) | 350 (14) | 58 (3) |
| Ethanol response mapping | 1847 | 1612 (87) | 213 (12) | 21 (1) |
| One or more mapping regime | 4055 |
The mapping was performed using the combined crosses.
We also looked at the proportion of mapped transcripts that were linked to their own locus (within ±20 cM from the regulated transcript’s open reading frame) vs. other distant loci (Figure 2). Roughly 25–30% of mapped transcripts (depending on mapping regime) were linked locally to their own locus, suggesting possible cis-variation at those loci (Table 2). Depending on the mapping regime, 5–10% of transcripts mapped both locally and distantly, and these transcripts made up half of all of those that mapped to more than one locus. Cis-acting eQTL are reported to have larger effect sizes, making them easier to detect (Petretto et al. 2006). Consistently, we observed that cis- and trans-acting eQTL had mean LOD scores of 8.7 and 5.6, respectively, a difference that was highly significant (P = 2 × 10−118, t-test).
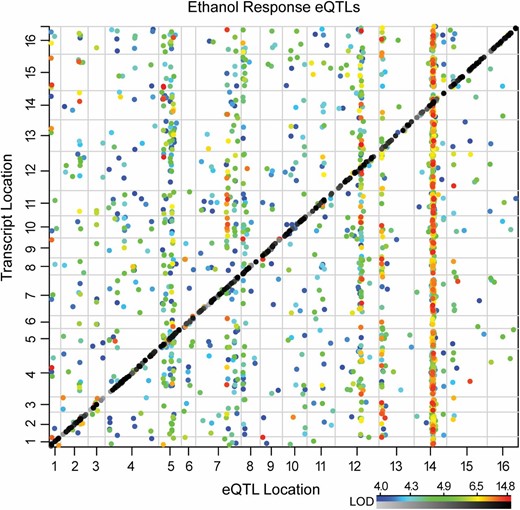
Local and distant mapping of transcripts. The genetic position of ethanol-responsive eQTL (x-axis) is plotted against the genetic position of the transcript trait (y-axis). The greyscale heat map denotes the LOD scores of local eQTL (diagonal), and the colored heat map indicates LOD scores of distant eQTL (see Materials and Methods), where the color is proportionate to LOD score as shown in the key.
Local vs. distant linkages
| % local linkagesa | % distant linkages | % mapping to both local and distant loci | Total linkages | |
|---|---|---|---|---|
| Basal abundance mapping | 29.7 | 70.2 | 287 (8.7%) | 3296 |
| Ethanol abundance mapping | 28.4 | 71.6 | 220 (7.4%) | 2975 |
| Ethanol response mapping | 24.5 | 75.5 | 113 (5.3%) | 2108 |
The mapping was performed using the combined crosses.
| % local linkagesa | % distant linkages | % mapping to both local and distant loci | Total linkages | |
|---|---|---|---|---|
| Basal abundance mapping | 29.7 | 70.2 | 287 (8.7%) | 3296 |
| Ethanol abundance mapping | 28.4 | 71.6 | 220 (7.4%) | 2975 |
| Ethanol response mapping | 24.5 | 75.5 | 113 (5.3%) | 2108 |
The mapping was performed using the combined crosses.
eQTL hotspots point to known and novel regulators
The image in Figure 2 revealed that a significant number of transcripts map distantly to the same eQTL loci, implicating the existence of hotspot loci affecting many traits. We therefore scanned the genome for hotspots that were linked to at least 20 transcripts in any of the mapping regimes. Because spurious hotspots may arise due to nongenetic correlations between expression traits (Neto et al. 2012), we used permutation tests to assess hotspot significance (see Materials and Methods). To overcome differences in statistical power, transcripts that mapped to the same hotspot region in one or more mapping regimes from the same cross were pooled.
We identified 37 unique hotspots (5% FDR) that together encompassed 2797 different transcripts (Table 3, Figure 3, Figure S2). Only 1752 (63%) of these represented genes that were scored as differentially expressed in the parental strains, suggesting that >1000 transcripts mapping to hotspots may be affected by transgressive segregation that emerges in the F2’s. The number of transcripts mapping to each hotspot ranged from 20 to >1200, with a median of 37 transcripts per hotspot. Of the 37 hotspots, 15 were observed in both crosses, whereas 12 were unique to the M22 × S288c cross and 10 were unique to the YPS163 × S288c cross (Figure 3). Overall, 24 of the 37 hotspots were significantly enriched for functionally related genes and/or known targets of transcription factors or RNA-binding proteins (Table 3 and File S8).
eQTL hotspots
| Peak | Mappinga | Crossb | Total linkages | Enrichment summary | Chr. | Candidate gene |
|---|---|---|---|---|---|---|
| 1 | B, E | Both | 53 | Fatty acid metabolism | I | OAF1 (Litvin et al. 2009) |
| 2 | B, E, R | Both | 98 | Cell division | II | AMN1 (Yvert et al. 2003) |
| 3 | B, E | YS | 85 | |||
| 4 | B, E, R | Both | 37 | Mating, HMR | III | MAT-ALPHA1 |
| 5 | B | MS | 28 | Electron transport, iron-sulfur cluster, metal binding | IV | RGT2 |
| 6 | B, E | MS | 32 | Y′ elements | IV | |
| 7 | B | Both | 81 | Fatty acid oxidation, cell wall | V | URA3 |
| 8 | B, E, R | YS | 285 | iESR | V | TSC11/DOT6 |
| 9 | B, E | MS | 124 | VII | VPS73 | |
| 10 | B, R | MS | 74 | Methionine/sulfate metabolism | VII | CYS4 (Kim and Fay 2007) |
| 11 | B, E, R | YS | 126 | Mitochondrial RPs | VII | CIR1 |
| 12 | B, E, R | Both | 152 | VIII | ||
| 13 | B, E, R | Both | 376 | Sterol biosynthesis, respiration | XII | HAP1 (Brem et al. 2002) |
| 14 | B, E | YS | 47 | Dubious ORFs/Y′ elements | XII | |
| 15 | B, E, R | Both | 152 | Vacuole, arginine metabolism, phosphate metabolism | XIII | PHO84 (Perlstein et al. 2007) |
| 16 | B | MS | 24 | XIII | PSE1 | |
| 17 | B, E, R | Both | 1264 | Mitochondrion, mitochondrial RPs | XIV | MKT1 (Lee et al. 2009) |
| 18 | B, R | Both | 47 | XV | ||
| 19 | B | Both | 35 | XV | ||
| 20 | B | MS | 28 | XV | ||
| 21 | B | YS | 33 | Phosphorous metabolism | XVI | FUM1 |
| 22 | E | YS | 26 | IV | NDE2 | |
| 23 | E | YS | 35 | IV | ||
| 24 | E | Both | 33 | mRNA processing | VII | RNA15 |
| 25 | E | YS | 30 | X | ||
| 26 | E, R | MS | 60 | iESR, trehalose | XII | PHD1 |
| 27 | E | MS | 35 | vacuole | XIII | |
| 28 | E | MS | 25 | XIV | ||
| 29 | E | MS | 36 | XV | ||
| 30 | E | Both | 25 | XV | PRE6 | |
| 31 | E, R | Both | 79 | V | FAA2 | |
| 32 | R | Both | 48 | Ribi cluster, nucleolus | VIII | SBP1, RPL8A |
| 33 | R | YS | 20 | X | ||
| 34 | R | MS | 22 | IV | ||
| 35 | R | MS | 39 | Ribosome biogenesis | VII | |
| 36 | E | Both | 27 | III | ||
| 37 | E | YS | 28 | II |
iESR, induced ESR genes; rESR, repressed ESR genes; RiBi: ribosome biogenesis genes in the ESR. References are provided for candidate genes observed in other QTL studies.
Mapping regime: basal abundance (B), ethanol abundance (E), and ethanol response (R).
Cross where hotspot was observed: S288c × M22 (MS), S288c × YPS163 (YS), or both.
| Peak | Mappinga | Crossb | Total linkages | Enrichment summary | Chr. | Candidate gene |
|---|---|---|---|---|---|---|
| 1 | B, E | Both | 53 | Fatty acid metabolism | I | OAF1 (Litvin et al. 2009) |
| 2 | B, E, R | Both | 98 | Cell division | II | AMN1 (Yvert et al. 2003) |
| 3 | B, E | YS | 85 | |||
| 4 | B, E, R | Both | 37 | Mating, HMR | III | MAT-ALPHA1 |
| 5 | B | MS | 28 | Electron transport, iron-sulfur cluster, metal binding | IV | RGT2 |
| 6 | B, E | MS | 32 | Y′ elements | IV | |
| 7 | B | Both | 81 | Fatty acid oxidation, cell wall | V | URA3 |
| 8 | B, E, R | YS | 285 | iESR | V | TSC11/DOT6 |
| 9 | B, E | MS | 124 | VII | VPS73 | |
| 10 | B, R | MS | 74 | Methionine/sulfate metabolism | VII | CYS4 (Kim and Fay 2007) |
| 11 | B, E, R | YS | 126 | Mitochondrial RPs | VII | CIR1 |
| 12 | B, E, R | Both | 152 | VIII | ||
| 13 | B, E, R | Both | 376 | Sterol biosynthesis, respiration | XII | HAP1 (Brem et al. 2002) |
| 14 | B, E | YS | 47 | Dubious ORFs/Y′ elements | XII | |
| 15 | B, E, R | Both | 152 | Vacuole, arginine metabolism, phosphate metabolism | XIII | PHO84 (Perlstein et al. 2007) |
| 16 | B | MS | 24 | XIII | PSE1 | |
| 17 | B, E, R | Both | 1264 | Mitochondrion, mitochondrial RPs | XIV | MKT1 (Lee et al. 2009) |
| 18 | B, R | Both | 47 | XV | ||
| 19 | B | Both | 35 | XV | ||
| 20 | B | MS | 28 | XV | ||
| 21 | B | YS | 33 | Phosphorous metabolism | XVI | FUM1 |
| 22 | E | YS | 26 | IV | NDE2 | |
| 23 | E | YS | 35 | IV | ||
| 24 | E | Both | 33 | mRNA processing | VII | RNA15 |
| 25 | E | YS | 30 | X | ||
| 26 | E, R | MS | 60 | iESR, trehalose | XII | PHD1 |
| 27 | E | MS | 35 | vacuole | XIII | |
| 28 | E | MS | 25 | XIV | ||
| 29 | E | MS | 36 | XV | ||
| 30 | E | Both | 25 | XV | PRE6 | |
| 31 | E, R | Both | 79 | V | FAA2 | |
| 32 | R | Both | 48 | Ribi cluster, nucleolus | VIII | SBP1, RPL8A |
| 33 | R | YS | 20 | X | ||
| 34 | R | MS | 22 | IV | ||
| 35 | R | MS | 39 | Ribosome biogenesis | VII | |
| 36 | E | Both | 27 | III | ||
| 37 | E | YS | 28 | II |
iESR, induced ESR genes; rESR, repressed ESR genes; RiBi: ribosome biogenesis genes in the ESR. References are provided for candidate genes observed in other QTL studies.
Mapping regime: basal abundance (B), ethanol abundance (E), and ethanol response (R).
Cross where hotspot was observed: S288c × M22 (MS), S288c × YPS163 (YS), or both.
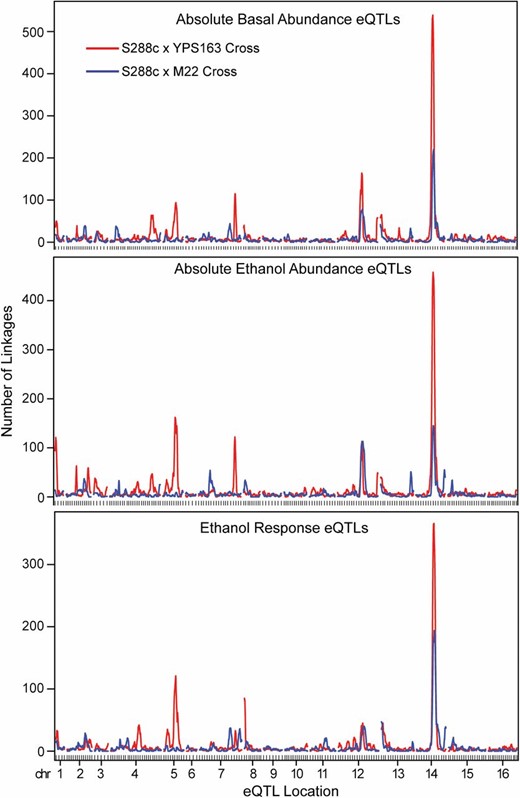
Cross-specific and condition-specific hotspots. The average number of transcripts (using a sliding 5-cM window) mapping to each locus across the 16 yeast chromosomes (x-axis) is plotted for each of the three mapping regimes, for the S288c × YPS163 cross (red) and the S288c × M22 cross (blue).
Candidate causal genes were identified by manually interrogating genes encompassed by each hotspot; several candidates represented known polymorphisms while others implicated novel regulators. For example, the large hotspot on chromosome XII captures a known S288c-specific polymorphism in the transcription factor HAP1 (Gaisne et al. 1999; Brem et al. 2002); accordingly, transcripts associated with this hotspot include Hap1 targets and capture Hap1p-regulated processes, including ergosterol metabolism (3 × 10⁻²¹) and cellular respiration (1 × 10⁻¹⁰). The S288c × M22-specific hotspot on chromosome VII points to a known polymorphism in the cystathionine beta-synthase CYS4 (Kim and Fay 2007; Kim et al. 2009), with targets enriched for genes involved in methionine (6 × 10⁻¹⁸) and cysteine (6 × 10⁻¹⁰) biosynthesis. The largest hotspot from all three mapping regimes was found on chromosome XIV, spanning a known causal polymorphism in the MKT1 gene (Deutschbauer and Davis 2005; Smith and Kruglyak 2008; Zhu et al. 2008). Natural variation in MKT1 has been implicated in a large number of phenotypic differences, ranging from mitochondrial stability (Nickoloff et al. 1986), drug resistance (Kim and Fay 2009), thermotolerance (Steinmetz et al. 2002; Sinha et al. 2006), sporulation (Deutschbauer and Davis 2005), and DNA-damage sensitivity (Ehrenreich et al. 2010). Importantly, natural variation in MKT1 has been linked to high ethanol tolerance in a Brazilian bioethanol production strain compared to a lab strain (Swinnen et al. 2012). Our observation that MKT1 affects a large number of transcripts responding to ethanol suggests a potential link between Mkt1p-affected transcriptional responses and ethanol defense (see below and Discussion).
Several other hotspots point to previously unknown loci that contain known regulators. For example, the enrichment for genes involved in respiration and in iron–sulfur metabolism (which occurs in mitochondria and is required for respiration) among transcripts that link to hotspot peak 5 hints at a role for RGT2, which encodes a key membrane-bound glucose sensor in yeast (Ozcan et al. 1996, 1998). The enrichment for amino acid metabolism transcripts among those that link to hotspot peak 8 points to TSC11, a member of the amino-acid-responsive TOR complex (Loewith et al. 2002); it is notable that transcripts encoding translation machinery, which are repressed in the yeast environmental stress response (ESR), are also linked to this hotspot but may instead be due to variation at DOT6, a gene near TSC11 that is the known repressor of ESR genes (Lippman and Broach 2009; Huber et al. 2011). Other hotspots enriched for transcripts related to fatty acid metabolism (peak 1), mating (peak 4), and stress and trehalose metabolism (peak 26) suggest the effects of transcription factors Oaf1p, Mat-alpha, and Phd1p that are encoded within those hotspot loci, respectively.
Interactions between hotspots indicate additive and epistatic relationships
Several of the hotspots were enriched for similar functional categories, raising the possibility that the same genes were linked to multiple hotspots. Indeed, we found significant overlap in the targets of a number of hotspots (Figure 4). Notably the MKT1 and HAP1 hotspots were hubs of overlap, since both their target sets overlapped with targets of five other hotspots. In several of these cases, we observed functional similarities between the candidate causal genes within those hotspots. For example, the overlap in targets linked to Hap1p, Rgt2p, Fum1p, and Nde2p points to respiratory effects: Hap1p and Rgt2p both regulate genes related to respiration and glucose metabolism, while fumarase Fum1p and NADH dehydrogenase Nde2p are critical for respiration. Transcripts linked to Mkt1p, which binds to the HO transcript to mediate translational regulation (Tadauchi et al. 2004), overlap with transcripts linked to peak 24, which encodes Rna15p, a protein that regulates mRNA polyadenylation and stability (Minvielle-Sebastia et al. 1991; Minvielle-Sebastia et al. 1994; Gross and Moore 2001).
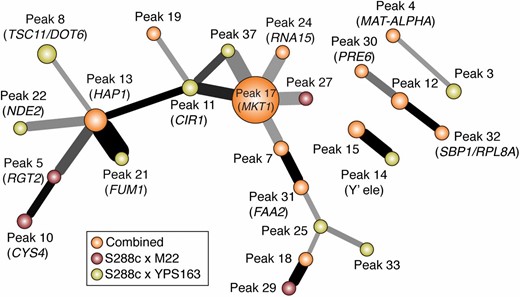
Significant overlap in hotspot targets. Each node represents a hotspot, where the size is proportionate to the number of transcripts mapping to it. Edges between nodes represent statistically significant overlap (FDR < 0.05), where the thickness of the edge is proportionate to the fraction of the smaller node’s targets in the overlap and where the color of the edge is proportionate to the −log(P-value) of the overlap (with black = 5). Hotspots are colored according to the cross in which they were identified, according to the key.
The overlap in hotspot targets could represent additive interactions if the causal loci independently modulate transcript abundance; alternatively, the overlap may arise due to epistatic interactions between causal genes within those hotspots. To investigate this, we explicitly tested for epistatic interactions by reperforming the mapping for each regime, with each hotspot fixed as an interactive covariate, to identify eQTL with a significant interactive term (see Materials and Methods). We then identified hotspots from the interactive scans as epistatic hotspots, or epi-hotspots. To minimize spurious interactions, we focused only on epi-hotspots that displayed significant functional enrichment of the associated transcripts.
We identified 24 epi-hotspots whose targets are affected by epistatic interactions between the two eQTL effectors (Table 4 and Figure 5). In all, 803 unique transcripts mapped to an epi-hotspot, with 10 to 118 (25) transcripts per epi-hotspot peak (File S9). None of the pairs of hotspots with overlapping target sets shown in Figure 4 were identified as epi-hotspots, indicating that most of the overlap we initially observed represents additive hotspot effects. However, we uncovered several other epi-hotspots involving two or more regions implicated from the 1D mapping regimes: for example the interaction between peak 13 (Hap1p) and peak 1 (Oaf1p) represents an epi-hotspot—the candidate regulators encoded at these loci both affect membrane fluidity through ergosterol (Kennedy et al. 1999; Jensen-Pergakes et al. 2001; Tamura et al. 2004) and fatty acid composition (Karpichev et al. 1997; Karpichev et al. 2008), respectively. Several loci were associated with multiple epi-hotspots, including peak 13 (HAP1) linked to four epi-hotspots, and peak 4 (MAT-ALPHA1), peak 7 (URA3), peak 12, peak 17 (MKT1), and peak 31 (FAA2) that were each linked to three epi-hotspots. Several other epi-hotspots implicated new peaks that were not found in the 1D mapping scans.
Genetic interactions between hotspots
| Peak | ID Interacting hotspot | Mapping regimea | Total linkages | Enrichment summary | Chr. | Candidate gene |
|---|---|---|---|---|---|---|
| 1 | Peak12 | B, E | 52 | Ribi cluster | III | |
| 2 | Peak12 | R | 12 | RPs, translation, ribosome | X | |
| 3 | Peak13 (HAP1) | B, E | 62 | iESR, response to heat | I | OAF1 |
| 4 | Peak13 (HAP1) | E, R | 66 | RPs, translation, ribosome | V | TSC11/DOT6 |
| 5 | Peak15 (PHO84) | B, E, R | 118 | iESR | V | URA3 |
| 6 | Peak15 (PHO84) | R | 21 | RPs | V | |
| 7 | Peak17 (MKT1) | R | 22 | Intracellular mRNA localization | XIII | |
| 8 | Peak17 (MKT1) | B, E | 41 | Mitochondrial RPs, mitochondrial translation | XV | |
| 9 | Peak18 | E, R | 61 | RPs, translation, ribosome | V | TSC11/DOT6 |
| 10 | Peak19 | B, E, R | 50 | mitochondrial RPs | X | 1D Peak25 |
| 11 | Peak2 (AMN1) | E | 17 | RPs, translation, ribosome | VII | CYS4 |
| 12 | Peak24 (RNA15) | B | 24 | Electron transport chain, aerobic respiration | IV | NDE2 |
| 13 | Peak30 (PRE6) | E | 10 | Asparagine metabolism, response to nitrogen starvation | XIV | |
| 14 | Peak31 (FAA2) | B | 22 | RiBi cluster | VII | |
| 15 | Peak31 (FAA2) | R | 21 | RiBi cluster | VII | CIR1 |
| 16 | Peak31 (FAA2) | E | 12 | iESR | XI | PHD1 |
| 17 | Peak32 | B, E, R | 93 | Mitochondrial RPs | XIV | MKT1 |
| 18 | Peak36 | B, E | 25 | Mating | IV | |
| 19 | Peak4 (MAT-ALPHA1) | B, E, R | 24 | Mating | IV | |
| 20 | Peak4 (MAT-ALPHA1) | E | 34 | RPs, translation, ribosome | VIII | |
| 21 | Peak4 (MAT-ALPHA1) | B, E | 48 | iESR | XII | |
| 22 | Peak7 (URA3) | B, R | 55 | RPs, translation, ribosome | XIII | |
| 23 | Peak12 | B | 16 | Cell cycle | XII | HAP1 |
| 24 | Peak13 (HAP1) | B, E | 17 | Cell cycle | IX |
iESR, induced ESR genes; rESR, repressed ESR genes; RiBi: ribosome biogenesis genes in the ESR.
Mapping regime: basal abundance (B), ethanol abundance (E), and ethanol response (R); the mapping was performed using the combined crosses (see Materials and Methods).
| Peak | ID Interacting hotspot | Mapping regimea | Total linkages | Enrichment summary | Chr. | Candidate gene |
|---|---|---|---|---|---|---|
| 1 | Peak12 | B, E | 52 | Ribi cluster | III | |
| 2 | Peak12 | R | 12 | RPs, translation, ribosome | X | |
| 3 | Peak13 (HAP1) | B, E | 62 | iESR, response to heat | I | OAF1 |
| 4 | Peak13 (HAP1) | E, R | 66 | RPs, translation, ribosome | V | TSC11/DOT6 |
| 5 | Peak15 (PHO84) | B, E, R | 118 | iESR | V | URA3 |
| 6 | Peak15 (PHO84) | R | 21 | RPs | V | |
| 7 | Peak17 (MKT1) | R | 22 | Intracellular mRNA localization | XIII | |
| 8 | Peak17 (MKT1) | B, E | 41 | Mitochondrial RPs, mitochondrial translation | XV | |
| 9 | Peak18 | E, R | 61 | RPs, translation, ribosome | V | TSC11/DOT6 |
| 10 | Peak19 | B, E, R | 50 | mitochondrial RPs | X | 1D Peak25 |
| 11 | Peak2 (AMN1) | E | 17 | RPs, translation, ribosome | VII | CYS4 |
| 12 | Peak24 (RNA15) | B | 24 | Electron transport chain, aerobic respiration | IV | NDE2 |
| 13 | Peak30 (PRE6) | E | 10 | Asparagine metabolism, response to nitrogen starvation | XIV | |
| 14 | Peak31 (FAA2) | B | 22 | RiBi cluster | VII | |
| 15 | Peak31 (FAA2) | R | 21 | RiBi cluster | VII | CIR1 |
| 16 | Peak31 (FAA2) | E | 12 | iESR | XI | PHD1 |
| 17 | Peak32 | B, E, R | 93 | Mitochondrial RPs | XIV | MKT1 |
| 18 | Peak36 | B, E | 25 | Mating | IV | |
| 19 | Peak4 (MAT-ALPHA1) | B, E, R | 24 | Mating | IV | |
| 20 | Peak4 (MAT-ALPHA1) | E | 34 | RPs, translation, ribosome | VIII | |
| 21 | Peak4 (MAT-ALPHA1) | B, E | 48 | iESR | XII | |
| 22 | Peak7 (URA3) | B, R | 55 | RPs, translation, ribosome | XIII | |
| 23 | Peak12 | B | 16 | Cell cycle | XII | HAP1 |
| 24 | Peak13 (HAP1) | B, E | 17 | Cell cycle | IX |
iESR, induced ESR genes; rESR, repressed ESR genes; RiBi: ribosome biogenesis genes in the ESR.
Mapping regime: basal abundance (B), ethanol abundance (E), and ethanol response (R); the mapping was performed using the combined crosses (see Materials and Methods).
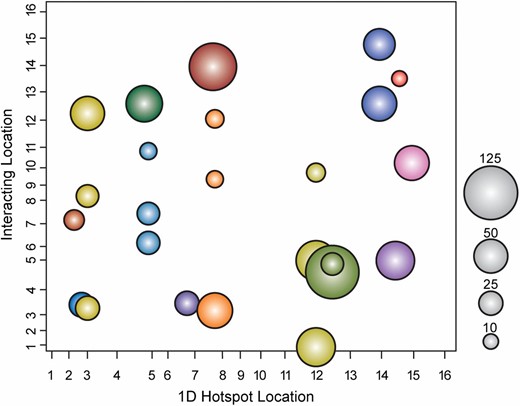
Epi-hotspots affect transcript variation. Each circle represents an epi-hotspot, where the coordinates on the x- and y-axes represent the interacting loci from the 1D scan and the 2D scan, respectively. The size of the circle represents the number of transcripts mapping with statistical significance to each epi-hotspot, according to the key (see Materials and Methods). Colors correspond to the same 1D hotspot.
Epistatic interactions have been extensively interrogated in gene-deletion mutants in laboratory strains (Decourty et al. 2008; Costanzo et al. 2010). We reasoned that lab-strain deletion data could inform on the interacting alleles within epi-hotspots and found several epi-hotpots that encompassed genes with genetic interactions in the lab strain. Three of the 24 epi-hotspots included genes with genetic interactions measured in the lab strain. Although this could arise by chance, interactions between genes in the MKT1 epi-hotpots pointed to functionality: MKT1 deletion in the lab strain produces epistatic effects when combined with deletion of SKI7 (Ridley et al. 1984) and DIA2 (Costanzo et al. 2010), encompassed in epi-hotspot peak 8. In contrast, Sbp1p, encoded in epi-hotspot 32, is reported to have a physical interaction with Mkt1p in the lab strain (Mitchell et al. 2013). The probability of observing this number of genetic or physical interactions by chance, given the number of genes under the interacting hotspots, is relatively low (P = 0.047, random sampling). Ski7p plays a role in regulating RNA turnover (Anderson and Parker 1998), while Sbp1p is a component of P bodies that has a known function in translational regulation (Segal et al. 2006; Mitchell et al. 2013). This information, together with the previous connection of Mkt1 to P-body-related genes (Lee et al. 2009) and translational regulation (Tadauchi et al. 2004), suggests that Mkt1p plays a role in these processes to affect downstream transcript abundance (see below).
Stress-regulated transcripts map to MKT1
The MKT1 hotspot represented the largest in our study, affecting >1000 transcripts across mapping regimes. Interestingly, transcripts mapping to MKT1 are enriched for messages encoding protein kinases (P < 1 × 10⁻¹⁴) and includes many signaling proteins and transcriptional regulators, particularly those linked to stress signaling. This includes regulators in the HOG (SSK2 and SKO1), PKC (RHO2 and BCK1), TOR (TOR1 and SCH9), RAS/PKA (RAS2 and GPB1), MEC (MEC1 and DUN1), and cell cycle networks (including cyclins), as well as other stress-activated transcriptional regulators (YAP1, YAP5, SKN7, PDR1, DOT6, and others) (File S10). Transcripts of several candidate regulators within hotspots (Table 3 and Table 4), including HAP1, OAF1, and PHD1, also mapped to the MKT1 locus. The effect of Mkt1 on regulator abundance could produce secondary effects on the regulators’ targets. Indeed, we find the known targets of many of these regulators or pathways to be enriched among the transcripts mapping to Mkt1 (File S10). Thus, polymorphisms at the MKT1 gene lead to widespread effects on stress and environmental signaling at the level of differential transcript abundance, likely contributing to the pleiotropic effects reported in other mapping studies (see Discussion).
Mkt1p localizes to P bodies upon ethanol stress in the S288c strain only
Given the links between Mkt1p, translation, and P-body formation, we wondered if Mkt1p might in fact be a P-body component. Indeed, we found that ethanol stress induced Mkt1p-GFP colocalization with P-body marker Edc3p-dTomato (Decker et al. 2007)—but only in the S288c strain and not in YPS163 (Figure 6). Reciprocal hemizygosity analysis (in which hemizygous hybrid strains lack either the S288c or YPS163 allele of MKT1) indicated that the differential localization is due to the MKT1 alleles, since only the hemizygote carrying the BY4741_Mkt1p-GFP allele formed foci during ethanol stress (Figure S3). The YPS163_Mkt1p-GFP allele did localize to P bodies under hypoosmotic stress, indicating that YPS163_Mkt1p can form foci under certain conditions (Figure S4). We hypothesize that Mtk1p may differentially affect translation of specific mRNAs in S288c and the wild strains responding to ethanol stress (see Discussion).
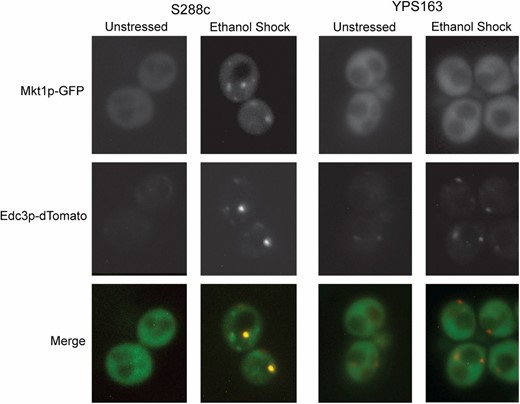
Mkt1p-GFP from S288c, but not YPS163, localizes to P bodies in response to ethanol stress. Localization of Mkt1p-GFP and Edc3p-dTomato was observed via fluorescence microscopy before and after 30-min treatment with 5% ethanol.
Discussion
Natural variation in a gene’s expression represents a complex trait subject to myriad levels of genetic control, including local (cis) and distant (trans) influences that may interact additively or epistatically and in environment-specific ways (Brem et al. 2002; Brem and Kruglyak 2005; Gibson and Weir 2005; Gilad et al. 2008; Smith and Kruglyak 2008; Zhu et al. 2008, 2012; Gagneur et al. 2013; Gat-Viks et al. 2013). The consequential effects on organismal phenotypes emerge from the suite of differences across all genes in the genome, highlighting the importance of considering network-level interactions that give rise to these differences. Our results together illuminate the architecture of natural variation in gene expression while implicating systemic differences in how yeast isolates perceive and/or respond to ethanol stress.
Similar to recent eQTL studies in yeast (Brem and Kruglyak 2005; Smith and Kruglyak 2008), we identified thousands of significant linkages. While our study had a smaller sample size than that of Smith and Kruglyak (2008) (89 segregants in our combined cross vs. 109 segregants in their single cross), and thus captured fewer eQTL for absolute transcript abundance, we captured more GEI eQTL in our study (2018 vs. 1555). One possibility is that the larger expression changes triggered by acute ethanol stress, compared to continuous growth after cells have acclimated, boost power to find strain-specific differences in expression. In addition, transient GEI exposed during acute stress responses may also uncover more GEI affects compared to continuous-growth experiments (Eng et al. 2010).
Of the thousands of transcripts mapped in this study, three-quarters were linked to one or more hotspot loci that each explained tens to >1000 traits. A lingering question of debate is the role of epistatic interactions between QTL, since detecting epistatic interactions remains a statistical challenge (Kapur et al. 2011; Huang et al. 2013). We overcame this hurdle by focusing on interactions with hotspot loci from the 1D mapping scan—this revealed hotspots of additive genetic interaction as well as a surprising number of epi-hotspots. We conservatively identified 803 expression traits mapped to an epi-hotspot (using our stringent criteria, see Materials and Methods), indicating a lower bound of 12% of all mapped traits affected by epistatic regulation. While this fraction is similar to previous reports citing that 14–16% of traits are affected by epistasis (Brem and Kruglyak 2005; Storey et al. 2005), these values are likely a significant underestimate. Nonetheless, they demonstrate the prevalence of epistatic interactions on expression control.
This study also provides new insight into the genetics underlying natural variation in the yeast ethanol-stress response. A significant fraction of hotspot loci, including additive and epi-hotspots, include candidate causal regulators and transcription factors; others implicate genes that influence physiology via enzymatic or transporter functions. Given that we previously showed that many of the transcript differences affect ethanol tolerance (Lewis et al. 2010), these results suggest insights into ethanol-stress defense. A recurring theme among affected genes links to respiration and carbon metabolism (Table 3 and Figure 4); this is consistent with a prior screen of the yeast deletion library that found that strains lacking respiratory components showed increased ethanol sensitivity (Yoshikawa et al. 2009). The S288c background has several mutations in regulators of respiration and carbon metabolism, including Hap1p and Mig3p (Gaisne et al. 1999; Lewis and Gasch 2012); however several of the hotspots we observe are cross specific, indicating that natural variation in carbon responses in wild strains also contributes to differences in ethanol tolerance (Lewis et al. 2010). Hap1p also controls genes involved in ergosterol biosynthesis, which affects membrane fluidity and thus ethanol tolerance (Kennedy et al. 1999; Jensen-Pergakes et al. 2001; Tamura et al. 2004). Likewise, variation in fatty acid consumption, controlled in part by the Oaf1 transcription factor, can alter the membrane content of cells to directly affect ethanol resistance (Chi and Arneborg 1999; You et al. 2003; Lockshon et al. 2007). The OAF1 and HAP1 loci represent an epi-hotspot and could together impart synergistic effects on ethanol tolerance. Such genetic interactions in natural isolates could provide a novel route to engineering increased ethanol tolerance in industrial ethanologenic strains.
By far the hotspot with the greatest influence on the yeast transcriptome is the MKT1 locus. Natural variation in MKT1 has been implicated in a large number of phenotypic differences between yeast strains (Nickoloff et al. 1986; Steinmetz et al. 2002; Deutschbauer and Davis 2005; Sinha et al. 2006; Zhu et al. 2008; Kim and Fay 2009; Ehrenreich et al. 2010), including tolerance to ethanol (Swinnen et al. 2012) and other stresses (Steinmetz et al. 2002; Demogines et al. 2008), though the mechanism of its effect remains obscure. Our results strongly suggest that the pleiotropic and condition-specific effects of Mkt1p are linked to widespread differences in transcriptional regulation and stress-activated signaling. The MKT1 linkage of transcripts encoding regulators, and in turn the linkage of many of their targets, suggests that Mkt1p affects the abundance, and thus activity, of signaling proteins. It is notable that MKT1-linked traits in our study are enriched for transcripts required for respiration (P = 9 × 10¹⁰) and heat survival (P = 2 × 10⁻⁶), perhaps explaining prior mapping studies linking MKT1 to mitochondrial genome stability and thermotolerance (Steinmetz et al. 2002; Dimitrov et al. 2009). We find that the S288c allele of Mkt1p colocalizes to P bodies upon ethanol stress. Given its role in translational regulation of the HO transcript (Tadauchi et al. 2004), our results present a model in which S288c_Mkt1p translationally silences specific mRNAs via P-body association during ethanol stress. The encoded regulators may affect the abundance of their own transcripts through feedback regulation, which is common in stress-regulated signaling.
Gene expression variation is hypothesized to play a large role in phenotypic variation at the organismal level. However, identifying the variable transcripts that cause differences in organismal fitness is challenging, given the hundreds to thousands of gene expression differences across individuals. Future studies to couple variation in F2 ethanol tolerance and in F2 transcript regulation will further implicate transcript differences that underlie stress tolerance.
Acknowledgments
We thank Justin Fay for providing strain panels and Karl Broman, Brian Yandell, Shuyun Ye, and Christina Kendziorski for helpful conversations. This work was supported in part by the Department of Energy Great Lakes Bioenergy Research Center (Office of Science DE-FC02-07ER64494); startup funds provided by the University of Arkansas; the Arkansas Biosciences Institute (Arkansas Settlement Proceeds Act of 2000); and by the Clinical and Translational Science Award program, through the National Institutes of Health National Center for Advancing Translational Sciences, grant UL1TR000427.
Footnotes
Supporting information is available online at http://www.genetics.org/lookup/suppl/doi:10.1534/genetics.114.167429/-/DC1.
Communicating editor: J. Akey
Literature Cited
Lewis, J. A., and A. P. Gasch, 2012 Natural variation in the yeast glucose-signaling network reveals a new role for the Mig3p transcription factor. G3 (Bethesda) 2: 1607–1612.
