


Abstract
A phenomenon that strongly influences the demography of small introduced populations and thereby potentially their genetic diversity is the demographic Allee effect, a reduction in population growth rates at small population sizes. We take a stochastic modeling approach to investigate levels of genetic diversity in populations that successfully overcame either a strong Allee effect, in which populations smaller than a certain critical size are expected to decline, or a weak Allee effect, in which the population growth rate is reduced at small sizes but not negative. Our results indicate that compared to successful populations without an Allee effect, successful populations with a strong Allee effect tend to (1) derive from larger founder population sizes and thus have a higher initial amount of genetic variation, (2) spend fewer generations at small population sizes where genetic drift is particularly strong, and (3) spend more time around the critical population size and thus experience more genetic drift there. In the case of multiple introduction events, there is an additional increase in diversity because Allee-effect populations tend to derive from a larger number of introduction events than other populations. Altogether, a strong Allee effect can either increase or decrease genetic diversity, depending on the average founder population size. By contrast, a weak Allee effect tends to decrease genetic diversity across the entire range of founder population sizes. Finally, we show that it is possible in principle to infer critical population sizes from genetic data, although this would require information from many independently introduced populations.
THE amount of genetic diversity in a recently established population is strongly shaped by its early history: While the founder population size determines the amount of genetic variation imported from the source population, the population sizes in the following generations influence how much of this variation is maintained and how much is lost through genetic drift. A phenomenon that strongly affects the early history is the demographic Allee effect, a reduction in the average per-capita growth rate in small populations (Stephens et al. 1999; Fauvergue et al. 2012). Allee effects have been detected in species from many different taxonomic groups (Kramer et al. 2009). Apart from cooperation between individuals, the study subject of the effect’s eponym (Allee 1931), they can result from a variety of other mechanisms such as difficulties in finding mating partners, increased predation pressure in small populations, inbreeding depression, or biased dispersal toward large populations (Stephens et al. 1999; Kramer et al. 2009). In this study, we investigate the population genetic consequences of two kinds of demographic Allee effect: Our main focus is on the strong demographic Allee effect, in which the average per-capita growth rate is negative for populations smaller than a certain critical population size, but we also consider the weak demographic Allee effect in which the average per-capita growth rate is reduced, but still positive at small population sizes (Taylor and Hastings 2005).
Another important process shaping the dynamics of small introduced populations is demographic stochasticity: fluctuations in population size due to randomness in the number of birth and death events and in sex ratio (see, e.g., Shaffer 1981; Simberloff 2009). On the one hand, demographic stochasticity—in this case a random excess in birth events—implies that even populations with a strong Allee effect starting out below the critical threshold have a positive probability of overcoming the Allee effect and persisting in the long term. On the other hand, demographic stochasticity can lead to population declines or even extinctions in populations without an Allee effect or with a weak Allee effect. Note, however, that demographic stochasticity itself does not fulfill our definition of an Allee effect, because it does not influence the average per-capita growth rate of the population (see Dennis 2002, for a comprehensive discussion of the interaction between demographic stochasticity and Allee effects).
If a species is subject to an Allee effect, particularly if the Allee effect is strong, the success probability for any particular small population may be very low. Nevertheless, it may be quite common to see populations that have established in this way. The reason is that with more and more transport of goods around the world, many species are introduced to a location not just once, but again and again at different time points. Eventually, a random excess in the number of birth events may cause one of these small introduced populations to grow exceptionally fast, surpass the critical population size, and become permanently established. Whereas most failed introductions pass unnoticed, the rare successful populations can be detected and sampled. As invasive species, some of them may have substantial impacts on native communities and ecosystems.
Our main question in this study is how expected levels of genetic diversity differ between successful populations that either did or did not have to overcome an Allee effect. Answering this question would help us to understand the ecology and evolution of introduced and invasive populations in several ways. On the one hand, the amount of genetic variation is an indicator for how well an introduced population can adapt to the environmental conditions encountered at the new location. Therefore, the Allee effect—if it influences genetic diversity—could shape the long-term success and impact even of those populations that are successful in overcoming it.
On the other hand, it is still unclear how important Allee effects are in natural populations, whether weak or strong Allee effects are more common, and how large critical population sizes typically are (Gregory et al. 2010). Quantifying Allee effects based on ecological data only is challenging because it is difficult to observe and sample small populations (Kramer et al. 2009) and because stochasticity reduces the power of such analyses and can even lead to biases in the quantification of density dependence (Courchamp et al. 2008). Genetic data may help with such inference problems because through the influence of genetic drift they can give us information on the dynamics of a population at a time when it was still small, even if we have not sampled or even detected the population at that time. Information on the critical population size could be very valuable in practice. Assume for example that a certain invasive species has already successfully colonized many patches in a landscape, but not all of them. Then estimates of the Allee effect parameters obtained from the colonized patches could indicate how much the introduction rate to unoccupied patches should be controlled to prevent their colonization. On the other hand, estimates of the critical population size could help to determine minimum release rates for organisms whose establishment is desired, for example, in biological control or for species reintroductions (Deredec and Courchamp 2007).
Furthermore, an important task in statistical population genetics is to reconstruct the demographic history of a population and to infer parameters such as founder population sizes, times since the split of two populations, or migration rates. Should the Allee effect have long-lasting effects on patterns of genetic diversity in established populations, it would have to be taken into account in such analyses.
To our knowledge, there have not been any empirical studies on the population genetic consequences of the Allee effect and the few theory-based results are pointing in different directions. There are arguments suggesting that a strong Allee effect may lead to an increase in genetic diversity and others that suggest a decrease. An increase in genetic diversity due to the Allee effect is predicted for populations that expand their range in a continuous habitat (Hallatschek and Nelson 2008; Roques et al. 2012). In the absence of an Allee effect, mostly alleles in individuals at the colonization front are propagated. Under an Allee effect, the growth rate of individuals at the low-density front is reduced and more individuals from the bulk of the population get a chance to contribute their alleles to the expanding population. This leads to higher levels of local genetic diversity and weaker spatial genetic structure. A similar effect has been discussed in the spatially discrete case: Kramer and Sarnelle (2008) argued that without an Allee effect even the smallest founder populations would be able to grow, leading to populations with very little genetic diversity. A strong Allee effect, they conclude, sets a lower limit to feasible founder population sizes and thus does not allow for extreme bottlenecks.
The Allee effect is not just a threshold phenomenon. It not only influences whether or not a population will eventually reach a certain high population size, for example half the carrying capacity, but also how fast this happens. The genetic consequences of this change in population dynamics have not been explored theoretically. However, it is often stated that the Allee effect can lead to time lags in population growth (Drake and Lodge 2006; Simberloff 2009; McCormick et al. 2010), i.e., initial population growth rates that are small compared to growth rates attained later (Crooks 2005). Such time lags follow almost directly from the definition of the Allee effect and would imply an increased opportunity for genetic drift and thus a reduction in genetic diversity. However, it is not clear whether time lags are still present if we consider the subset of populations that is successful in overcoming the Allee effect. It is also unknown how the genetic consequences resulting from the change in population dynamics interact with those of the threshold phenomenon studied by Kramer and Sarnelle (2008).
In this study, we propose and analyze stochastic models to elucidate and disentangle the various ways in which the Allee effect shapes expected levels of neutral genetic diversity. Furthermore, we investigate under what conditions genetic diversity would overall be lower or higher compared to populations without an Allee effect. First, we compare successful populations with and without an Allee effect with respect to two aspects of their demography: the distribution of their founder population sizes, i.e., the distribution of founder population sizes conditioned on success, and the subsequent population dynamics, also conditioned on success and meant to include both deterministic and stochastic aspects. In a second step, we then consider what proportion of neutral genetic variation from the source population is maintained under such a demography. Focusing throughout on introductions to discrete locations rather than spread in a spatially continuous habitat, we first consider the case of a single founding event and then the case of multiple introductions at different time points. Finally, we explore whether the genetic consequences of the strong demographic Allee effect could be employed to estimate the critical population size from genetic data.
Model
Depending on the values of the parameters a and c, Equation 1 can represent population dynamics with either a strong or a weak demographic Allee effect or without an Allee effect. With a > 0 and c ≥ 0, we obtain a strong demographic Allee effect: The average per-capita number of surviving offspring per individual λ(Nt) is smaller than one for population sizes below the critical population size a and above the carrying capacity k1 and greater than one between critical population size and carrying capacity (Figure 1). With a ≤ 0 and c > |a|, we obtain a weak demographic Allee effect, where the average per-capita number of surviving offspring is increasing with population size at small population sizes, but is above one for all population sizes below carrying capacity. Finally, with a = c = 0, we obtain a population model without an Allee effect, namely a stochastic version of the Ricker model (see, e.g., de Vries et al. 2006). Its deterministic counterpart can exhibit stable oscillations or chaotic behavior for large values of r, but here we consider only values of r between 0 and 2, where k1 is a locally stable fixed point (de Vries et al. 2006, p. 29). In most of our analyses, we use a = 50 and c = 0 for populations with a strong Allee effect and a = 0 and c = 30 for populations with a weak Allee effect, and a carrying capacity k1 = 1000 (see Figure 1).
![The expected number of surviving offspring per individual [λ(n), see Equation (1)] as a function of the current population size n without an Allee effect (a = c = 0, gray line), under a weak Allee effect (a = 0, c = 30, dashed black line), or under a strong Allee effect (a = 50, c = 0, solid black line). The dotted vertical line indicates the critical population size under the strong Allee effect. k1 = 1000, r = 0.1.](https://oup.silverchair-cdn.com/oup/backfile/Content_public/Journal/genetics/198/1/10.1534_genetics.114.167551/14/m_299fig1.jpeg?Expires=1716318781&Signature=iD3ZlpzLgHSA4UYCWdvqqFlyjLqLvqr68TUD1pTJ5OjidgcbImKoZZ2YAiVJUB2KRPnUaMOV~eaDwmaWg00w2UA6xgS1CCLKGU35JoHmd8-oxNKNxwLa8lsYK6pnYttvsehBcSHs8aSOCRIhQkrZBbcj70HUYH5SCPB2euSEYjNDcquWs-~yuOgNjkToB-0hnR0aC3FoRAim0TEL-xL6mEGU5cDbFDIJW02f9TvQPqwmx3conJ9cdZkS~oIw8ywWSiYQBk11C0e10ltUNSawOfatnNM5ogHpO3ZgSRwr7-xRB3nbjGPG1v6q5cVPNWg9cxv5t4y-viT9BXx8vPhJlA__&Key-Pair-Id=APKAIE5G5CRDK6RD3PGA)
The expected number of surviving offspring per individual [λ(n), see Equation (1)] as a function of the current population size n without an Allee effect (a = c = 0, gray line), under a weak Allee effect (a = 0, c = 30, dashed black line), or under a strong Allee effect (a = 50, c = 0, solid black line). The dotted vertical line indicates the critical population size under the strong Allee effect. k1 = 1000, r = 0.1.
We follow the population-size trajectory until the population either goes extinct (unsuccessful population) or reaches target population size z = 100 (successful population). When a successful population reaches size z, we sample ns individuals from the population and trace their ancestry backward in time (the details of the genetic simulations are explained below). This allows us to quantify the proportion of genetic variation from the source population that is maintained in the newly founded population. For this, we assume that the source population has a constant effective population size k0 = 10,000. The impact of the Allee effect as well as the strength of genetic drift and random population-size fluctuations decline with increasing population size. Therefore, the first part of the population-size trajectory when the new population is still small is most relevant for our understanding of the genetic consequences of the Allee effect and the particular choice of z and k1 should have little influence on the results as long as they are sufficiently large relative to a and c. We did not choose a higher target size z because with larger values for z the matrix computations underlying the analyses described below require more and more time and memory.
The assumption that each population goes back to a single founding event and then either goes extinct or reaches the target population size z is justified as long as introduction events are rare. Then the fate of a population introduced in one event is usually decided before the respective next event. However, many species are introduced to the same location very frequently (Simberloff 2009). Therefore, we also consider a scenario with multiple introduction events: In each generation, an introduction event occurs with probability pintro, each time involving nintro individuals. We considered a population successful and sampled it if it had a population size of at least z after the first 200 generations. We fixed the number of generations rather than sampling the population upon reaching z as before, because this would introduce a bias: Populations that would take longer to reach z would be likely to receive more introduction events and thus have higher levels of diversity. With a fixed number of 200 generations and our default choice of migration probability pintro = 0.05, all populations receive on average 10 introduction events. All other parameters were unchanged compared to the case with just one founding event.
Methods
Our simulation approach consists of two stages: First, we simulated a successful population-size trajectory forward in time and, conditioned on this trajectory, we then simulated sample genealogies backward in time to quantify genetic diversity. A similar forward–backward approach, but for a deterministic model for the local population dynamics, is used in the program SPLATCHE (Currat et al. 2004). An alternative approach would be to use an individual-based model and jointly simulate demography and genetics forward in time. Everything else being equal, the two approaches should yield the same results, but our approach is computationally more efficient because we do not need to keep track of the genotypes of all individuals in the population at all times.
To quantify genetic diversity of successful populations, we first drew a founder population size N0 from the success-conditioned distribution of founder population sizes and then used the success-conditioned transition probabilities to simulate the remainder of the population-size trajectory Note that under this success-conditioned process populations cannot go extinct. Given the trajectory, we then simulated the genealogies of a sample of ns = 20 individuals genotyped at both copies of nl = 20 freely recombining loci. We constructed the genealogies by tracing the sampled lineages back to their most recent common ancestor. The most common framework for simulating neutral sample genealogies backward in time is the standard coalescent and its extension with recombination, the ancestral recombination graph (see, e.g., Griffiths 1991; Griffiths and Marjoram 1997; Wakeley 2009). Within this framework, changes in population size are allowed, but the population should remain large at all times such that multiple coalescent events per generation (simultaneous mergers) or coalescent events with more than two lineages (multiple mergers) can be neglected. Since the populations in our model can become very small, we did not make this simplifying assumption and allowed for multiple and simultaneous mergers. Because the newly founded population can change size in every generation, one other particularity of our approach is that we go backward in time generation by generation, at least as long as there are genetic lineages in the new population. As in a standard diploid Wright–Fisher model, our simulations are based on the assumption that each individual in the offspring generation is formed by drawing two parents independently and with replacement from the parent population. Equivalently, we could assume that each individual is the mother of a Poisson-distributed number of offspring with mean λ(Nt) and that the father of each offspring individual is drawn independently and with replacement from the population. The details of the algorithm are explained in File S2.
For each simulation run, we stored the average pairwise coalescence time G2 between sampled chromosomes. To quantify the amount of genetic variation from the source population that is maintained in the newly founded population, we divided G2 by 2k0, the expected coalescence time for two lineages sampled from the source population. Under the infinite-sites model, and approximately also in a situation with many biallelic loci of low mutation rate, the expected number of polymorphic sites observed in a sample is proportional to the length of the genealogy and we can take G2/(2k0) as a measure for the proportion of genetic variation from the source population that is maintained in the newly founded population.
Focusing on populations with a strong demographic Allee effect and assuming all other parameters to be known (the carrying capacity, the growth rate parameter, and the mean of the founder size distribution), we explored under what conditions the critical population size a can be estimated from genetic data of successful populations. Because population-size trajectories and genealogies are highly stochastic, we expect the quality of parameter inference to improve if we have multiple replicate successful populations, for example from different locations with the same critical population size. Therefore, we performed our analysis with different numbers of locations, ranging from 10 to 200. In each case, we generated 1000 pseudoobserved genetic data sets whose critical population sizes were drawn from a uniform distribution on [0, 100]. We then attempted to recover these values, using approximate Bayesian computation (ABC), a flexible statistical framework for simulation-based parameter estimation (Beaumont 2010; Csilléry et al. 2010). The detailed methodology of the ABC analyses is described in File S4. In short, we drew 100,000 values for the critical population size from our prior distribution (again the uniform distribution on [0, 100]), simulated a genetic data set for each of them, and then compared the simulated data sets to each of the pseudoobserved data sets with respect to a number of summary statistics. The basic summary statistics in our analysis were the means and variances across loci and locations of the entries of the site-frequency spectrum. Using partial least squares (Mevik and Wehrens 2007), we further condensed these summary statistics into a set of 20 final summary statistics. For each pseudoobserved data set, we took the 1% of parameter values that produced the best match of these summary statistics and—after a linear regression adjustment (Beaumont et al. 2002)—took them as an approximate posterior distribution for the critical population size. We used the mean of this distribution as our point estimator and compared it to the true parameter value underlying the respective pseudoobserved data set.
We implemented all simulations in C++ (Stoustrup 1997), compiled using the g++ compiler (version 4.9.0, http://gcc.gnu.org/), and relied on the boost library (version 1.55, http://www.boost.org/) for random number generation. We used R (R Core Team 2014, version 3.1.0) for all other numerical computations and for data analysis. The source code for all analyses is given in File S7.
Results
Success probabilities
The relationship between the founder population size N0 and the success probability Pr(Tz < T0 | N0 = i) differs qualitatively between populations with a strong Allee effect on the one hand and populations with a weak or no Allee effect on the other hand (see Figure 2 and Dennis 2002). Under a strong Allee effect, the success probability is overall lower, even above the critical population size, and has a sigmoid shape with a sharp increase and inflection point around the critical size. In the other two cases, the success probability increases steeply from the beginning and there is no inflection point.
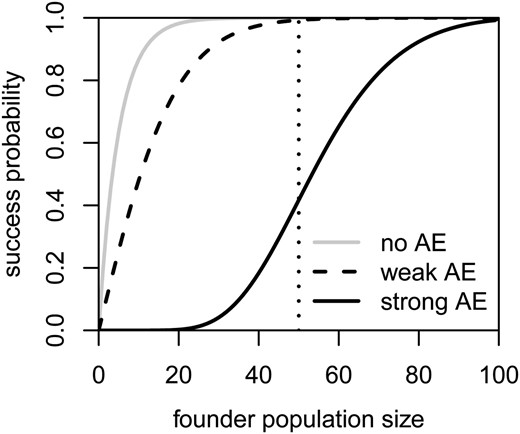
Success probabilities Pr(T100 < T0) without an Allee effect (gray line), under a weak Allee effect (dashed black line), or under a strong Allee effect (solid black line). All parameter values are as in Figure 1. The dotted vertical line indicates the critical population size under the strong Allee effect.
Shift toward larger founder sizes
To compare the demography of successful populations with and without an Allee effect, we first examine the distribution of their founder population sizes. Because success probability increases with founder population size (see Figure 2), the success-conditioned distributions are shifted toward larger founder population sizes compared to the original distribution. Without an Allee effect or with a weak Allee effect, this shift is barely noticeable (Figure 3, A–C). Under a strong Allee effect, we observe a strong shift toward larger founder population sizes if the mean of the original distribution is small compared to the critical population size (Figure 3A). As the mean founder size approaches the critical population size and a larger proportion of populations are successful (see Figure 2), the shift becomes smaller (Figure 3, B and C).
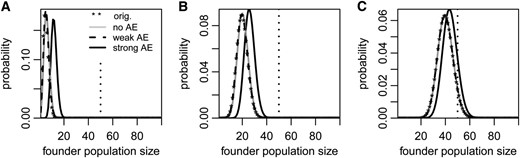
(A–C) Success-conditioned distributions of founder population sizes with a strong (solid black lines) or a weak (dashed black lines) Allee effect or without an Allee effect (gray lines). The original distribution (stars) is Poisson with mean 5 (A), 20 (B), or 40 (C) and is almost indistinguishable from the conditioned distributions without an Allee effect or with a weak Allee effect in B and C. The dotted vertical line indicates the critical size for populations with a strong Allee effect. Note the differences in the scale of the y-axes. All parameter values are as in Figure 1.
Dynamics of successful populations
To examine how Allee effects influence the postintroduction size trajectories of successful populations, we computed the expected number of generations that successful populations without an Allee effect or with either a weak or strong Allee effect have spent at different population sizes between 1 and z − 1 before reaching the target population size z. In this analysis, the founder population size is not drawn from a Poisson distribution, but fixed to the same value for all population types. We find that upon reaching the target population size, successful populations with a strong Allee effect have spent more generations at larger population sizes than successful populations with either a weak or no Allee effect (Figure 4). But they have spent fewer generations at small population sizes, particularly if the founder population size is small compared to the critical population size (Figure 4, A and B). Since the average population with a strong Allee effect declines at small population sizes (see Figure 1), those populations that successfully overcome the critical population size must have grown very fast in this population-size range. In other words, the successful subset of populations with a strong Allee effect is a biased sample from all such populations, biased toward very high growth rates at small population sizes. By contrast, populations with a weak Allee effect have spent more time across the entire range of population sizes than populations without an Allee effect. These patterns are consistent with results for the expected per-capita number of offspring in successful populations (Figure S1 in File S1).
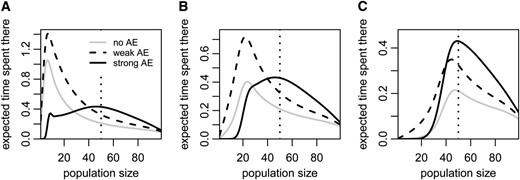
(A–C) The expected number of generations that successful populations spend at each of the population sizes from 0 to z − 1 before reaching population size z (here 100). The initial population sizes are 5 (A), 20 (B), and 40 (C). The gray lines represent population dynamics conditioned on success in the absence of an Allee effect, whereas the dashed and solid black lines represent the conditioned population dynamics with a weak or strong Allee effect, respectively. The small peak in the solid black line in A and the kink in the solid black line in B are due to the fact that the population necessarily spends some time around its founder population size. The dotted vertical line indicates the critical population size under the strong Allee effect. Note the differences in the scale of the y-axes. All parameter values are as in Figure 1.
Population genetic consequences
In this section, we quantify the population genetic consequences of the Allee effect as the expected proportion of genetic variation from the source population that is maintained by the newly founded population when it reaches size z. In the previous sections, we have seen two ways in which the Allee effect modifies the demography of successful populations: (1) It shifts the distribution of founder population sizes and (2) for a fixed founder population size, it affects the success-conditioned population dynamics, i.e., the time a population spends in different size ranges. Both of these features will have an effect on the amount of genetic diversity maintained by successful populations, in the first case because larger founder populations bring more genetic variation from the source population and in the second case because the population dynamics after the introduction influence how much genetic drift the population experiences. To disentangle the contributions of these two effects to the overall genetic consequences of the Allee effect, we compare four sets of successful populations in Figure 5: Populations represented by dashed lines have a founder population size drawn from the success-conditioned distribution without an Allee effect, whereas populations represented by solid lines have founder population sizes drawn from the respective Allee-effect distribution (strong in Figure 5, A–C, and weak in Figure 5, D–F). Populations represented by black lines in Figure 5 follow the success-conditioned population dynamics with an Allee effect, whereas populations represented by gray lines follow the success-conditioned population dynamics without an Allee effect. We repeat the whole analysis for three different values of the growth rate parameter r (Figure 5, A and D, B and E, and C and F) and for populations with either a strong (Figure 5, A–C) or a weak (Figure 5, D–F) demographic Allee effect.
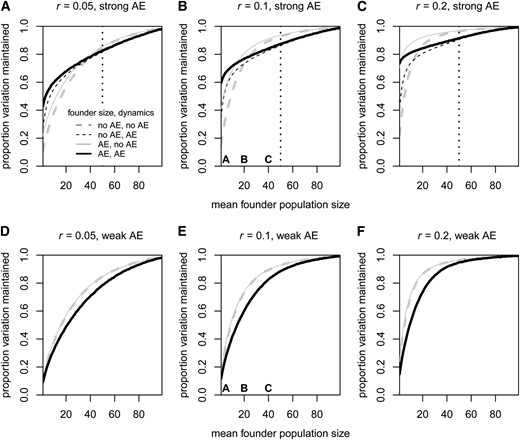
Average proportion of genetic variation from the source population that is maintained by an introduced population upon reaching size z. The plots differ in the value of the growth rate parameter r and in the type of Allee effect. In A–C, Allee-effect populations have a strong demographic Allee effect with a = 50 (indicated by dotted vertical line) and c = 0. In D–F, Allee-effect populations have a weak Allee effect with a = 0 and c = 30. The values on the x-axes correspond to the mean of the original founder-size distribution. The four sets of populations in each plot serve to disentangle the genetic effects resulting from the shift in founder population sizes and those from the altered postintroduction population dynamics. Dashed lines show scenarios whose founder population sizes were drawn from the success-conditioned distribution without an Allee effect. Solid lines show scenarios whose founder population sizes were drawn from the success-conditioned distribution with an Allee effect (strong in A–C and weak in D–F). Black lines show success-conditioned population dynamics with an Allee effect. Gray lines show success-conditioned population dynamics without an Allee effect. The letters A–C in plots B and E refer to plots A–C in Figure 3 and Figure 4, where we examined for r = 0.1 and the respective (mean) founder population sizes how the Allee effect influences the conditioned distribution of founder population sizes and the conditioned population dynamics. Each point represents the average over 20,000 successful populations. Across all points in the plots, standard errors were between 0.0007 and 0.0019 and standard deviations between 0.106 and 0.264.
There are three comparisons to be made in each plot of Figure 5. Starting with Figure 5B where the growth rate parameter r is the same as in Figures 1–4 and the Allee effect is strong, we first compare populations with the same dynamics but different distributions of founder population sizes (dashed vs. solid gray lines and dashed vs. solid black lines) and observe that those whose founder population size was drawn from the Allee-effect distribution maintained more genetic variation. This increase was strong for small mean founder population sizes and became weaker with increasing mean founder population size, in accordance with the lessening shift in the conditioned distribution of founder population sizes (see Figure 3). Second, among populations that share the conditioned founder-size distribution but differ in their subsequent population dynamics (black dashed vs. gray dashed lines and black solid vs. gray solid lines), those with Allee-effect dynamics maintained more diversity at small founder population sizes, but less diversity for large founder population sizes.
Finally, the biologically meaningful comparison is between successful populations with a strong demographic Allee effect in both aspects of their demography (Figure 5, black solid lines) and successful populations without any Allee effect (Figure 5, gray dashed lines). This comparison reveals the strong and population-size dependent genetic consequences of the strong Allee effect: For small mean population sizes, successful populations with an Allee effect in Figure 5B maintained up to 3.8 times more genetic variation than populations without an Allee effect. For mean population sizes close to the critical population size, on the other hand, Allee populations maintained up to 6.3% less genetic variation. Figure 5, A and C, shows the corresponding results for a smaller and a larger growth rate parameter r, respectively. For all sets of populations, an increase in r leads to an increase in genetic variation, but the strength of this effect varies across founder population sizes and Allee-effect scenarios. For the smaller growth rate parameter, the Allee effect has a positive effect on genetic diversity over a wider range of mean founder population sizes (Figure 5A), whereas for a higher growth rate parameter the Allee effect starts to have a negative effect already at relatively small mean founder population sizes (Figure 5C).
In Figure 5, D–F, we compare populations with a weak Allee effect to populations without an Allee effect. Those with a weak Allee effect maintained less variation for all values of the mean founder population size. Consistent with the coinciding distributions in Figure 3, it matters little whether the founder population size is drawn from the success-conditioned distribution with or without an Allee effect (solid and dashed lines coincide). Thus the difference between populations with and without an Allee effect here is almost entirely due to differences in the success-conditioned population dynamics, i.e., differences in the time spent in different population-size regions.
If we fix the mean founder population size, i.e., the parameter for the Poisson distribution of founder population sizes, and instead vary the critical population size a for populations with a strong Allee effect, we observe that for small average founder sizes the proportion of genetic variation maintained increases nonlinearly but monotonically with the critical population size (Figure 6). For larger average founder sizes, however, genetic diversity first decreases with increasing critical population size, reaches a minimum around the average founder population size, and then increases as the critical population size further increases. The results in Figure 5 and Figure 6 are based on average pairwise coalescence times, a measure related to the average number of pairwise differences in a sample. Results based on the average total length of genealogies were qualitatively similar (see File S3).
![The role of the critical population size a for the average proportion of genetic variation from the source population that is maintained by an introduced population upon reaching size z = 100. The mean founder population size E[N0] is held fixed at a different value for each of the four curves. Each point represents the average over 20,000 successful populations. Standard deviations were between 0.108 and 0.233 and standard errors between 0.0007 and 0.0017. c = 0, r = 0.1.](https://oup.silverchair-cdn.com/oup/backfile/Content_public/Journal/genetics/198/1/10.1534_genetics.114.167551/14/m_299fig6.jpeg?Expires=1716318781&Signature=EHsAnSbhtn~CKktw5fGZ9EFnT4adXKvvJGjo-L3OqYODY7ZsSPXlopmbqd~fAGB-auxoWgy-1DxXe4g9ABHvD4iah2ZH01Xf5u6IIBFXh4tUDY9YcsDN3lgpEEoylVRHjsg2-6uDYMhiOJAIJmpqvAPBFcON2nZV2YIx-mmCte-qXfw88AxyicU0KL4sq084lp3MxkrViNVVMzyEnUyeAp2~kzA9BWbJ5FGjeus7bhfsH9MLJcL8ieK~JjtkPKTIEq1JnTViEKzPi3mTPycBn929awzOWcheuQjGZwwZlyHPwzytQ2vK8SwjanMUrPAOQTfIKeJSGeLpYoOG5q~wrw__&Key-Pair-Id=APKAIE5G5CRDK6RD3PGA)
The role of the critical population size a for the average proportion of genetic variation from the source population that is maintained by an introduced population upon reaching size z = 100. The mean founder population size E[N0] is held fixed at a different value for each of the four curves. Each point represents the average over 20,000 successful populations. Standard deviations were between 0.108 and 0.233 and standard errors between 0.0007 and 0.0017. c = 0, r = 0.1.
Multiple introductions
In the case of multiple introductions, levels of genetic diversity differed little between populations with a weak Allee effect and populations without an Allee effect. By comparison, populations with a strong Allee effect maintained a larger proportion of genetic variation, at least if the number of individuals introduced per event was smaller than the critical population size (Figure 7A). In this parameter range, successful populations with a strong Allee effect had received more introduction events than other successful populations (Figure 7B). Since in the case of multiple migrations the population can go temporarily extinct, not all introduction events necessarily contribute to the genetic diversity in the sample. However, for small founder population sizes, lineages sampled from an Allee-effect population also had a smaller probability to trace back to the same introduction event than lineages sampled from other populations (Figure 7C). If a single introduction event was sufficient to overcome the critical population size, there was no notable difference between populations with and without an Allee effect, either in the amount of genetic variation maintained or in the number of introduction events they received.
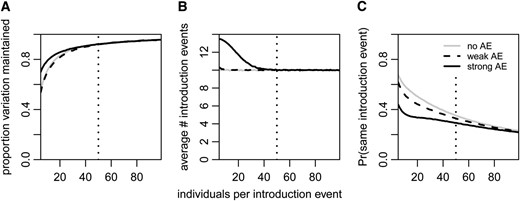
Genetic consequences of the Allee effect in the case of multiple introduction events. (A) Proportion of variation maintained by populations with a strong or weak Allee effect (solid and dashed black lines, respectively) or without an Allee effect (gray lines). Standard deviations were between 0.220 and 0.227 and standard errors between 0.0015 and 0.0017. (B) Average number of introduction events that happened in successful simulation runs. Across all runs (successful and unsuccessful taken together), the number of introduction events was binomially distributed with parameters n = 200 (the number of generations) and pintro = 0.05 (the migration probability per generation). (C) Probability that two lineages in the sample trace back to the same introduction event. Each point represents the average over 20,000 successful populations. Populations with a strong Allee effect had a critical population size of 50, indicated by a dotted vertical line. All other parameter values are as in Figure 1.
Estimating the critical population size from genetic data
The results in the previous sections have shown that the Allee effect can have substantial impact on the expected amount of genetic variation in a recently founded population. However, due to stochasticity in the population dynamics and genetics, the associated standard deviations are so large that there always is considerable overlap between the underlying distributions with and without an Allee effect. Consistent with this observation, the results of our approximate Bayesian computation analysis show that it is indeed possible to obtain reasonably accurate estimates of the critical population size, but only if we have information from many, ideally hundreds, of populations that have independently colonized a number of ecologically similar locations (Figure 8 and Figure S6 in File S4).
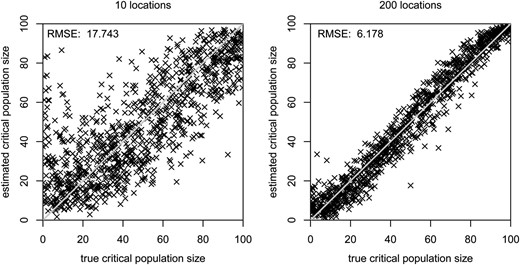
Estimated vs. true values of the critical population size for either 10 or 200 independent locations. On the diagonal gray line, the estimated critical population size is equal to the true one. The value in the top left corner of each plot is the root mean squared error (RMSE) across the 1000 data sets.
Discussion
Our results indicate that an Allee effect can strongly influence the expected amount of genetic diversity in a population that recently established from a small founder population size. In the case of a single introduction event and a strong Allee effect, we can attribute this influence to the joint action of three mechanisms:
Compared to other successfully established populations, those that have overcome a strong demographic Allee effect tend to derive from larger founder populations and hence start on average with more genetic diversity.
To successfully overcome the critical population size, small populations with a strong Allee effect must grow very fast initially. Therefore, they spend fewer generations in the range of population sizes where genetic drift is strongest, which leads to an increase in genetic diversity relative to populations without an Allee effect or with a weak Allee effect.
Successful populations with a strong Allee effect experience a time lag in population growth around and above the critical population size, leading to increased opportunity for genetic drift and thus a negative effect on genetic diversity. Successful populations with a weak Allee effect experience this time lag over the entire range of population sizes.
Taken together, the second and third mechanism suggest a peculiar relationship between the original population growth rate and the growth rate among successful populations, i.e., the success-conditioned growth rate: For a fixed initial population size, successful populations that are originally expected to decline rapidly (populations with a strong Allee effect substantially below the critical size) grow the fastest, followed by those populations that are expected to increase moderately (populations without an Allee effect). The slowest-growing populations are those that are expected to weakly increase or decrease (Allee-effect populations around the critical size and populations with a weak Allee effect). In summary, the per-capita population growth rate conditioned on success (see Figure S1 in File S1) seems to depend more on the absolute value of the original growth rate, (E[Nt+1]/Nt) − 1, than on its sign, a phenomenon that is also present in simpler models (see File S6 for an example from diffusion theory).
Under a weak Allee effect, the shift in founder population sizes (mechanism 1) does not play a large role and the absolute value of the average per-capita growth rate is always smaller than in populations without an Allee effect. Therefore, a weak Allee effect tends to have a negative effect on levels of genetic diversity in successful populations irrespective of the founder population size. The consequences of a strong Allee effect are qualitatively different. As the mean founder population size increases, the two mechanisms leading to an increase in diversity (1 and 2) become weaker, whereas the mechanism leading to a decrease in diversity (3) becomes stronger. Therefore, a strong Allee effect appears to have a positive influence on levels of genetic diversity if typical founder population sizes are small, but a negative effect for large mean founder population sizes. Note that this result and the difference between the genetic consequences of weak and strong Allee effects would still hold qualitatively if we fixed the founder population size such that mechanism 1 could not act.
For a given founder population size, the successful populations that maintain the most variation from the source population are those with a rapid burst of growth away from this founder population size. This requires a high success-conditioned per-capita growth rate at this point, which in turn requires a large absolute value of the per-capita growth rate in the unconditioned process. This can happen in two ways: Either the population is far above the Allee threshold and has a strongly positive average per-capita growth rate or the population is far below the critical population size and has a strongly negative per-capita growth rate (see Figure S1 in File S1). This explains the nonmonotonic relationship between the critical population size and genetic diversity in Figure 6. We can draw two other conclusions from Figure 6: First, even with a small critical population size, a strong Allee effect substantially influences expected levels of genetic diversity in successful populations, at least if the founder population size is also small. Second, the genetic consequences of the Allee effect are not invariant to rescaling population sizes. For example, a strong Allee effect with critical population size 10 has a different effect on populations with founder size 5 than an Allee effect with critical size 50 on populations with founder size 25. This is not surprising since the strength of both genetic drift and demographic stochasticity changes when we multiply population sizes by 2 or any other factor. In the accompanying article in this issue (Wittmann et al. 2014), we investigate such scaling relationships from a broader perspective and derive some qualitative conclusions.
One of the “genetic paradoxa of invasion biology” is that established alien or invasive populations often harbor a surprisingly large amount of genetic diversity relative to their source populations although they should have experienced a bottleneck (Roman and Darling 2007; Simberloff 2009). Multiple introductions from different parts of the native range of the respective species appear to play an important role in resolving this paradox. Our study suggests that also pervasive strong Allee effects could contribute to the high observed diversity levels because they “select” for populations that have a large founder population size, that go back to many introduction events, and that grow particularly fast and therefore give genetic drift relatively little time to act.
As we have seen, the genetic consequences of the Allee effect can be used to estimate the critical population size from genetic data. We conducted our analysis with infinite-sites data in mind, but with different choices of summary statistics other types of genetic data could also be accommodated. To achieve reasonable accuracy, however, the number of populations should be on the order of 100. While many previous studies on genetic diversity in introduced species have sampled ∼20 populations in the introduced range (see table I in Roman and Darling 2007), we do not know of any study with data from hundreds of introduced populations. Since we found magnitude and direction of the Allee effect’s influence to be very context dependent, it would also be important to know the other demographic parameters fairly well to be able to infer the critical population size from genetic data. It could also be worthwhile to perform a joint analysis, combining genetic data with relevant ecological information, e.g., on propagule pressure and establishment success (Leung et al. 2004). As demonstrated by previous studies that addressed other questions in invasion biology with a combination of genetic and ecological data (e.g., Estoup et al. 2010), ABC provides a flexible statistical framework for such a task.
Even if it is difficult to detect an Allee effect in genetic data from a single population, neglecting its presence might affect the inference of other demographic parameters such as founder population size, growth rate, and time since the founding event. We explored this possibility in File S5. Neglecting an Allee effect led to higher errors in our inference of the founder population size but had no detectable influence on our estimation of the growth parameter and the time since the founding event. We also investigated the effect of neglecting stochasticity and found that this reduced the quality of the parameter estimation at least as much as neglecting an Allee effect.
Stochastic population models such as the one in this study are not only characterized by their average behavior, but also characterized by the stochastic variability among outcomes. This seems to be particularly important for the genetic consequences of the Allee effect because of several reasons. First, the successful establishment of populations whose size is initially below the critical population size would not be possible in a deterministic model; it requires at least some variability. Second, the extent to which the population dynamics conditioned on success can deviate from the original population dynamics should also depend on the amount of variability. Third, even for a given demographic history, the amount of genetic drift depends on one source of variability, namely that in offspring number among individuals. In this study, we have worked with the standard assumption of Poisson-distributed offspring numbers. However, there is evidence that many natural populations do not conform to this assumption (Kendall and Wittmann 2010). Especially in small populations with an Allee effect, we would expect more variation in offspring number because many individuals do not encounter a mating partner (Kramer et al. 2009), whereas those that do can exploit abundant resources and produce a large number of offspring. In our accompanying article (Wittmann et al. 2014), we therefore investigate how the genetic consequences of the Allee effect depend on the distribution of the number of offspring produced by individuals or families, one source of demographic stochasticity.
In this study we have implicitly already manipulated variability: by changing the growth parameter r. We have seen that a strong Allee effect has a larger potential to promote genetic diversity when the growth rate parameter r is small. Under these conditions, demographic stochasticity is large relative to the deterministic trend and this causes the Allee effect to speed up population growth over a larger range of population sizes (see Figure S1 in File S1). In Wittmann et al. (2014), we revisit this finding and develop a more general understanding of how the population genetic consequences of the Allee effect depend on the balance between deterministic and stochastic forces in the population dynamics on the one hand and genetic drift on the other hand.
Acknowledgments
We thank Raphael Gollnisch and Shankari Subramaniam for assistance with simulations, Pablo Duchén for sharing ABC scripts, and Lindi Wahl and two anonymous reviewers for helpful comments on the manuscript. M.J.W. is grateful for a scholarship from the Studienstiftung des deutschen Volkes. D.M. and M.J.W. acknowledge partial support from the German Research Foundation (Deutsche Forschungsgemeinschaft), within the Priority Programme 1590 “Probabilistic Structures in Evolution.”
Note added in proof: See Wittmann et al. 2014 (pp. 311–320) in this issue for a related work.
Footnotes
Supporting information is available online at http://www.genetics.org/lookup/suppl/doi:10.1534/genetics.114.167551/-/DC1.
Communicating editor: L. M. Wahl
Literature Cited
Courchamp, F., L. Berec, and J. Gascoigne, 2008 Allee Effects in Ecology and Conservation, Vol. 36. Cambridge University Press, Cambriddge, UK/London/New York.
Griffiths, R. C., 1991 The two-locus ancestral graph, pp. 100–117 in Selected Proceedings of the Sheffield Symposium on Applied Probability, edited by I. V. Basawa and R. L. Taylor. Institute of Mathematical Statistics, Hayward, CA.
Pinsky, M., and S. Karlin, 2010 An Introduction to Stochastic Modeling. Academic Press, New York/London/San Diego.
