


Abstract
The population genetic behavior of mutations in sperm genes is theoretically investigated. We modeled the processes at two levels. One is the standard population genetic process, in which the population allele frequencies change generation by generation, depending on the difference in selective advantages. The other is the sperm competition during each genetic transmission from one generation to the next generation. For the sperm competition process, we formulate the situation where a huge number of sperm with alleles A and B, produced by a single heterozygous male, compete to fertilize a single egg. This “minimal model” demonstrates that a very slight difference in sperm performance amounts to quite a large difference between the alleles’ winning probabilities. By incorporating this effect of paternity-sharing sperm competition into the standard population genetic process, we show that fierce sperm competition can enhance the fixation probability of a mutation with a very small phenotypic effect at the single-sperm level, suggesting a contribution of sperm competition to rapid amino acid substitutions in haploid-expressed sperm genes. Considering recent genome-wide demonstrations that a substantial fraction of the mammalian sperm genes are haploid expressed, our model could provide a potential explanation of rapid evolution of sperm genes with a wide variety of functions (as long as they are expressed in the haploid phase). Another advantage of our model is that it is applicable to a wide range of species, irrespective of whether the species is externally fertilizing, polygamous, or monogamous. The theoretical result was applied to mammalian data to estimate the selection intensity on nonsynonymous mutations in sperm genes.
FOR sexual organisms, reproduction is an essential process that allows an individual’s genomic information to survive beyond its lifetime. Years ago, it was thought that the functional constraints on genes involved in reproduction should be as strong as those on functionally important genes such as histones, etc. (e.g., Miyata and Yasunaga 1980; Li 1997); hence it was predicted that such genes should evolve much more slowly than average. Therefore, it was a surprise when the first molecular evolutionary analyses on reproduction-related genes (or proteins) revealed their faster than normal evolutionary rates (see, e.g., Swanson et al. 2001; Swanson and Vacquier 2002a,b). Since then, analyses of additional reproductive genes in additional species continue to support the initial observation that reproductive genes evolve more rapidly than the genomic average (e.g., Cutter and Ward 2005; Clark et al. 2006, 2009; Ramm et al. 2008; Turner and Hoekstra 2008; Findlay and Swanson 2010; Wong 2011). A common and particularly typical pattern for reproductive genes is a higher ratio, often denoted as dN/dS (= ω), of the number of nonsynonymous nucleotide substitutions per nonsynonymous site (dN) to the number of synonymous nucleotide substitutions per synonymous site (dS). This pattern seems to be particularly remarkable among “sperm genes”, namely, genes whose protein products are found in sperm (e.g., Wyckoff et al. 2000; Torgerson et al. 2002; Swanson et al. 2003; Nielsen et al. 2005; Artieri et al. 2008; Dorus et al. 2010). When dN/dS is computed for the entire coding region of a gene, we call it a “gene-wide” dN/dS value. Sperm genes usually show higher gene-wide dN/dS values than the average over all genes in the genome. Furthermore, sperm genes commonly have local regions (or domains) whose dN/dS values significantly exceed 1.
There are a variety of potential explanations for this observation. Some of them are not suitable to explain the general trend that a wide variety of sperm genes exhibit high dN/dS values in various species. For example, (i) relaxation of selective constraints could account for elevated gene-wide dN/dS values (Swanson and Vacquier 2002a), but does not explain the common observation that many genes have local regions with dN/dS ≫ 1 (e.g., Ramm et al. 2008; Dorus et al. 2010; Wong 2011); (ii) defense against pathogens could explain the elevated dN/dS values in reproductive genes (e.g., Vacquier et al. 1997), but this applies only to genes that are involved in battles against pathogens; and (iii) reinforcement of reproductive incompatibility in a speciation event can also accelerate the evolution of sperm genes (Dobzhansky 1940; Howard 1993), but this works only on special occasions where two closely related sympatric species coexist.
Most other models and hypotheses invoke either postcopulatory sexual selection, namely selection on reproductive genes after mating (reviewed, e.g., in Birkhead and Pizzari 2002; Swanson and Vacquier 2002b; Clark et al. 2006; Turner and Hoekstra 2008), or sexual conflict (e.g., Rice and Holland 1997; Frank 2000; Gavrilets 2000; Chapman et al. 2003; Hayashi et al. 2007). So far, these models have mainly focused on selection and/or competition at the individual level; when they consider a competition among sperm, it is almost always among sperm produced by different males. In these models, competition among sperm from a single male play only a secondary role, if any.
On the contrary, in real life, it is obvious that numerous sperm compete with each other even when a female mates with only a single male during a reproductive period (see, e.g., Parker and Begon 1993; Manning and Chamberlain 1994). For a sperm to successfully fuse with an egg, it has to win a fierce competition with millions to billions of all the others, to be the only “winner”; the remaining 99.999…% of the sperm are destined not to be involved in fertilization. This process is quite complicated and involves many factors. For example, the rate of success depends on how fast it can swim in the right direction and how efficiently it can fuse with the egg. The former process may involve chemotaxis, and the latter may involve egg–sperm compatibility. Therefore, any kind of selection on sperm performance may potentially increase dN/dS values of a wide variety of sperm genes, irrespective of whether the species is externally fertilizing, polygamous, or monogamous.
The main goal of this study is to examine the effects of such competition among paternity-sharing sperm, which, as mentioned above, have almost always been neglected thus far. For this purpose, we here provide a “minimal model” of sperm gene population genetics that incorporates the intrinsic feature of the fertilization process. To be more specific, our minimal model focuses on the competition among sperm introduced by a single mating event with a single male. Even in this case, sperm can have different genotypes; for a single sperm gene, there would be two alleles if the male is heterozygous. With this minimal model, we demonstrate that even a very tiny phenotypic effect of a mutation at the level of a single sperm can amount to a substantial difference between allelic fitnesses at the level of a single inheritance, through fierce competition among millions to billions of sperm per each. This result implies that mutations with very weak effects at the molecular level can be a potential explanation of the widely observed high dN/dS ratios of sperm genes.
Because our theory applies only when each allele affects solely (or preferentially) haploid sperm genomes carrying it, the generality of our theory largely depends on how many sperm genes have haploid expression, namely, are expressed during the haploid phase of the sperm development. It used to be thought that such haploid expression should be very rare because the haploid phase spans only late stages of the sperm development, during which both DNA and cytoplasm are getting compactified (see, e.g., Steger 1999). However, recent genome-wide expression analyses estimated that about several hundreds of sperm genes are haploid expressed in mammals (see, e.g., Joseph and Kirkpatrick 2004). This number is comparable to that of genes examined in each of other proteome-scale analyses of mammalian sperm (see, e.g., Good and Nachman 2005; Dorus et al. 2010). Furthermore, as Good and Nachman (2005) showed, it is among sperm genes expressed after the onset of meiosis, but not among those expressed before it, that high dN/dS regions were found significantly more frequently than the genome average. These results indicate that haploid expression seems to be indeed quite common among sperm genes. If so, the model we propose here could provide an important explanation of rapid evolution of sperm genes with a wide variety of functions, as long as they are haploid expressed.
Theory
Modeling sperm-competition process
In the process of fertilization, selection works in an essentially different way from that assumed in the standard population genetics, in which what usually matters is the number of offspring that mature enough to produce the next offspring. As illustrated in Figure 1A, suppose an autosomal locus with two alleles, A and B, that have different life span distributions. Assuming all else (such as fertility) being equal, selection should favor B because it has a higher possibility to mature and produce offspring.
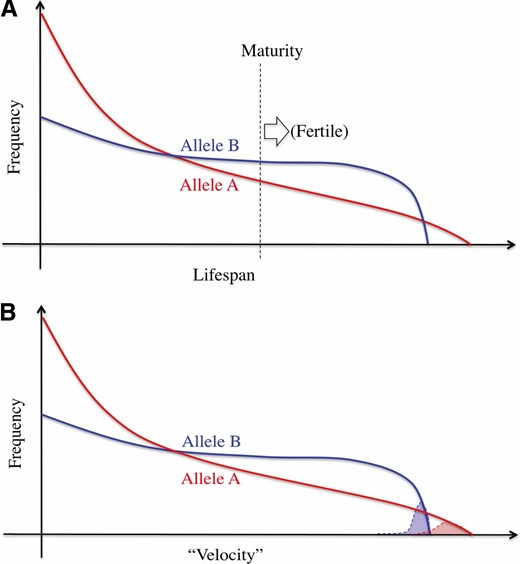
Illustration of how selection works in the standard population genetic framework (A) and in sperm competition (B). See text for details.
In contrast, in the fertilization process, millions to billions of sperm compete for fertilizing an egg (or a handful of eggs), and selection should act on the fertilizing ability of sperm. In Figure 1B, we again consider two alleles at a single autosomal locus, A and B, that have different “velocities” in the direction to the egg. We suppose that sperm swim toward an egg, perhaps in response to pheromone-like chemoattractants. How fast a sperm can reach and fertilize the egg is determined by traits such as responsiveness to pheromone-like chemoattractants, swimming speed, ability to overcome obstacles surrounding the egg, and compatibility with the egg membrane. Here, to measure the performance of a sperm, we consider the total time from ejaculation till the completion of fertilization. Then, we define the velocity of the sperm, or the level of performance in fertilizing the egg, as the reciprocal of the total time, so that a sperm with a larger velocity is more likely to win the race for fertilization.
Sperm competition is usually extremely fierce, where only one (or a handful of) winner(s) among a huge number of competitors can pass on the genome(s) to the next generation, and the remaining 99.999…% of the sperm are eliminated. In this situation, the important factor is the right tail of each velocity distribution (red or blue shade in Figure 1B), to which the “fastest” sperm with each allele likely belongs. Given the distributions in Figure 1B, selection should favor A because it has a better chance to have the winner sperm among all competitors.
This intuitive expectation can be mathematically expressed as follows. Let x be the velocity as defined above. fZ(x) denotes the probability density function (PDF) of x for a single sperm with allele Z (= A or B), and let XZ (Z = A or B) be a random variable following the PDF fZ(x). Then, the probability, P[XZ > x], that a sperm with allele Z has a velocity larger than x is given by: (for Z = A, B).
It is known that in mammals “intercellular bridges” connect four haploid spermatids produced by the meiosis of a single diploid male germline cell (spermatocyte) (e.g., Russell et al. 1990; de Rooji and Russell 2000; Yoshida 2010). Such intercellular bridges are believed to transport gene products among the connected spermatids and therefore could violate our theory’s key assumption that the performance of each sperm is determined by (the gene product of) its own allele. However, the theory works as long as intercellular bridges are imperfect so that there is some difference in the composition of allelic gene products between sperm with different alleles. The only required adjustment is that the PDF of velocity should take account of the effect of intercellular bridges.
In Figure 2, we consider some typical cases where a mutation changes the PDF of the velocity (f(x)): (i) The PDF is exponential and the mutation from B to A increases the mean (Figure 2A), (ii) the PDF is a normal distribution and the mutation increases the mean (Figure 2B), (iii) the PDF is a normal distribution and the mutation increases the variance without changing the mean (Figure 2C), and (iv) the PDF has a finite maximum and the mutation increases the maximum (Figure 2D). As an example of case iv, we consider a power-law function with the exponent α and the maximum xM:
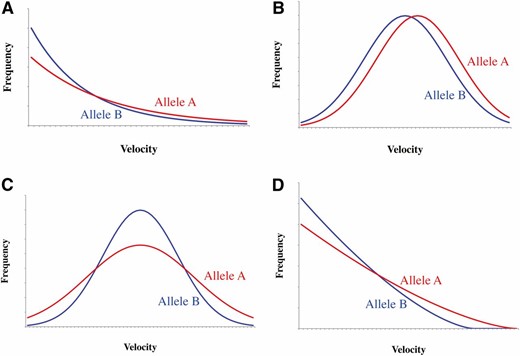
Illustration of typical patterns of mutational changes in the probability density function of the velocity. A, B, C, and D correspond to cases i, ii, iii, and iv, respectively, which are detailed in the text.
, of sperm competitive advantage (ψA) for a range of the half-sperm number (NhSp) compared to that in one-on-one competition. The cyan and green lines represent case i and case ii, respectively. All other lines represent case iv. The cases with α = 1, 2, and 3 are colored red, blue, and purple, respectively.](https://oup.silverchair-cdn.com/oup/backfile/Content_public/Journal/genetics/194/3/10.1534_genetics.113.152066/5/m_709fig3.jpeg?Expires=1716681381&Signature=iXLOldo8PkZjaGh3293MiFUzRhgS7ZM3QRN2pTZlbwE55vXU7W~G4vfkefK33Asbeg8L3iXkwvDoc0THnL63i-1HqnjBDgTJvkBH9Gun49YCNrV2Q7~apdw-5YHrucx2EQifV5dHAeGzihREvAGXwGjuSzt3HtoTqrBMNoMPnStmZhRL803vsLhB9yFjNCW84pMFInogh~VuxkemmS-pOx5Efq9~zB2O-KqLgh38BiY5lUsWK8RBRElhfKeYe1v-cSk6NeonHdehQvVdej5R5vynR4ABw3ycconHcx3K5Xtu7-veEqCKPHyQj3dxa1N3yMo9XVYFtOrfZNe0NLPGMw__&Key-Pair-Id=APKAIE5G5CRDK6RD3PGA)
Enhancement, R[ψA](NhSp), of sperm competitive advantage (ψA) for a range of the half-sperm number (NhSp) compared to that in one-on-one competition. The cyan and green lines represent case i and case ii, respectively. All other lines represent case iv. The cases with α = 1, 2, and 3 are colored red, blue, and purple, respectively.
In all cases, the sperm competitive advantage, ψA, increases as the half-number of sperm, NhSp, increases (Figure 3) (for derivation, refer to Notes 2 and 3 of File S1). For cases i and ii, ψA increases roughly proportionally to the logarithm or its power of the total sperm number (cyan and green lines in Figure 3). In case iv, ψA is roughly proportional to (red, blue, and purple lines in Figure 3), where α is the exponent used in Equation 5. The slope is determined by α. The quantitative difference among cases i, ii, and, iv depends on how the allelic difference in the PDF distributes along the velocity axis, especially near the right tail. Thus, regardless of the PDFs of velocity, Figure 3 shows that the efficacy of selection through a sperm competition increases dramatically with the number of mutually competing sperm.
Case iii is unique among the four cases because the PDFs for the two alleles have the same mean, while there is a difference in the shape of the right tail, which is the part that really matters. The result for this case is not shown in Figure 3 because the competitive advantage is zero in a one-on-one competition. Nevertheless, the competitive advantage is positive when NhSp > 1, and it increases roughly proportionally to ln(NhSp) when NhSp ≫ 1; its asymptotic behavior is quite similar to that of case i. In a sense, this case iii eloquently demonstrates the uniqueness of sperm competition: A mutant allele could gain a big advantage in a competition among numerous sperm even if it has on average no advantage in a one-on-one competition between two sperm with different alleles.
Fixation probability of a mutation
In the previous section, we showed that the advantage of allele A over allele B in sperm competition can be described by a single parameter, ψA, which can be readily incorporated into the basic population genetic framework. We are here interested in how the frequencies of alleles A and B change, from which we can derive the fixation probability of a mutant allele. We assume that A and B are selectively neutral except in sperm competition. In other words, it is assumed that the phenotypic effect at the sperm level determines the fate of the mutation.
Let us consider the expected frequency of allele A at generation t + 1 conditional on the frequency at generation t. We ignore recurrent mutations between them. Here we focus on only “successful competition”, where eggs are successfully fertilized by sperm, because unsuccessful competition does not contribute to the population genetic process. This should be reasonable under the assumption that the overall probability of successful fertilizations is independent of paternal and maternal genotypes. Let P(P)[Z | Z1Z2] denote the probability that a sperm with allele Z (= A or B) wins a successful competition among sperm ejaculated by a male individual with genotype Z1Z2 (Z1, Z2 = A or B). Obviously, for homozygous males, we have P(P)[A | AA] = P(P)[B | BB] = 1, and P(P)[A | BB] = P(P)[B | AA] = 0. For heterozygous males, we can use Equation 3. We also assume that there are as many sperm with allele A as those with allele B; i.e., NA = NB. Note that this simplified assumption should not be used for mutations that directly change the numbers of active sperm with different alleles, such as mutations on Poisson-antidote type genes and apoptosis-related genes (e.g., Da Fonseca et al. 2010).
Then, assuming a very small mutational effect [i.e., δf(x) is small], we have
It should be noted that, in this equation, we set the initial frequency of a mutant following the standard treatment in population genetic theory; that is, a single haploid mutant with frequency p =1/(2N) arises in the population at rate 2Nμ, where μ is the mutation rate per generation per haploid locus. It should not be unreasonable to assume that this also works in sperm genes. There are many cell divisions in a single male individual, and a mutation that occurred in an early stage would result in a large number of sperm having the mutation. Mutations at later stages would occur more frequently but generate fewer mutant sperm each. The probability that the winner is one of such mutant sperm may be affected by selection on the mutation, but this effect should be very small in a single generation. If so, we can approximate the mutation process in a single (male) individual as a random process along a “genealogy” of competing selectively neutral sperm that originates from a single zygote. Then, μ (i.e., the per-generation mutation rate) should be defined as the expected number of mutations from the top (i.e., root) to any tip (i.e., leaf) of the genealogy. This situation is analogous to the typical treatment in the standard theory of population genetics.
It would be intriguing to compare Equation 13 and the fixation probability of a normal adaptive mutation with selective coefficient s; i.e., . The two equations are identical when s = ψA/4 or the effect of the sperm competitive advantage is one-quarter as large as that of the standard additive selective advantage. There are two factors, each contributing one-half independently, that are multiplied together to give this ratio of 1/4. The first factor comes from the assumption that the transmission of alleles through females is selectively neutral. The other factor comes from the fact that competition among paternity-sharing sperm causes a selective bias only through heterozygous males.
Impact of paternity-sharing sperm competition on dN/dS ratios
Next we consider nonsynonymous sites. According to their impacts on the sperm fertilization efficiency, mutations on such sites are classified into three categories, namely, those that are competitively (a) disadvantageous, (b) neutral, and (c) advantageous. Then, roughly speaking, three parameters govern the average fixation probability of nonsynonymous mutations: (i) the proportion, pN, of quite strictly neutral mutations among all nonsynonymous mutations; (ii) the proportion, pCA, of competitively advantageous (CA) mutations; and (iii) the sperm competitive advantage (ψA) that follows a PDF, FCA(ψA), over competitively advantageous mutations. Note that because of the inflation in the competitive (dis)advantage deduced above, even slightly disadvantageous mutations will be immediately removed from the population. Therefore, the proportion of competitively disadvantageous mutations, pCD (= 1 − pN − pCA), contributes only negligibly little, if any, to the dN/dS ratio.
The two colored curves in Figure 4 schematically illustrate the expected dN/dS ratio averaged over CA mutations () as functions of the winning probability, computed by Equation 17, with N = 104 (green line) and N = 105 (cyan line). In all cases, monotonically increases as the winning probability increases and becomes asymptotically proportional to the competitive advantage: . Hence the gradient of the curve depends almost linearly on the population size N.
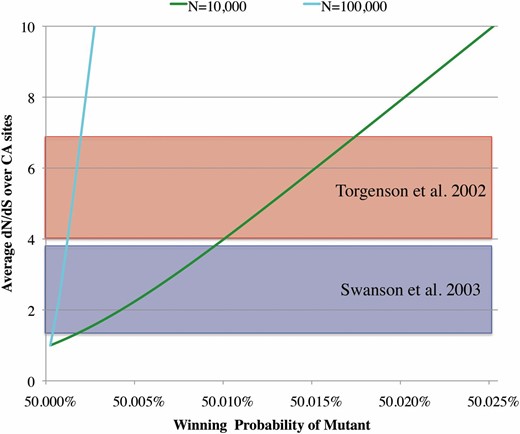
Average dN/dS as a function of the winning probability of a mutant allele. The colored curves show the dependence of on the winning probability () of the mutant allele A, computed from Equation 17. The diploid population size (N) is set to be 10+4 (green line) and 10+5 (cyan line). Red and blue shaded areas represent the ranges of such dN/dS values obtained by Torgerson et al. (2002) and by Swanson et al. (2003), respectively.
Application to data
Equation 16, or its approximation (18), could be used to estimate the intensity of selection on sperm genes or on any subregions within them. As an example, we use mammalian sperm protein genes, for many of which rapid amino acid substitutions have been demonstrated (Wyckoff et al. 2000; Torgerson et al. 2002; Swanson et al. 2003). We use the data in Torgerson et al. (2002) and in Swanson et al. (2003). In their maximum-likelihood analyses, the proportion of codon sites with elevated amino acid substitution rates and the dN/dS value averaged over such sites were inferred for each gene. Both studies compared two models of codon evolution under the framework of Yang et al. (2000). One is a purifying selection model known as “M7”, in which the expected dN/dS is assumed to be beta-distributed between 0 and 1, and the other is a composite selection model known as “M8” that accommodates an additional class of sites with dN/dS > 1 on top of the classes of negatively selected sites as incorporated in M7. It was found that M8 fitted significantly better than M7 for some sperm genes (four genes in Torgerson et al. 2002 and six genes in Swanson et al. 2003), strongly indicating that these genes are likely involved in determining sperm performance. In the class of positively selected sites, estimates of ranged from 4.0 to 6.9 for the former four genes and from 1.3 to 3.9 for the latter six genes (red and blue shaded areas, respectively, in Figure 4).
To estimate the mean winning probability, , corresponding to the above intervals, we use Equation 18. The proportion of advantageous mutations (pCA) is usually unknown although it may not be very large as most mutations should be disadvantageous. Therefore, we conventionally assume pCA = 1, which should provide a possible lower bound of estimates of . Because this assumption of pCA = 1 means that almost all nonsynonymous mutations on the sites of interest are competitively advantageous, it obviously causes an underestimation of . A caveat in understanding this result is that the theory might overestimate the role of positive selection in the haploid phase because it assumes neutrality of mutations in all other phases.
Assuming the population size to be N = 104 (a typical effective population size for humans, from Takahata 1993), we estimated that the winning probability ranged from 50.010% to 50.017% and from 50.0014% to 50.010%, corresponding to that in Torgerson et al. (2002) and Swanson et al. (2003), respectively. As demonstrated in Figure 3, competition among millions to billions of sperm is expected to enhance the effect of a mutation greatly, although the degree of enhancement differs, depending on the PDF of velocity and the type of its change. If we assume case iv with α = 3 as an example, and given NhSp ∼ 108 (an approximate number for humans, from, e.g., Manning and Chamberlain 1994), we predict that the selective advantage at the single-sperm level should be, on average, from 4.7 × 10⁻⁸ to 5.7 × 10⁻⁷. If these values are directly applied, they are equivalent to the population selection intensity, 2Ns, of from 9.4 × 10⁻⁴ to 0.011. If we assume a bigger population size, e.g., N ∼ 106 for mice (Keightley et al. 2005), the obtained range of equivalent 2Ns is unchanged. This is because the population size, N, affects the average dN/dS ratio only through the product NψA/4 or Ns (see, e.g., Equation 17). In contrast, if we are given a smaller number of sperm, e.g., NhSp ∼ 106 for mice (Manning and Chamberlain 1994), the single-sperm level selective advantage would be equivalent to 2Ns ∼ 2.8 × 10⁻³−0.034, which is about three times larger than the range inferred for humans. This results from the positive correlation between NhSp and ψA (Figure 3).
Thus, this result indicates that typical selective advantages of mutations at the single-sperm level should be very small; if selection acted on these mutations in the standard fashion (as in Figure 1A), the effect of selection would be negligible and they would behave almost as if they were neutral or nearly neutral. In other words, fierce competition among paternity-sharing sperm enables selection to act quite efficiently on mutations with such tiny phenotypic effects, which could cause dN/dS values to significantly exceed 1 in some regions.
Discussion
In this article, we theoretically examined the population genetic behavior of mutations in sperm genes. We modeled the processes at two levels. One is the standard population genetic process, in which the population allele frequencies change generation by generation, depending on the difference in selective advantages. The other is the sperm competition during each genetic transmission from one generation to the next generation.
For the sperm competition process, we considered a very simple situation with monogamous mating, so that selection needs to be considered only in matings involving heterozygous males. In a single mating process involving a heterozygous male, a huge number of sperm with alleles A and B (approximately equal in number) compete to fertilize a single egg. Our theory demonstrates that a very slight difference in sperm performance (i.e., velocity as we defined) amounts to quite a large difference in the winning probability. We found that this probability is given by a function of an important parameter, ψA, namely the competitive advantage of allele A over allele B in a single mating. We also demonstrated that ψA is much larger than it would be in a one-on-one competition between a pair of sperm, one with allele A and the other with allele B. This suggests that a very small phenotypic difference at the single-sperm level can be enhanced by fierce sperm competition.
For the generation-by-generation process, the standard population genetic theory can be directly applied with slight modifications. The only difference is that selection works only through heterozygous males. In a simple one-locus, two-allele model with alleles A and B, our theory shows that the fixation probability of a newly arisen mutant with A is given by Equation 13 if allele A has a competitive advantage of ψA over B. This equation indicates that 4 × ψA in our model is equivalent to the selective advantage s in the standard model of additive selection. Of this reduction to one-quarter in the efficacy of selection, one-half is due to the neutrality (actually, absence) of the process for females, and the other half is due to selection operating only through heterozygous males.
While the efficacy of selection is reduced to one-quarter for sperm genes in the generation-by-generation process, the enhancement of selection in the sperm competition during each generation is much larger, potentially increasing adaptive amino acid substitutions in sperm genes. Indeed, as we demonstrated theoretically, the elevated dN/dS values observed in sperm genes in mammals could be explained by mutations whose effects on individual sperm are so weak that they would be classified as “neutral” in a normal population genetic framework.
Our minimal model focuses on competition among sperm that share paternity. These competitions are ubiquitous and occur regardless of whether the mating system is monogamous, polygamous, or external. Thus, our result could provide a potentially important explanation of rapid evolution of sperm genes with a variety of functions in a wide range of species, as long as they are expressed in the haploid phase. The extent to which our model can be applied depends on how common haploid expression is among sperm genes. There are multiple lines of evidence that haploid expression in sperm is indeed quite common as mentioned in the Introduction (see, e.g., Joseph and Kirkpatrick 2004; Good and Nachman 2005; Dorus et al. 2010). A notable work is the recent proteome-scale evolutionary analysis of mice by Good and Nachman (2005), which showed that sperm genes expressed after meiosis tend to have higher dN/dS values than other sperm genes. Their study implies that, in such genes with haploid expression, the contribution of sperm competition to the rapid amino acid evolution should be large.
Our model may be well merged with previous models of postcopulatory sexual selection (e.g., Birkhead and Pizzari 2002; Swanson and Vacquier 2002b; Clark et al. 2006; Turner and Hoekstra 2008) or sexual conflict (e.g., Rice and Holland 1997; Frank 2000; Gavrilets 2000; Chapman et al. 2003; Hayashi et al. 2007), all of which focus mainly on competition or conflicts among individuals. Our results suggest that competition among paternity-sharing sperm can boost any mode of postcopulatory sexual selection and/or sexual conflict. For example, coupling our model with sexual conflict provides a more powerful explanation of the long-term acceleration of dN/dS in sperm genes. Our model alone does not guarantee that the acceleration of amino acid substitution lasts long. This is because each sperm gene eventually reaches the optimum of its fitness landscape, from which no adaptive mutations are expected. Thus a high dN/dS cannot be expected as long as the gene’s fitness landscape keeps its shape (or optimum). This indicates that a long-term acceleration may require factors that shift the optimum.
Sexual conflict would be one example, which continuously shifts the optimum by a “coevolutionary chase” between the male and female genes (e.g., in Rice and Holland 1997; Frank 2000; Gavrilets 2000; Chapman et al. 2003; Hayashi et al. 2007). An interesting question in this regard is why high dN/dS values are observed commonly among sperm genes but quite rarely among female-reproductive genes in many species (e.g., Swanson and Vacquier 2002b; Clark et al. 2006). One important conclusion of our theory is that fierce sperm competition could enable even a mutation with a tiny phenotypic benefit to be fixed as if it were strongly selected for. This suggests that, even to a small shift in the female environment (e.g., caused by only a single amino acid change), a sperm gene could respond via a large number of amino acid changes, each of which alters the sperm phenotype only slightly.
Another potentially important factor would be intermale competition through different phenotypes of sperm or other reproductive apparatuses (such as copulatory plugs). This could also change the environment in which sperm compete against one another and thus could shift the optimum of the fitness landscape of each sperm gene.
In this work, we focused only on the effects of mutations on sperm performance and ignored their effects on other phenotypes. If, however, a sperm gene is pleiotropic, it is obvious that the fitness at the sperm level is not the entire factor that determines the fate of the mutation (see, e.g., Crow 2012). Nevertheless, such pleiotropic effects might not significantly affect the main conclusions of this study, for two reasons. First, a majority of sperm genes observed to have high dN/dS values seem to be specific to sperm (e.g., Good and Nachman 2005; Turner and Hoekstra 2008). Second, even if a sperm gene is indeed pleiotropic, it is important to note, again, that fierce sperm competition could enhance the effect of a mutation on sperm functions but not its effect on other tissues. Therefore, there should be many occasions where sperm competition contributes to the accelerated dN/dS in sperm genes with haploid expression. This, combined with the observation that haploid expressed genes account for a substantial fraction of the sperm proteome (e.g., Joseph and Kirkpatrick 2004; Good and Nachman 2005), could be one of the major explanations of the general trend that a wide variety of sperm genes show high dN/dS ratios in various taxonomic lineages.
Our theory may explain some previous observations that seemed enigmatic. One is on the role of postcopulatory sexual selection among (male) individuals as a potential major cause of the elevated dN/dS values. If this plays the major role, one would expect a positive correlation between dN/dS and the intensity of sexual selection. However, there was no significant correlation in a molecular evolutionary analysis of male sperm genes in rodents (Ramm et al. 2008). Why can dN/dS be elevated in a species with weak sexual selection as much as in species with intense sexual selection? One possible and simple answer could be that, at least in rodents, competition among paternity-sharing sperm is much more potent than intermale sperm competition. The former competition takes place irrespective of whether sexual selection occurs at the individual level or not, and our theory predicts that the former greatly enhances the selective advantage of a mutation. Thus, if the former’s “baseline” effects are much larger than the effects influenced by individual-level sexual selection, the correlation between the protein evolution rate and the intensity of sexual selection would be relatively too small to be observed.
It should be noted here that our theory applies exclusively to sperm genes, especially haploid expressed ones, but that it does not apply to male reproductive genes lacking expression in sperm. Some genes of the latter type are known to have high dN/dS and show positive correlation between dN/dS and the intensity of (intermale) sexual selection. Among those showing the correlation is a seminal vesicle-derived protein, Svs2, which is a major component of the copulatory plug in rodents (Ramm et al. 2008). Similarly, semenogelins, SEMG1 and SEMG2, that are known to prevent other males’ sperm from reaching the oocyte, also showed correlations in the primate lineages (e.g., Ramm et al. 2008, and references therein). The rapidly evolving Drosophila male accessory gland proteins (e.g., Swanson et al. 2001) also belong to this type. From their functions, it is obvious that these genes play important roles in intermale competition and that their rapid evolution is not caused by sperm competition. It is indicated that intermale sexual selection is an important mechanism to increase dN/dS especially of such male reproductive genes not expressed in sperm.
Flies are unique in that their sperm genes do not show significantly higher dN/dS values than the genome average (Dorus et al. 2006). Given that any kind of selection works very efficiently through fierce competition among sperm sharing the paternity, this unique observation should indicate that such sperm competition may not be very intensive in flies. Indeed, there are several lines of evidence that flies have quite small numbers of competing sperm per egg and little haploid expression (see, e.g., Erickson 1990; Manning and Chamberlain 1994). This agrees with our prediction that mutational effects on sperm genes should be enhanced in a manner positively correlated with the number of sperm per egg (e.g., Figure 3).
Acknowledgements
We thank two anonymous reviewers for their helpful comments. This work is in part supported by grants from the Japan Society for the Promotion of Science (to H.I.).
Footnotes
Communicating editor: L. M. Wahl
Literature Cited
Author notes
Supporting information is available online at http://www.genetics.org/lookup/suppl/doi:10.1534/genetics.113.152066/-/DC1.
