


Abstract
We measured linkage disequilibrium in mostly noncoding regions of Cryptomeria japonica, a conifer belonging to Cupressaceae. Linkage disequilibrium was extensive and did not decay even at a distance of 100 kb. The average estimate of the population recombination rate per base pair was 1.55 × 10⁻⁵ and was <1/70 of that in the coding regions. We discuss the impact of low recombination rates in a large part of the genome on association studies.
LINKAGE disequilibrium (LD) in the coding genes and their surrounding regions of conifers has been reported to extend to only several hundred to a few thousand base pairs [Brown et al. (2004); Heuertz et al. (2006); Pyhäjärvi et al. (2007), but see Pyhäjärvi et al. (2011) for LD extending to several kilobases]. This observation led to the conclusion that conifers are not suitable for finding associations with traits using a genomic scan (Neale and Savolainen 2004). However, if the genome-wide extent of LD is not the same as that in the regions studied thus far, the strategy may change. Indeed, the extents of LD differ between genomic regions in maize possibly due to differences in the recombination rate (Gore et al. 2009). Furthermore, conifers generally have lower recombination rates than angiosperms (Jaramillo-Correa et al. 2010). Thus, it is important to know the extent of LD in regions other than the coding genes and their surrounding regions. However, the extent of LD in such regions has not been investigated in conifers to our knowledge possibly because of the lack of sequence information on those regions [but see Hamberger et al. (2009); Keeling et al. (2010); Kovach et al. (2010)].
We recently constructed a bacterial artificial chromosome (BAC) library for Cryptomeria japonica, a conifer belonging to Cupressaceae sensu lato (Gadek et al. 2000; Kusumi et al. 2000) and determined the sequences of eight random clones from the library. We used these sequences to design primers and resequenced fragments in those regions using the same tree samples used by Fujimoto et al. (2008) for the study of the coding regions. From these data, we investigated the extent of LD at a scale of up to 100 kb in the mostly noncoding regions covered by those BACs (see Supporting Information, File S1, for more details on materials and methods).
First, we give a summary of the sequence analysis of the BAC clones relevant to this study. Details of the analysis will be published elsewhere (M. Tamura, A. Watanabe, K. Uchiyama, N. Futamura, K. Shinohara, Y. Tsumura, H. Tachida, unpublished results). Eight random clones (BAC1–BAC8) from the BAC library developed by the Forestry and Forest Products Research Institute in Japan were sequenced. The total length of the sequences was ∼800 kb. These sequences were mostly noncoding, and at least 51% of them consisted of known (the majority being LTR retrotransposons) or unknown repeats. Only part (four exons) of one putative protein-coding gene, homologous to genes coding for calcium-dependent protein kinases, was found in BAC6. The ratio of nonsynonymous-to-synonymous divergence between the exons and the corresponding regions in Taxodium distichum, a close relative of C. japonica, was 0.086, suggesting that the gene was active when the two species diverged. The size of the largest intron of this gene was 70 kb (see Figure 1).
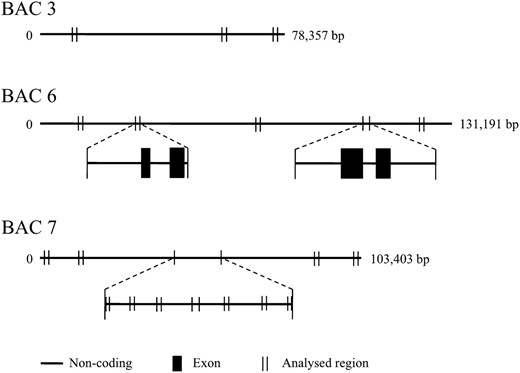
Positions of the regions in BAC3, BAC6, and BAC7 used for the study. The regions sequenced for at least 41 samples are shown by “| |,” and the positions of the exons of a putative coding gene are indicated by solid boxes (for primer information, see Table S1). We expected to amplify only one copy of each fragment if it existed in a single copy in the genome because we used haploid genomic DNA from megagametophytes. However, because the genome of C. japonica contained many copies of very similar fragments, only sequences of several fragments each in BAC3, BAC6, and BAC7 indicated in the figure could be determined for at least 40 samples by direct sequencing. We used long PCR and gel electrophoresis to confirm the distances between the sites in the sequenced fragments. The lengths of the PCR products approximately agreed with those calculated from the assembled BAC sequences (data not shown).
In the resequencing experiment, in total, 19 fragments, including the coding regions in BAC6, could be sequenced for at least 40 samples, and their total length was 15,517 bp (Figure 1). We will call them the BAC regions hereafter. The fragment size ranged from 509 to 2016 bp, and the maximum lengths between pairs of sites in the sequenced regions in BAC3, BAC6, and BAC7 were 65,409, 110,613 and 103,427 bp, respectively.
We aligned those 40 or more sequences along with the corresponding sequence of the BACs. Thus, the total number of samples was at least 41. We computed various statistics of genetic diversity excluding sites involving indel variation (Table S2) using DNAsp 5.0 (Rozas et al. 2003). The average nucleotide diversity across all sites was 0.35%, which was similar to those at the silent sites in the mostly coding regions of the same species studied by Kado et al. (2003) and Fujimoto et al. (2008).
Figure 2 shows the squared allelic correlation coefficient, r2, against the number of base pairs separating the two sites. It decayed very little in all three BACs. Thus, LD extended to sites separated by up to 110 kb. We also estimated the population recombination rate, 4Ner, where Ne and r are the effective size of the population and the recombination rate, respectively, in the BAC regions using the composite-likelihood method (Hudson 2001; McVean et al. 2002) implemented in LDhat 2.1. The results for the BAC regions are shown in Table 1, along with those for the five coding genes previously studied by Fujimoto et al. (2008). The composite-likelihood curves for the data set are shown in Figure S1 (the BACs) and Figure S2 (the coding genes). The average r/u and 4Ner per base was 5.04 × 10⁻³ and 1.55 × 10⁻⁵, respectively, for the BAC regions and 4.46 × 10⁻¹ and 1.18 × 10⁻³, respectively, for the five coding genes. Thus, the population recombination rate seems to be <1/70 in the BAC regions compared to that in the coding genes studied by Fujimoto et al. (2008).
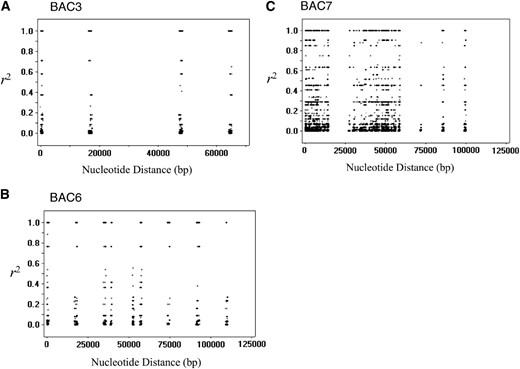
The levels of linkage disequilibrium in BAC3, BAC6, and BAC7. The squared allelic correlation coefficient, r2, for two sites is plotted against the number of bases separating them for BAC3 (A), BAC6 (B), and BAC7 (C).
Estimates of population recombination rate
| Region | Length (bp) | RM | 4Nr | 4Nr/bp | 4Nu/bp | r/u |
|---|---|---|---|---|---|---|
| BACs | ||||||
| BAC3 | 65,411 | 0 | 0 | 0 | 0.00659 | 0 |
| BAC6 | 110,278 | 1 | 3 | 2.72 × 10⁻⁵ | 0.00317 | 0.00858 |
| BAC7 | 103,427 | 7 | 2 | 1.93 × 10⁻⁵ | 0.00296 | 0.00653 |
| Mean | 1.55 × 10⁻⁵ | 0.00346 | 0.00504 | |||
| Coding genes | ||||||
| NCED | 2,125 | 2 | 3 | 0.00141 | 0.00213 | 0.66280 |
| AMT | 2,682 | 2 | 2 | 0.00075 | 0.00093 | 0.80184 |
| Cal | 3,541 | 2 | 3 | 0.00085 | 0.00454 | 0.18661 |
| AQU | 1,787 | 1 | 4 | 0.00223 | 0.00469 | 0.47727 |
| Cryj2 | 4,257 | 6 | 3 | 0.00070 | 0.00681 | 0.10348 |
| Mean | 0.00118 | 0.00382 | 0.44640 | |||
One explanation for the difference of LD between the BACs and the coding regions is the difference in the recombination rate. In angiosperms, gene density and the recombination rate are positively correlated, possibly due to low gene density and low recombination rates in heterochromatic regions (Gaut et al. 2007). Therefore, if the genome of C. japonica is mostly heterochromatic, we expect to observe low recombination rates and low gene density in random BAC clones. Alternatively, the effective size, Ne, in the BAC regions might be smaller than that in the coding genes because of genetic draft (Gillespie 2000), background selection (Charlesworth et al. 1993), and/or the weak selection Hill–Robertson effect (McVean and Charlesworth 2000). However, because the levels of the silent nucleotide diversity in the two regions were comparable, this explanation seemed unlikely.
The slow decay of LD in the BAC regions is quite different from the rapid decay of LD within 500–2000 bp observed in Pinaceae and poplars (Brown et al. 2004; Ingvarsson 2005, 2008; Krutovsky and Neale 2005; González-Martínez et al. 2006; Heuertz et al. 2006; Pyhäjärvi et al. 2007; Ingvarsson et al. 2008; Li et al. 2010) although more extensive LD has been found in a few cases (Eckert et al. 2010; Pyhäjärvi et al. 2011). C. japonica is distantly related to these species (Chaw et al. 2000), and the difference may be ascribed to differences in the species studied; however, a more plausible explanation would be the differences in the regions studied. The other studies examined relatively narrow regions that included coding genes [except for the 80-kb gene-rich region surrounding the phytochrome B2 locus in aspen studied by Ingvarsson et al. (2008)], while our BAC regions were in mostly noncoding regions. Indeed, the extensive linkage disequilibrium found here might be consistent with the interlocus linkage disequilibrium found in coastal Douglas fir (Eckert et al. 2009) and in Pinus taeda (Eckert et al. 2010).
On the basis of the rapid decay of linkage disequilibrium in conifers, Neale and Savolainen (2004) concluded that genome-wide association studies would not be possible in conifers because of the enormous SNP marker density required (see also Neale and Kremer 2011). However, the number of necessary SNP markers may not be as large if most of the genome is segregating as blocks, as found in the BAC regions studied here. Thus, genome-wide association studies may be feasible in conifers whose genome sizes are generally large (Ohri and Khoshoo 1986), although it would be difficult to locate the causal polymorphism if LD is extensive (Atwell et al. 2010). Nevertheless, identifying causal polymorphisms is not necessary for genomic selection (Meuwissen et al. 2001). Of course, we need to choose the positions of SNP markers carefully so that they are spaced appropriately in terms of recombination rates by identifying recombination-poor and -rich regions (see Flint-Garcia et al. 2003). If heterochromatic regions are recombination-poor in conifers as they are in angiosperms (Gaut et al. 2007), then identifying heterochromatic regions is important for designing efficient markers.
In this article, we have shown that linkage disequilibrium in the BAC regions was much more extensive than that in the coding regions. However, our data are restricted to those from only three random BAC clones. We need to test the generality of these features in future studies.
Acknowledgements
We thank two anonymous referees for their helpful comments. This study was partially supported by the Program for Promotion of Basic and Applied Researches for Innovations in Bio-oriented Industry and by a Grant-in-Aid for Scientific Research from the Japan Society for the Promotion of Science (no. 22370083).
Literature Cited
Footnotes
Communicating editor: O. Savolainen
Author notes
Supporting information is available online at http://www.genetics.org/content/suppl/2011/12/30/genetics.111.136697.DC1
These authors contributed equally to this study.
