


Abstract
In a variety of organisms, including worms, flies, and mammals, glucose homeostasis is maintained by insulin-like signaling in a robust network of opposing and complementary signaling pathways. The hexosamine signaling pathway, terminating in O-linked-N-acetylglucosamine (O-GlcNAc) cycling, is a key sensor of nutrient status and has been genetically linked to the regulation of insulin signaling in Caenorhabditis elegans. Here we demonstrate that O-GlcNAc cycling and insulin signaling are both essential components of the C. elegans response to glucose stress. A number of insulin-dependent processes were found to be sensitive to glucose stress, including fertility, reproductive timing, and dauer formation, yet each of these differed in their threshold of sensitivity to glucose excess. Our findings suggest that O-GlcNAc cycling and insulin signaling are both required for a robust and adaptable response to glucose stress, but these two pathways show complex and interdependent roles in the maintenance of glucose–insulin homeostasis.
GLUCOSE homeostasis is crucial for the fundamental processes of development, fertility, and life span in organisms as diverse as yeast, nematodes, and humans. In humans, loss of homeostatic control can lead to toxic levels of blood glucose and the development of obesity and type 2 diabetes, diseases characterized by decreased ability to respond to and metabolize glucose. Twin, family, and epidemiological studies have demonstrated a significant genetic component for diseases of glucose toxicity (reviewed in Vimaleswaran and Loos 2010; Walkeret al. 2010). Genetic background can be thought of as setting a threshold for glucose toxicity, and environmental factors such as diet and physical activity determine whether an individual crosses that threshold. Sugar consumption has increased by >20% in the past two decades (Haleyet al. 2005), and it is clear that individuals of many genetic backgrounds are now crossing the threshold for glucose toxicity, resulting in a rapidly increasing burden of glucose toxicity diseases [Centers forDiseaseControl andPrevention (CDC) 2007]. Glucose toxicity and insulin resistance both play a role in the development of diabetic complications, including heart disease, blindness, and stroke (reviewed in Aronson 2008; Brownlee 2001). Understanding which genes set the glucose toxicity threshold, how these genes work in combination, and how the threshold level differs for different processes or in different stages of life is crucial to combat the diseases of glucose toxicity.
Mexican-Americans have an increased incidence of type 2 diabetes (Haffneret al. 1991), and a single-nucleotide polymorphism at the OGA-1 locus is correlated with both the disease and age of onset in this population (Lehmanet al. 2005). OGA-1 removes the O-linked-N-acetylglucosamine (O-GlcNAc) post-translational modification from proteins, countering the activity of the O-GlcNAc transferase OGT-1. Several studies have implicated O-GlcNAc cycling in the development of insulin resistance, the hallmark of type 2 diabetes (reviewed in Mondouxet al. 2010). Transgenic mice that overexpress OGT-1 in muscle or liver cells develop insulin resistance, as do mammalian culture cells treated with an inhibitor of OGA-1 (McClainet al. 2002; Vosselleret al. 2002; Ariaset al. 2004; Akimotoet al. 2007; Parket al. 2007; Yanget al. 2008). Furthermore, insulin-signaling components, including the insulin receptor substrate (IRS-1) and Akt1, are modified by O-GlcNAc in mammalian cells, which antagonizes insulin signaling (Yanget al. 2008). The downstream target of mammalian insulin signaling, FOXO1, is also modified by O-GlcNAc. Normally suppressed by insulin signaling, FOXO1 is activated in response to glucose, providing another mechanism for OGT-1 to counteract the insulin signal (Housleyet al. 2008, 2009; Kuoet al. 2008).
The substrate for OGT-1, UDP-GlcNAc, is derived from glucose, and glucose levels generally correlate with the level of O-GlcNAc protein modification (Yki-Jarvinenet al. 1998; Liuet al. 2000), suggesting that this hexosamine signaling pathway acts as a nutrient sensor. Furthermore, OGT-1 interacts with other nutrient-sensing pathways, including the insulin-signaling, MAP kinase, mTOR, and AMPK pathways (reviewed in Hanoveret al. 2010), making OGA-1 and OGT-1 candidates for genes that contribute to setting the glucose toxicity threshold.
Glucose toxicity diseases are multifactorial: many genes in addition to OGA-1 can contribute to the development of obesity or type 2 diabetes. Over 125 human obesity and diabetes susceptibility loci have been identified by studies of different ethnic groups, candidate gene association studies, and genome-wide association studies (GWA). Despite these large-scale efforts (some with sample sizes in the tens of thousands), only a few candidate genes have been found to be robustly associated with obesity or type 2 diabetes across multiple studies (reviewed in Vimaleswaran and Loos 2010). This is likely due to the small degree of association for any individual gene, differing allele frequencies between populations, the combinatorial effects of different variants, and complex interactions between gene variants and environmental factors. Furthermore, it is unclear how or whether these susceptibility genes affect processes like fertility and aging in the absence of diabetes.
The multifactorial character of glucose toxicity diseases is just one major roadblock to determining which genes set the glucose toxicity threshold. In addition, it is nearly impossible to control for environmental factors including diet and physical activity in human studies. Furthermore, many genes known to be important in responding to glucose and regulating insulin signaling are essential in mammals, including OGA-1 and OGT-1 (Shafiet al. 2000; O’Donnellet al. 2004). OGA-1 and OGT-1 are highly conserved in Caenorhabditis elegans (68% and 88% similarity to the human orthologs, respectively) (Lubaset al. 1997; Forsytheet al. 2006), as is the insulin-like signaling pathway (reviewed in Broughton and Partridge 2009; Narasimhanet al. 2009). In this study, we used C. elegans to model the genetic response to glucose and the roles of insulin signaling and O-GlcNAcylation in this process.
MATERIALS AND METHODS
Strains:
The following alleles were used in these studies: wild-type N2 Bristol; the O-GlcNAc transferase deletion strains ogt-1(ok430), ogt-1(ok1474), and ogt-1(tm1046); the O-GlcNAcase deletion mutant oga-1(ok1207) (Hanoveret al. 2005; Forsytheet al. 2006; Loveet al. 2010), the temperature-sensitive insulin-like receptor mutants daf-2(e1370) and daf-2(e1368), the temperature-sensitive TGF-β pathway mutants daf-1(m40) and daf-7(e1372), and the guanyl cyclase mutant daf-11(m47). Some nematode strains used in this work were provided by the Caenorhabditis Genetics Center, which is funded by the National Institutes of Health (NIH) National Center for Research Resources (NCRR).
Glucose treatment and fertility assays:
Synchronous embryos were produced by hypochlorite-NaOH treatment of gravid adults grown on NGM plates. The synchronous embryos were allowed to develop on NGM or NGM plus supplemental glucose plates at the indicated temperature (20°–25°) until the L4 stage (for fertility assays) or for 4–5 days (for collection for Western blotting and macronutrient analysis). Fertility assays were performed as described (Loveet al. 2010). N2 strains were grown at the indicated temperature (20° or 22.5°) throughout the fertility experiments; daf-2 strains were grown at 15° until the L4 stage and then shifted to 22.5° or 25°. The total number of broods counted at 20° (control, 50 mm glucose, 125 mm glucose, 250 mm glucose, 333 mm glucose, and 500 mm glucose) is as follows: N2, 73, 22, 27, 59, 41, and 19; oga-1, 50, 15, 15, 32, 15, and 13; ogt-1(ok430), 47, 13, 14, 31, 15, and 12; ogt-1(tm1046), 22, ND, ND, 22, 17, and ND; and ogt-1(ok1474), 38, ND, ND, 31, 15, and ND. The total number of broods counted at 22.5° (control and 250 mm glucose) is as follows: N2, 36 and 34; oga-1(ok1207), 35 and 33; ogt-1(ok1474), 32 and 37; daf-2, 48 and 46; daf-2;oga-1, 32 and 32; and daf-2ogt-1, 31 and 32. The total number of broods counted at 25° (control and 250 mm glucose) is as follows: daf-2, 24 and 24; daf-2;oga-1, 24 and 24; and daf-2ogt-1, 24 and 24.
Western blots:
Worm lysates and immunoblotting were conducted as described (Forsytheet al. 2006) with some modifications. Worms were sonicated three times for 30 sec at medium power (36 W, level 3) and lysates were made from whole animals dissolved in T-PER tissue protein extraction reagent (Pierce Chemical, Rockford, IL) supplemented with complete miniprotease inhibitors (Roche Diagnostics) and 1 mm PMSF on ice. Insoluble material was removed by centrifugation at 16,000 × g for 10 min at 4°. Protein concentration was determined using a NanoDrop spectrophotometer (Thermo Scientific). Twenty-five micrograms of total protein was added per lane. Immunoblots were imaged using an Odyssey imaging system (Li-COR Biosciences). The O-GlcNAc-specific antibody RL2 (MA1-072) (Affinity Bioreagents) and secondary infrared 800- and 680-conjugated antibodies (Li-COR Biosciences) were used for immunoblotting.
Dauer assays:
Gravid adults were allowed to lay embryos at 15° overnight. Adults were removed and plates transferred to experimental temperature (23°–25°) for 2–3 days and the numbers of dauers and L4/adults were counted. The total number of daf-2(e1370) animals counted (control and 250 mm glucose) is as follows: OP50, 958 and 918; and HT115, 778 and 822. The total number of daf-2(e1370) animals counted (control, 5 mm glucose, 50 mm glucose, 100 mm glucose, and 250 mm glucose) is as follows: 23°, 400, 461, 213, 495, and 112; 23.5°, 269, 214, 179, 318, and 103; and 24°, 177, 317, 330, 326, and 72. The total number of animals counted (control and 250 mm glucose) is as follows: daf-2, 504 and 432; daf-2;oga-1, 1224 and 422; and daf-2ogt-1, 794 and 379. The total number of animals counted (control and 250 mm glucose, including temperature) is as follows: daf-2(e1370), 985 and 487 (23°), 919 and 503 (23.5°), and 340 and 134 (24°); daf-2(e1368), 1698 and 1154 (25.5°); daf-11(m47), 1134 and 853 (24°); daf-1(m40), 875 and 435 (23°), 1277 and 662 (23.5°), and 715 and 324 (24°); and daf-7(e1372), 425 and 106 (23°), 664 and 333 (23.5°), and 472 and 105 (24°).
RESULTS
C. elegans as a model for the glucose stress response:
C. elegans grows poorly in carbohydrate-free liquid medium and can utilize glucose as an effective energy source (Lu and Goetsch 1993). Therefore, although worms are subject to glucose stress, glucose is not generally toxic. We wanted to determine the threshold for glucose stress, which we defined as the highest concentration that supported wild-type fertility levels when added to standard NGM plates. We assayed growth and fertility on a range of glucose concentrations. A total of 50–250 mm supplemental glucose had no significant effect on wild-type (N2) brood size; however, fertility was significantly decreased in the presence of 333 mm or 500 mm glucose (∼25% and ∼60% reduction in brood size, respectively; Figure 1A). A total of 250 mm supplemental glucose was thus defined as the threshold for glucose stress for our experiments.
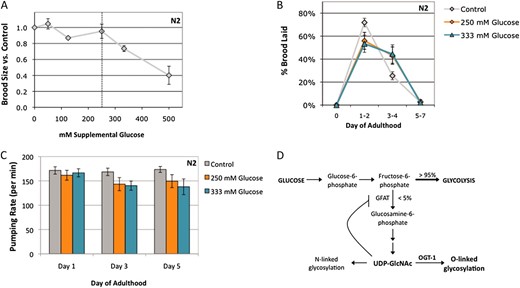
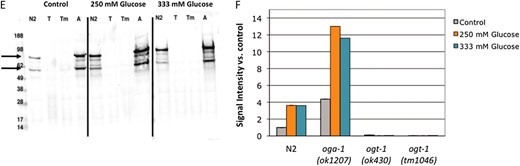
Characterization of the glucose stress response. (A) Brood size was determined for wild-type (N2, gray line) animals at 20° on a range of supplemental glucose concentrations and is expressed as a fraction of brood on control plates. Animals were fully fertile (≥90% of control brood size) at supplemental glucose concentrations up to 250 mm glucose, which we define as the threshold for glucose stress (dashed line). Glucose toxicity was observed at 333 mm and 500 mm supplemental glucose (25% and 60% reduction in brood size, respectively). Data are presented as the mean from 2–10 independent experiments; error bars represent standard error of the mean (SEM). (B) Glucose stress affects reproductive timing. Brood size was counted on control (gray line), 250 mm glucose (orange line), and 333 mm glucose (blue line) plates at 20° and the percentage of embryos laid in each time frame was calculated. On control plates, wild-type animals laid most of their embryos (∼75%) in the first 2 days of adulthood. At the threshold or toxic levels of glucose stress, reproduction is delayed and fewer embryos (∼50%) are laid in days 1 and 2. Data are presented as the mean from 2–5 independent experiments ± SEM. (C) Pharyngeal pumping rates were determined as a measure of health span for animals reared on control (gray bars), 250 mm (orange bars), or 333 mm (blue bars) supplemental glucose plates. Unlike brood size and reproductive timing, high concentrations of glucose had no effect on day 1 adult pharyngeal pumping rates. The slight decline in pumping rate with age was associated with increased mortality of these animals, suggesting shortened life span is a dominant contributing factor. (D) Simplified schematic showing the role of glucose flux in hexosamine signaling. Glucose levels influence O-GlcNAcylation, as ∼2–5% of intracellular glucose is converted to UDP-GlcNAc, the substrate for OGT-1. High levels of UDP-GlcNAc can negatively regulate GFAT, the rate-limiting enzyme in the pathway, through a feedback loop. (E) Extracts of C. elegans wild-type (N2), ogt-1(ok430) (T), ogt-1(tm1046) (Tm), and oga-1 (ok1207) (A) strains grown on control, 250 mm glucose, or 333 mm glucose plates were subjected to Western blotting with the anti-O-GlcNAc antibody RL2. At this exposure, the visible bands are the highly O-GlcNAcylated nuclear porins (arrows). ogt-1 null mutants (ok430 and tm1046) cannot catalyze the O-GlcNAc modification and have no RL2-positive bands in either condition. Representative blots are shown. (F) Quantitation of RL2-positive bands. The upper and lower bands (indicated in E with arrows) were quantitated as a measure of protein O-GlcNAcylation level. Glucose stress of 250 mm (orange bars) and 333 mm (blue bars) increased the level of protein O-GlcNAcylation three- to fourfold in both N2 and oga-1 mutant strains compared to control (gray bars).
We further characterized the glucose stress response by examining reproductive timing. On control plates, wild-type animals lay most of their embryos (∼75% of the total brood) within the first 2 days of adulthood. This reproductive profile is highly reproducible. However, in the presence of glucose stress, there was a shift in the reproductive profile and a reduction in the number of embryos laid in the first 2 days (∼50% of the total brood; Figure 1B). This shift was seen at glucose concentrations of ≥250 mm (Figure 1B and data not shown), even though animals were fully fertile at 250 mm glucose, suggesting that reproductive timing is more sensitive to glucose stress than brood size.
We also used pharyngeal pumping as a measure of health span, to determine whether glucose stress contributed to age-related decline. Exposure to glucose stress during development did not affect adult pumping rates on the first day of adulthood (Figure 1C). As the animals aged, exposure to glucose concentrations below the toxicity threshold caused no change in pumping rates, whereas concentrations at (250 mm) or above (333 mm) the threshold caused a slight reduction in pumping rates (∼20% decrease compared to control; Figure 1C and data not shown). Because glucose stress leads to shortened life span in C. elegans (Schulzet al. 2007; Leeet al. 2009; Schlottereret al. 2009), this pumping decline may be a general symptom of sick and dying animals, consistent with our own observations on the effects of glucose toxicity on life span.
The O-GlcNAc cycling pathway responds to glucose stress:
Many cellular signaling pathways respond to glucose and could be required for the glucose stress response. One such pathway is the hexosamine-signaling pathway, as ∼2–5% of the total intracellular glucose is converted to UDP-GlcNAc, the substrate for OGT-1 (Figure 1D) (Boucheet al. 2004). A consequence of glucose toxicity in mammalian cells is an increase in flux through the hexosamine signaling pathway, and insulin treatment increases the O-GlcNAcylation of key proteins in the insulin-signaling pathway (Whelanet al. 2010).
We tested how glucose influenced O-GlcNAc modification levels in C. elegans and found that increased glucose caused increased hexosamine flux. The addition of either 250 mm glucose (glucose stress threshold) or 333 mm glucose (toxic level of glucose) resulted in a reproducible increase in the level of O-GlcNAc–modified proteins in wild-type animals (3.6-fold increase compared to control, Figure 1, E and F), suggesting that increased O-GlycNacylation is a characteristic of glucose stress. Like the changes in reproductive profile, the levels of O-GlcNAcylation were similar whether the animals were grown on 250 mm or 333 mm glucose. This could be due to feedback inhibition, as UDP-GlcNAc is an inhibitor of fructose-6-phosphate amidotransferase (GFAT), the rate-limiting enzyme of the hexosamine biosynthesis pathway (Figure 1D) (reviewed in Buse 2006). Alternatively, O-GlcNAc cycling may maintain a steady-state concentration of O-GlcNAcylated proteins that does not significantly increase above 250 mm supplemental glucose.
Compared to wild type, oga-1 mutants have increased levels of O-GlcNAc–modified proteins (Forsytheet al. 2006) (Figure 1, E and F). The level of O-GlcNAcylation was similar in glucose-treated N2 worms compared to untreated oga-1 worms. Combining the oga-1 mutation with glucose treatment resulted in a greatly elevated level of protein O-GlcNAcylation (11- to 13-fold increase compared to untreated N2 control; Figure 1, E and F). As expected, null mutants of ogt-1 are unable to catalyze the modification and no O-GlcNAc signal was detected by Western blot for control or glucose-grown ogt-1 strains (Hanoveret al. 2005; Figure 1D). Taken together, these findings suggest that O-GlcNAc levels are glucose responsive and normally limited by active O-GlcNAc cycling.
Since the hexosamine signaling pathway responded to glucose, we next tested whether changes in protein O-GlcNAcylation affected fertility or reproductive timing. The oga-1 null mutants had significantly elevated protein O-GlcNAcylation compared to wild type (Figure 1), but this had no effect on brood size, as oga-1 mutants had similar brood sizes compared to N2 at a range of glucose concentrations (Figure 2A). Furthermore, 333 mm glucose and 500 mm glucose reduced fertility similarly in the oga-1 mutant and in wild type (Figure 2A). This suggests that the toxic effects of 333 mm supplemental glucose on N2 and oga-1 mutants are independent of the increased O-GlcNAcylation level observed on high glucose.
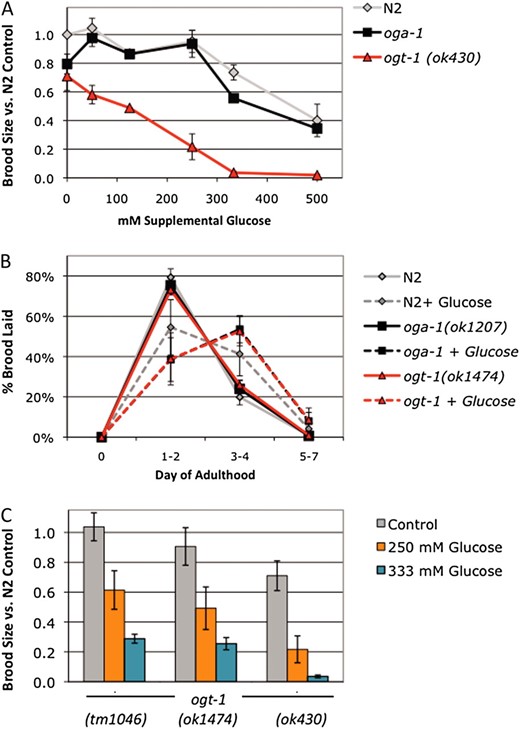
OGT-1 is required for the glucose stress response. (A) Brood size was determined for wild type (N2, gray line), oga-1(ok1207) (black line), and ogt-1(ok430) (red line) at 20° and is expressed as a fraction of the N2 brood on control plates. oga-1 mutant animals were fully fertile at supplemental glucose concentrations up to 250 mm but were subject to glucose toxicity at 333 mm and 500 mm supplemental glucose (30% and 60% reduction in brood size). ogt-1(ok430) exhibited a lower threshold for glucose stress, as each supplemental glucose concentration tested (50–500 mm glucose) reduced fertility. At toxic glucose levels, brood size was more severely affected in ogt-1 mutants (70–98% reduction in brood size) compared to N2 or oga-1 mutants. Data are presented as mean from two to seven independent experiments ± SEM. (B) The glucose effect on reproductive timing is strain independent. Brood size was counted on control (solid lines) and 250 mm glucose plates (dashed lines) at 22.5° and the percentage of embryos laid in each time frame was calculated. On control plates, all three strains lay most of their embryos (75–80%) in the first 2 days of adulthood in a highly reproducible manner. At the threshold for glucose stress, reproduction is delayed and fewer embryos (40–50%) are laid in days 1 and 2. Data are presented as the mean from four independent experiments ± SEM. (C) Fertility was reduced at the glucose stress threshold (250 mm glucose, orange bars) and in the presence of toxic glucose levels (333 mm glucose, blue bars) in three different null alleles of ogt-1. A total of 250 mm supplemental glucose reduced brood size in ogt-1 mutants 40–70% and 333 mm glucose reduced brood size 70–95%, indicating that OGT-1 is required for fertility in the presence of glucose stress. Data are presented as the mean from two to four independent experiments ± SEM.
Since ogt-1 null mutants cannot O-GlcNAcylate proteins in response to excess glucose, we hypothesized that these mutants would be hypersensitive to glucose toxicity and have a lower threshold for glucose stress. Although wild-type animals were fully fertile at glucose concentrations up to 250 mm, the ogt-1(ok430) null mutant was subfertile in the presence of glucose stress. This reduction in fertility was observed at each concentration tested, from 50 to 500 mm supplemental glucose (Figure 2A). In addition, the magnitude of the fertility decrease was greater in ogt-1(ok430) at the toxic concentrations of glucose, 333 mm glucose (94% reduction in brood size vs. 25% in N2) and 500 mm glucose (97% reduction vs. 60% in N2). Although 250 mm glucose stress affected fertility differently in ogt-1 compared to wild-type or oga-1 animals, the effect of glucose stress on reproductive timing was strain independent, with a shift in the reproductive profile observed at 250 mm glucose (Figure 2B).
To ensure that reduced fertility in response to glucose stress was specific to the absence of OGT-1, we tested three different null alleles of ogt-1. We observed a 40–60% reduction in brood size in the presence of glucose stress in all three null alleles of ogt-1 at the glucose stress threshold (250 mm glucose) and a 70–95% reduction in brood size in the presence of toxic levels of glucose (333 mm glucose; Figure 2C). This shift in the glucose toxicity profile strongly suggests that OGT-1 is necessary for the wild-type response to glucose stress.
The insulin-signaling pathway responds to glucose stress:
Previous work in our laboratories showed that one of the key targets of O-GlcNAc cycling is the insulin-signaling pathway (Hanoveret al. 2005; Forsytheet al. 2006; Loveet al. 2010). Since insulin signaling responds to glucose levels in mammalian systems, we tested the effects of glucose stress on C. elegans insulin signaling and the role of O-GlcNAc cycling in this response. Mutations in the C. elegans insulin-like receptor, daf-2, lead to the alternative dauer larval stage, increased life span, and decreased fertility (reviewed in Landis and Murphy 2010). The level of insulin signaling can be regulated in a daf-2(e1370) mutant by varying the temperature: as temperature increases, insulin signaling decreases, and the characteristic daf-2 phenotypes become more severe.
We first assayed how glucose stress influenced protein O-GlcNAcylation in the presence of reduced insulin signaling. We tested these effects at two levels of insulin-like signaling in daf-2 mutants: at 20°, when daf-2 insulin signaling is intermediate to high (few, if any dauers are formed), and at 25°, when daf-2 insulin signaling is very low (essentially all animals enter dauer). Twenty degrees was selected as the intermediate signaling condition for this experiment because at temperatures between 20° and 23.5°, oga-1 and ogt-1 regulate daf-2 dauer entry (Hanoveret al. 2005; Forsytheet al. 2006) (Figure 5C). Similar to the effects in a wild-type background, threshold levels of glucose stress caused an increase in protein O-GlcNAcylation in the daf-2 mutant, independent of the level of insulin signaling (∼2- to 2.4-fold increase compared to control; Figure 3). However, the loss of oga-1 had dramatic effects on protein O-GlcNAcylation levels when insulin signaling was reduced. In dauer animals, protein O-GlcNAcylation was increased >40-fold in daf-2;oga-1 mutants compared to daf-2 mutants (Figure 3). This is consistent with reports that daumone treatment increases protein O-GlcNAcylation (Leeet al. 2010) and may reflect reduced protein turnover rates in dauer animals (Burnellet al. 2005; Joneset al. 2010). Interestingly, although glucose stress resulted in a slight increase in O-GlcNAcylation in the daf-2;oga-1 background, the magnitude was much less than that observed in the wild-type background (compare Figure 1F to Figure 3B), which may suggest an altered steady state in the absence of insulin signaling.
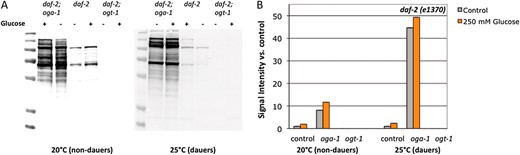
O-GlcNAcylation is responsive to glucose stress and insulin signaling. (A) Extracts of C. elegans daf-2(e1370), daf-2;oga-1, and daf-2 ogt-1(ok1474) strains grown on control or 250 mm glucose plates at high to intermediate (20°, nondauers) or low (25°, dauers) levels of insulin signaling were subjected to Western blotting with the anti-O-GlcNAc antibody RL2. daf-2 ogt-1 mutants cannot catalyze the O-GlcNAc modification and have no RL2-positive bands; daf-2;oga-1 mutants cannot remove the modification enzymatically and exhibit high levels of O-GlcNAcylation, which were not greatly enhanced by glucose stress. Representative blots are shown. (B) Quantitation of RL2-positive bands. Bar graph of integrated intensity was measured for each lane and normalized to control (daf-2, NGM) at each temperature (20° and 25°).
We tested the effect of glucose stress on daf-2 fertility at two different levels of insulin signaling (intermediate, 22.5°; and very low, 25°) and found that daf-2 mutants are sensitized to glucose stress (Figure 4A). Although oga-1 mutants are not sensitive to 250 mm glucose stress in a wild-type background (Figure 2A), in the daf-2 background, oga-1 mutants had reduced fertility at both the semipermissive (∼40% reduction in brood size) and restrictive (∼70% reduction) temperatures (Figure 4A). Likewise, the fertility decrease observed for ogt-1 mutants in the presence of glucose stress (∼60%; Figure 2C) was exacerbated when insulin signaling was decreased in the daf-2 background (80–95% reduction in brood size in daf-2ogt-1 mutants; Figure 4A).
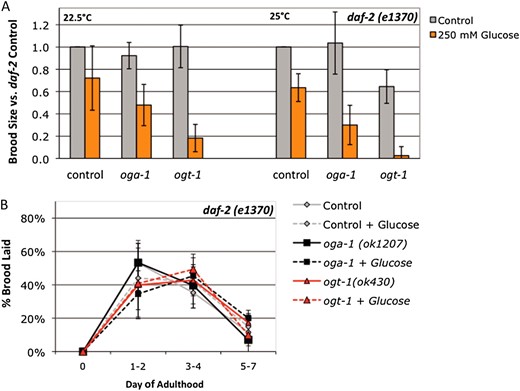
daf-2 is a sensitized background for glucose stress. (A) Brood size was counted on control (gray bars) and 250 mm supplemental glucose (orange bars) plates for daf-2(e1370), daf-2(e1370);oga-1(ok1207), and daf-2(e1370) ogt-1(ok430) strains at 22.5° (semipermissive temperature for insulin signaling) and 25° (restrictive temperature for insulin signaling). The response to glucose was variable for daf-2 mutants: although brood size tended to be lower in daf-2 mutants on glucose plates, the difference was not statistically significant (P > 0.06 by Student’s t-test). Brood size in daf-2;oga-1 mutants was reduced 50% at the semipermissive temperature and 70% at the restrictive temperature on glucose compared to control (P < 0.03). In the daf-2 ogt-1 mutant, brood size was reduced by 80% (semipermissive) and 95% (restrictive) on glucose compared to control (P < 0.02). For both O-GlcNAc cycling mutants, the magnitude of the response to glucose stress was greater when insulin signaling was compromised (compare to Fig. 2A). (B) Glucose stress and O-GlcNAc cycling do not affect daf-2 reproductive timing. On control plates (gray bars), all three strains lay 40–50% of their brood in the first 2 days of adulthood and ∼40% of the brood in days 3 and 4 when insulin signaling is compromised (22.5°). Glucose had little to no effect on this profile. Data are presented as the mean from three to six independent experiments ± standard deviation (SD).
Reproductive timing is delayed in daf-2 mutants (Larsenet al. 1995; Gemset al. 1998), so we tested whether O-GlcNAc cycling or glucose stress affected the reproductive profile. On control plates, ∼40–50% of the brood is laid in the first 2 days of adulthood in a daf-2 mutant, compared to ∼75% in N2 (compare Figure 4B to Figure 2B). O-GlcNAc cycling and glucose stress had little to no effect on reproductive timing when insulin signaling was compromised in the daf-2 background (Figure 4B).
Although decreased fertility and increased dauer formation are characteristic phenotypes of decreased insulin signaling in daf-2 mutants, these phenotypes are separable (Gemset al. 1998; Tissenbaum and Ruvkun 1998). Nutrient availability is a key factor in the dauer entry decision, so we tested how nutrient availability affected daf-2 dauer formation. In the presence of 250 mm glucose stress, daf-2 dauer formation was greatly suppressed (∼80% reduction in dauer formation; Figure 5A). C. elegans diet and metabolism can be regulated by bacterial food source. The two most common Escherichia coli strains used for C. elegans feeding, the B-derived strain OP50 and the K12-derived strain HT115, are known to have variations in nutrient composition (Brookset al. 2009; Reinkeet al. 2010). Glucose stress had a much greater effect on dauer formation with OP50 as the food source compared to HT115 (∼80% vs. 40% decrease in dauer formation; Figure 5A), indicating that both the amount of available nutrients and the relative composition of the diet affect insulin signaling. Combining an HT115 food source with glucose stress did not produce a change in fertility, reproductive timing, or pharyngeal pumping rates compared to an OP50 food source in wild-type animals (data not shown), which suggests that dauer formation is more sensitive to nutrient composition.
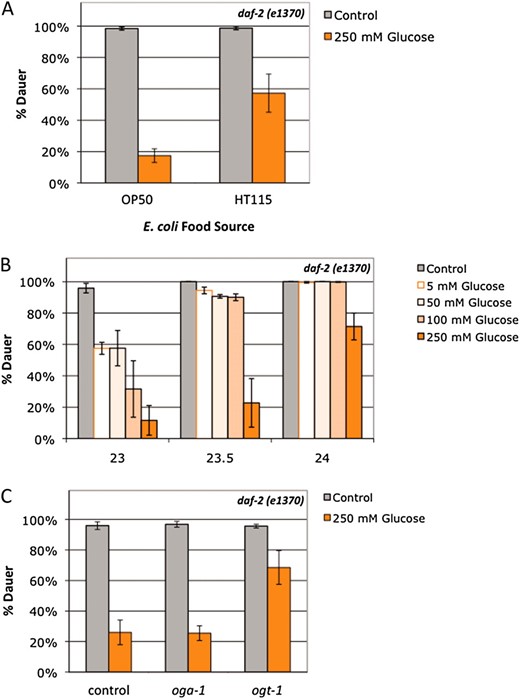
Glucose stress suppresses daf-2 dauer formation in a food source-, concentration-, insulin signaling-, and O-GlcNAc-dependent manner. (A) 250 mm glucose stress (orange bars) reduced dauer formation in the daf-2(e1370) mutant by >80% at 23.5° with E. coli OP50 as the food source (P < 0.001). daf-2 dauer formation is also reduced with E. coli HT115 as the food source (∼40% reduction on glucose compared to control; P < 0.05), but the suppression was threefold stronger on OP50 compared to HT115 (P < 0.04). Data are presented as the mean of four independent experiments ± SEM. (B) Glucose suppression of dauer formation is dependent on the level of insulin signaling (temperature) and glucose concentration. At 23°, daf-2(e1370) dauer formation was suppressed ∼40% by 5–50 mm glucose. The reduction in dauer formation generally correlated with concentration for 100 mm and 250 mm glucose. As the level of insulin signaling goes down with increasing temperature, only 250 mm glucose reduces dauer formation. Data are presented as the mean of two independent experiments ± SEM. (C) Lack of O-GlcNAc blunts insulin signaling in the presence of glucose stress. A total of 250 mm glucose (orange bars) suppressed dauer formation equally in daf-2(e1370) mutants and daf-2(e1370);oga-1(ok1207) mutants (∼70% reduced compared to control) at 23.5°. The level of glucose suppression was decreased in daf-2(e1370) ogt-1(ok430) double mutants (∼30% reduction in dauer formation; P < 0.03 compared to daf-2). Data are presented as the mean of four independent experiments ± SEM.
To characterize the role of glucose stress on dauer formation, we tested a range of glucose concentrations from 0 to 250 mm glucose. Just as the effects of glucose stress on fertility varied with dose, the effect of glucose on dauer formation was also dose dependent; however, dauer formation was much more sensitive to glucose stress. At 23°, concentrations of glucose as low as 5–50 mm suppressed daf-2 dauer formation (∼40% decrease compared to control), and the dauer suppression effect generally correlated with concentration for 100 mm (67% decrease) and 250 mm glucose (87% decrease; Figure 5B). However, just as the effects of glucose stress on fertility varied with the level of insulin signaling (Figure 4A), glucose stress suppressed daf-2 dauer formation in a temperature-dependent manner. At lower levels of insulin signaling (23.5°–24°), concentrations of glucose below the threshold for fertility stress had little to no effect on dauer formation (Figure 5B), and at restrictive temperatures (≥25°), 250 mm glucose had no effect on dauer formation (data not shown). While this study was in progress, Leeet al. reported independently that 111 mm glucose suppressed dauer formation in daf-2 mutants at a semipermissive temperature (22.5°; Leeet al. 2009). Taken together, these data show that daf-2 dauer formation in C. elegans responds to nutrient stress and that this response is dependent on both nutrient availability (glucose concentration and bacterial food source) and the level of insulin signaling.
The daf-2 response to glucose stress depends on O-GlcNAc cycling:
Since glucose stress (Figure 5A) and O-GlcNAc cycling (Hanoveret al. 2005; Forsytheet al. 2006) each affect dauer formation, we tested the effect of combining glucose stress with null mutants of oga-1 or ogt-1 at an intermediate level of insulin signaling (23.5°). Combining glucose stress and increased O-GlcNAcylation had no effect on dauer formation: glucose stress suppressed dauer formation in daf-2 single mutants and daf-2;oga-1 double mutants equally (∼80% decrease compared to control; Figure 5C), despite the higher level of protein O-GlcNAcylation in the daf-2;oga-1 animals (Figure 3). In contrast, glucose stress only weakly suppressed dauer formation when O-GlcNAcylation was lacking in daf-2ogt-1 double mutants (∼30% decrease; Figure 5C), suggesting that insulin signaling does not respond properly to glucose signals in the absence of O-GlcNAcylation. Other nutrient sensing pathways may also be altered in these mutants, as O-GlcNAc cycling and insulin signaling also interact with mTOR, AMPK, and other nutrient sensors (reviewed in Hanoveret al. 2010; Mondouxet al. 2010).
Glucose is not a general suppressor of dauer formation:
Although daf-2 mutant worms can enter dauer in replete nutrient conditions, wild-type C. elegans enter dauer in response to limited environmental nutrients. Therefore, one model consistent with our data would be that nutrient excess is not conducive to dauer entry. In addition to the insulin-signaling pathway, defects in the guanyl cyclase and TGF-β signaling pathways also lead to abnormal dauer formation (Figure 6A) (reviewed in Fielenbach and Antebi 2008). To determine whether the high glucose suppression of dauer was specific to the insulin-signaling pathway, we tested dauer formation in an additional insulin-like receptor mutant, daf-2(e1368), the guanyl cyclase mutant daf-11(m47), the TGF-β receptor mutant daf-1(m40), and the TGF-β ligand mutant daf-7(e1372).
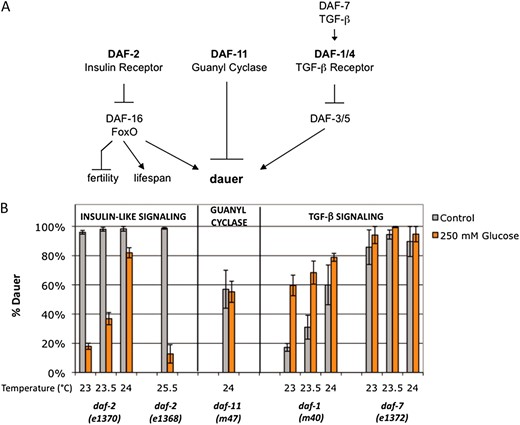
Glucose stress is not a general suppressor of dauer formation. (A) Simplified schematic showing parallel pathways to dauer formation. In addition to the insulin-signaling pathway, guanyl cyclase and TGF-β activity regulate dauer formation in C. elegans. The guanyl cyclase pathway also intersects with the insulin-signaling pathway via regulation of the expression of one of the insulin-like peptides, daf-28, and with the TGF-β pathway via regulation of the ligand daf-7. (B) Glucose stress is not a general suppressor of dauer formation. Glucose stress of 250 mm (orange bars) suppressed dauer formation compared to control (gray bars) in two different insulin-like receptor mutants, the class I daf-2(e1370) mutant (20–80% reduction from 24° to 23°) and the weaker class II e1368 mutant (86% reduction at 25.5°). Glucose stress had no significant effect on dauer formation in daf-11(m47) guanyl cyclase mutants assayed at 24°. Although there is no overall change in daf-11 dauer formation in glucose stress compared to control, the trend varied between experiments. Glucose stress enhanced dauer formation in the daf-1(m40) TGF-β receptor mutant at 23° and 23.5° (3.5- and 2.2-fold enhancement; P < 0.02) but had no significant effect at 24° or in daf-7(e1372) TGF-β ligand mutants. Data are presented as the mean of two to five independent experiments ± SEM.
The daf-2(e1368) allele has a mutation in the extracellular domain of the protein and is weaker than the e1370 allele, which has an intracellular mutation (Patelet al. 2008). A total of 250 mm glucose stress suppressed dauer formation in both the daf-2 insulin-like receptor alleles (Figure 6B). However, there was no change in daf-11 dauer formation in the presence of glucose stress (Figure 6B). Furthermore, glucose stress did not reduce dauer formation in the TGF-β mutants. Dauer formation was enhanced in the presence of glucose stress in the TGF-β receptor mutant daf-1 (Figure 6B). Because this mutant forms fewer dauers than daf-2(e1370) mutants over the same temperature range (17–60% dauer formation compared to 95–100% dauer formation), we also tested an additional TGF-β pathway mutant, daf-7. Although daf-7 mutants have a rate of dauer formation that is similar to that of daf-2(e1370) (85–95% dauer formation; Figure 6B), glucose had no significant effect on dauer formation and there was a slight trend toward enhancement (94–100% dauer formation; Figure 6B). Therefore, glucose stress is not a general suppressor of dauer formation and may be specific to the insulin-signaling pathway. Taken together, these data suggest that glucose stress, O-GlcNAc cycling, and insulin signaling act in the same pathway to regulate dauer formation.
O-GlcNAc cycling and insulin signaling regulate macronutrient storage in response to glucose stress:
Changes in a variety of nutrient-sensing pathways, including O-GlcNAc cycling, regulate macronutrient storage in C. elegans (Hanoveret al. 2005; Forsytheet al. 2006). We tested whether the glucose stress response was characterized by changes in macronutrient storage. In wild-type animals, threshold levels of glucose stress (250 mm glucose) resulted in an accumulation of both trehalose and glucose (Figure 7A and data not shown). Similar to the effects seen with reproductive timing and protein O-GlcNAcylation, increased glucose concentration (333 mm) did not correlate with increased carbohydrate storage. A lack of O-GlcNAc cycling also resulted in an accumulation of both trehalose and glucose (∼1.5- to 2-fold increase compared to N2 control; Figure 7A) (Hanoveret al. 2005; Forsytheet al. 2006; and data not shown). Glucose stress further increased carbohydrate storage when O-GlcNAc cycling was disrupted, especially in the ogt-1 mutant (∼7-fold more glucose compared to N2 control; Figure 7A).
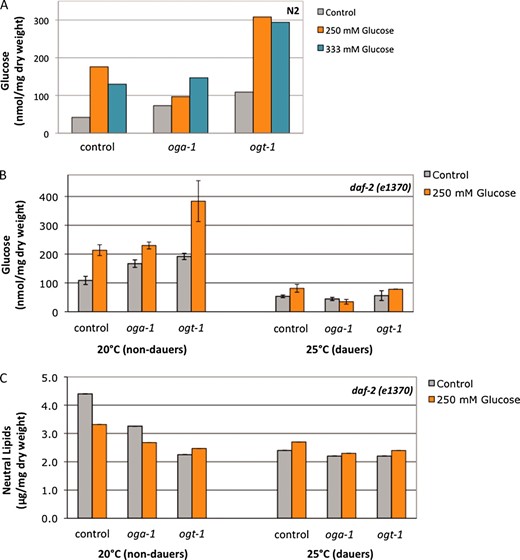
Glucose stress and O-GlcNAc cycling alter carbohydrate and lipid metabolism. (A) Carbohydrate content (nmol/mg dry weight) was measured in the indicated strains grown on control (gray bars), 250 mm glucose (orange bars), or 333 mm glucose (blue bars) at 20°. Glucose stress, oga-1 mutations, and ogt-1 mutations each result in an increase in carbohydrate storage (∼1.5- to 4-fold increase compared to control). At 250 mm glucose, carbohydrate storage is increased in all three strains, but especially in ogt-1 mutants (7-fold increase). Increasing glucose concentrations (333 mm glucose) did not result in a corresponding increase in glucose storage. Representative data are shown. (B) Carbohydrate content (nmol/mg dry weight) was measured in the indicated strains grown in the presence (orange bars) or the absence (gray bars) of glucose stress. All soluble glucose polymers were included in the glucose measurement. At 20° (intermediate to high insulin signaling) and glucose stress, oga-1 mutants, and ogt-1 mutants each result in an increase in daf-2 carbohydrate storage (∼1.5- to 2-fold increase compared to daf-2 control). Glucose stress has no additional effect on daf-2;oga-1 mutants but greatly increases glucose (4.1-fold increase) storage in daf-2 ogt-1 mutants. At 25° (low insulin signaling), overall carbohydrate storage is reduced in daf-2 mutants (2-fold decrease compared to 20°). Loss of O-GlcNAc cycling did not affect carbohydrate storage in dauers. Glucose stress had modest effects on carbohydrate storage in daf-2 and daf-2 ogt-1 mutants (1.5-fold increase compared to control), but had no effect on carbohydrate storage in the daf-2;oga-1 mutant. Data are presented as the mean of two independent experiments ± SEM. (C) Neutral lipid content (μg/mg dry weight) was measured in the indicated strains grown in the presence (orange bars) or the absence (gray bars) of glucose stress. At 20° (intermediate to high insulin signaling), glucose stress, oga-1 mutations, and ogt-1 mutations each result in a decrease in daf-2 lipid storage (∼1.3- to 2-fold decrease compared to daf-2 control). Glucose stress has no additional effect on daf-2 ogt-1 mutants. At 25° (low insulin signaling), overall lipid storage was reduced in daf-2 mutants (1.8-fold decrease compared to 20°). Loss of O-GlcNAc cycling and glucose stress did not affect lipid storage in dauers.
We next tested how carbohydrate and lipid metabolism in the daf-2 mutant was affected by O-GlcNAc cycling and glucose stress at different levels of insulin signaling. Similar to the effects in a wild-type background, when insulin signaling was intermediate to high, a lack of O-GlcNAc cycling or the presence of glucose stress resulted in an accumulation of both trehalose and glucose (Figure 7B and data not shown). Just as we observed in the dauer assay (Figure 5C), glucose stress had similar effects on carbohydrate metabolism in the daf-2 and daf-2;oga-1 mutants (∼1.5-fold increase in trehalose and 2-fold increase in glucose compared to daf-2 control). However, in the daf-2ogt-1 mutant, glucose stress had a more dramatic effect on carbohydrate metabolism, resulting in an ∼3- to 4-fold increase in both trehalose and glucose (Figure 7B).
In contrast to its effects on carbohydrate storage, disrupting O-GlcNAc cycling decreases neutral lipid stores in a wild-type background [1.3- to 2-fold decrease compared to N2 (Hanoveret al. 2005; Forsytheet al. 2006)]. Similarly, at high to intermediate levels of insulin signaling, a lack of O-GlcNAc cycling or the presence of glucose stress resulted in a reduction in neutral lipid stores (1.3- to 2-fold decrease compared to daf-2; Figure 7C). Glucose stress had a similar effect on lipid storage in daf-2 and daf-2;oga-1 mutants (1.3-fold reduction compared to daf-2 control), but had no additional effect on daf-2ogt-1 mutants (Figure 7C).
At low insulin signaling (25°), all of the daf-2 mutant animals enter dauer. Overall carbohydrate storage and neutral lipid storage in the daf-2 dauers was lower compared to those in intermediate signaling (∼2-fold reduction in both soluble glucose and lipids in daf-2 mutants at 25° compared to 20°; Figure 7). O-GlcNAc cycling did not regulate carbohydrate or lipid storage when insulin signaling was low: there was little to no difference in soluble glucose or neutral lipids between daf-2 and daf-2;oga-1 or daf-2ogt-1 mutant strains. Furthermore, glucose stress had no effect on trehalose storage or lipid storage in any of the three strains. Glucose stress also had no effect on glucose storage in the daf-2;oga-1 mutant, and we observed only modest effects on glucose storage in the daf-2 and daf-2ogt-1 mutant strains (≤1.5-fold accumulation of glucose compared to daf-2 control; Figure 7B). Together, these data indicate that glucose stress and O-GlcNAc cycling regulate macronutrient storage in a manner dependent on insulin signaling levels.
DISCUSSION
In diabetic patients, insulin resistance prevents the cellular utilization of glucose, leading to glucose toxicity, which is characterized by chronic cellular and tissue damage. In addition, the frequency of infertility, developmental defects, pregnancy complications, and perinatal mortality is higher in obese and diabetic patients (reviewed in Tsoiet al. 2010; Vimaleswaran and Loos 2010). Like mammals, C. elegans is subject to glucose toxicity, as high levels of glucose lead to reductions in fertility (Lu and Goetsch 1993; Leeet al. 2009) (Figure 1) and life span (Schulzet al. 2007; Leeet al. 2009; Schlottereret al. 2009). The conservation of glucose-responsive pathways, including the insulin-like signaling pathway and the hexosamine signaling pathway, coupled with the ability to control diet and genetic background, make C. elegans an excellent model system for studying the glucose stress response and the genes that determine the threshold for glucose toxicity.
O-GlcNAc cycling is essential for metabolic tolerance to fluctuations in glucose availability:
As our first marker for glucose stress, we chose to assay fertility, which has a large energy cost and is under genetic selection. At the glucose toxicity threshold (250 mm), animals were fully fertile but had a delay in reproductive timing, an increase in protein O-GlcNAcylation, and an increase in carbohydrate storage. That fertility was robust over such a wide range of glucose concentrations indicates that C. elegans has a well-buffered metabolic system for dealing with glucose stress. The buffered glucose stress response requires the O-GlcNAc transferase OGT-1. Animals lacking ogt-1 were subfertile below the threshold concentration of glucose and more adversely affected by the toxic concentrations of glucose compared to wild type, demonstrated by greatly reduced fertility and greatly increased carbohydrate storage. The decrease in fertility is closely correlated to glucose concentration, suggesting that OGT-1 is acting as a nutrient sensor. O-GlcNAc cycling has also been implicated in the response to starvation, as OGT expression increases and OGA expression decreases in response to glucose deprivation (Kreppelet al. 1997; Whisenhuntet al. 2006), indicating that this pathway is finely tuned to maintain homeostasis.
A complex interplay exists between nutrient-driven O-GlcNAc cycling and insulin signaling:
O-GlcNAc cycling is a regulator of insulin signaling phenotypes (Hanoveret al. 2005; Forsytheet al. 2006; Loveet al. 2010), and our results demonstrate that insulin signaling also responds to glucose stress. When insulin signaling was compromised in daf-2 mutants, a role for the O-GlcNAcase OGA-1, which normally has a wild-type glucose toxicity profile, is uncovered, as both oga-1 and ogt-1 mutants are more sensitive to glucose in the daf-2 background. Furthermore, this sensitivity increases as the level of insulin signaling decreases. Similarly, an oga-1 mutation has no effect on dauer formation in a wild-type background but increases dauer formation when insulin signaling is compromised (Forsytheet al. 2006). A role for OGA-1 in life span regulation is also uncovered when insulin signaling is compromised, as oga-1 mutants have a small but significant decrease in life span in a wild-type background, but an increased life span when insulin signaling is compromised (Loveet al. 2010). Together with recent data from mammalian cells (Macauleyet al. 2010), these data indicate that increased protein O-GlcNAcylation contributes to insulin resistance but is not the only determinant and that levels of insulin signaling influence the role of O-GlcNAc cycling and vice versa. Rahmanet al. (2010) also reported that OGA-1 has a role in regulating C. elegans life span dependent on insulin signaling levels. However, they observed that an oga-1 mutation increases life span in a wild-type background, but has no effect when insulin signaling is compromised (Rahmanet al. 2010). We have demonstrated here that O-GlcNAc cycling phenotypes are exquisitely sensitive to both the level of insulin signaling and nutrient composition, small fluctuations in either temperature or feeding conditions could account for these different results.
Several macromolecular changes accompany alterations in O-GlcNAc cycling or exposure to glucose stress, and these changes are also dependent on the level of insulin signaling. When insulin signaling is high (as in wild-type animals), defects in O-GlcNAc cycling result in increased carbohydrate storage, decreased lipid storage, and deregulation of genes necessary for carbohydrate and lipid metabolism (Hanoveret al. 2005; Forsytheet al. 2006; Loveet al. 2010). As the level of insulin signaling decreases, glucose stress severely affects ogt-1 animals, resulting in increased carbohydrate storage and dauer formation and decreased fertility, consistent with a key role for OGT-1 as a nutrient sensor.
Macronutrient availability and insulin signaling are just two of the multiple input pathways that regulate the dauer entry decision. Defects in the TGF-β pathway, which is also nutrient responsive, can lead to dauer formation in the presence of food (Figure 6A) (reviewed in Fielenbach and Antebi 2008). Glucose seems to specifically enhance insulin signaling, as we found that dauer formation was suppressed in daf-2 mutants but unaffected or even enhanced in TGF-β mutants. Although mutations in both the insulin signaling and the TGF-β pathways can lead to dauer entry, these pathways are known to have overlapping but distinct regulatory roles. For example, recovery from dauer seems to require insulin signaling but not TGF-β signaling (Tissenbaumet al. 2000). In humans, both insulin signaling and the TGF-β signaling pathways respond to glucose and are implicated in diseases of glucose toxicity, like diabetes (reviewed in Zhuet al. 2007). Our data demonstrate that these signaling pathways respond differently to nutrient flux, even though both pathways contribute to the same developmental processes (e.g., dauer entry), underscoring the need to model these metabolic processes in genetically tractable systems that allow us to consider the effects of different pathways in combination.
Assessing the levels of macronutrient stores provides a mechanism for integrating the effects of glucose flux and O-GlcNAc cycling on multiple nutrient sensing pathways. In the presence of glucose stress, daf-2 mutants accumulate more carbohydrates and fewer lipids compared to growth on control plates, and dauer formation is suppressed. Animals lacking ogt-1 also accumulate carbohydrates and have reduced lipid stores and reduced dauer formation (Figures 5 and 7) (Hanoveret al. 2005; Forsytheet al. 2006). However, there is not a simple relationship between macronutrient levels and dauer entry. First, daf-2;oga-1 mutants also store more carbohydrates and fewer lipids compared to daf-2 animals, but these double mutants form either the same number or a higher number of dauers compared to daf-2, depending on the level of insulin signaling (this study and Forsytheet al. 2006). Second, combining glucose stress with an ogt-1 mutation had an additive effect on carbohydrate storage, but did not further reduce dauer formation. Rather, an increase in dauer formation was observed when an ogt-1 mutation and glucose stress were combined. Third, animals fed with the E. coli strain HT115 have distinct metabolic profiles compared to OP50-fed animals, including an increase in glucose storage and a reduction in lipid storage (Brookset al. 2009; Reinkeet al. 2010). Similar to an ogt-1 mutation, however, combining HT115 feeding with glucose stress resulted in an increase in daf-2 dauer formation compared to that in OP50-fed animals. This result suggests that in addition to the amount of available nutrients, the composition of the diet influences levels of insulin signaling and mutant insulin-signaling phenotypes in C. elegans. A relationship between diet composition and insulin signaling was recently demonstrated in Drosophila, as amino acid balance was shown to be crucial for optimization of both life span and fecundity independent of overall nutrient levels (Grandisonet al. 2009). Together, these data indicate that macronutrient storage levels may influence the insulin-mediated dauer entry decision, but there is not a linear relationship between glucose storage and dauer entry. Rather, there seems to be a robust range of glucose storage levels that are permissive for reproductive growth, and both low levels of carbohydrate storage (e.g., when insulin signaling is very low) and high levels of carbohydrate storage (e.g., in the presence of glucose stress and the absence of O-GlcNAcylation) can increase dauer formation and decrease fertility.
Macronutrient storage has been implicated in a variety of developmental processes and stress responses in C. elegans, including life span shortening and extension, thermotolerance, osmotic stress resistance, and oxygen sensitivity. Several laboratories have demonstrated that supplemental glucose shortens C. elegans life span, at both high and low levels of insulin signaling (Schulzet al. 2007; Leeet al. 2009; Schlottereret al. 2009). Recently, the glucose disaccharide trehalose, which is elevated in daf-2 and age-1 mutants (Lamitina and Strange 2005; Hondaet al. 2010), has been shown to extend C. elegans life span in a DAF-2–dependent manner (Hondaet al. 2010). Trehalose increases thermotolerance and osmotic stress resistance (Lamitinaet al. 2004; Lamitina and Strange 2005; Lamitinaet al. 2006; Frazier and Roth 2009; Hondaet al. 2010), leading to the hypothesis that this insulin-regulated molecule retards aging by protecting against stress. ogt-1 mutants have increased trehalose storage at both low and high levels of insulin signaling (this study; Hanoveret al. 2005; Forsytheet al. 2006). However, ogt-1 mutants have shortened life spans and decreased resistance to UV stress compared to wild type (Loveet al. 2010), indicating that increased trehalose storage does not slow aging in the absence of O-GlcNAcylation. This fits well with recent data demonstrating that nutrient sensing pathways can regulate macronutrient storage differently under different conditions. For example, alterations in sugar homeostasis regulate C. elegans survival in hyperosmotic and anoxic conditions; however, opposing macronutrient profiles are associated with distinct stress resistance phenotypes (Frazier and Roth 2009). Furthermore, AMPK activation can either promote or prevent the depletion of fat stores (Narbonne and Roy 2009). Together, these results demonstrate that energy homeostasis is a complex process whereby different storage molecules—even those commonly derived from glucose—have distinct roles in development, fertility, aging, and the response to various types of stress.
Life span, dauer, and fertility show differing sensitivities to glucose excess:
We defined the threshold for glucose toxicity in wild-type worms by assaying fertility; interestingly, life span seems to be less adaptable to changes in glucose concentration. First, the threshold for glucose toxicity in life span assays is 2.8 mm supplemental glucose (Leeet al. 2009), nearly 100-fold less than the threshold for glucose toxicity in the fertility assay. Second, life span does not seem to respond to dose in the way that fertility and dauer formation do, as concentrations of glucose ranging from 2.8 mm to 111 mm glucose reduce mean life span ∼15–25% without correlation to dose (Leeet al. 2009). These data suggest that nutrient buffering systems allow robust fertility over a range of glucose concentrations, whereas those same glucose levels result in a sharp decline in life span. This could occur in several ways. Different tissues may have different sensitivities to nutrient flux. Insulin signaling is implicated in both fertility and life span, but fertility is regulated by insulin-like activity in the germline (Michaelsonet al. 2010) whereas life span is regulated by activity in neurons and intestine (Apfeld and Kenyon 1998; Wolkowet al. 2000; reviewed in Fielenbach and Antebi 2008). Alternatively, or in combination, nutrient buffering systems may be active in young adults but lacking or overwhelmed in older animals.
Homeostatic adaptations to nutrient excess and deregulation in diseases of aging:
Disrupting O-GlcNAc cycling leads to changes in insulin signaling and gene expression associated with the regulation of longevity (Hanoveret al. 2005; Forsytheet al. 2006; Loveet al. 2010). Here we have extended these findings to include a role for hexosamine signaling and insulin signaling in the response to glucose excess. These findings in C. elegans may have important implications for the diseases associated with human aging. As humans age, homeostatic control breaks down, and glucose tolerance and insulin responsiveness decrease. During reproductive years, diabetes negatively affects both male and female fertility, as well as prenatal development. As glucose consumption has increased across all stages of life in the human population, it is important to understand which genes and pathways respond to nutrients and how those pathways regulate different processes at different stages.
Different systems share common biochemical pathways that sense and respond to nutrients, but that response may vary with tissue, developmental stage, or genetic background. In C. elegans, we observed that glucose stress had opposing effects on dauer formation in insulin-like signaling mutants and TGF-β signaling mutants. In mammals, two key regulators of glucose homeostasis, AMPK and mTOR, also have different specificities. AMPK activation regulates glucose homeostasis in the liver and disrupts the energy balance in the brain, whereas mTOR activation disrupts homeostasis in the liver and favors homeostasis in the brain (reviewed in Lam 2010). All of these nutrient-responsive pathways are connected to the O-GlcNAc cycling pathway (reviewed in Hanoveret al. 2010; Mondouxet al. 2010). Understanding which genes and pathways respond to nutrients; how they distinctly regulate growth, fertility, and aging; and how these are influenced by genetic background will be necessary if we are to develop appropriate strategies and therapeutics to deal with the pressures of nutrient stress.
Acknowledgements
We thank Thomas Brodigan for technical assistance and members of the Krause and Hanover laboratories for helpful discussions. This research was supported by the Intramural Research Program of the National Institutes of Health, National Institute for Diabetes and Digestive and Kidney Diseases.
Footnotes
Communicating editor: K. Kemphues
