


Abstract
The advent of next generation sequencing technologies allows one to discover nearly all rare variants in a genomic region of interest. This technological development increases the need for an effective statistical method for testing the aggregated effect of rare variants in a gene on disease susceptibility. The idea behind this approach is that if a certain gene is involved in a disease, many rare variants within the gene will disrupt the function of the gene and are associated with the disease. In this article, we present the rare variant weighted aggregate statistic (RWAS), a method that groups rare variants and computes a weighted sum of differences between case and control mutation counts. We show that our method outperforms the groupwise association test of Madsen and Browning in the disease-risk model that assumes that each variant makes an equally small contribution to disease risk. In addition, we can incorporate prior information into our method of which variants are likely causal. By using simulated data and real mutation screening data of the susceptibility gene for ataxia telangiectasia, we demonstrate that prior information has a substantial influence on the statistical power of association studies. Our method is publicly available at http://genetics.cs.ucla.edu/rarevariants.
OVER the past few years, genome-wide association studies (GWAS) have identified many disease-causing variants (Corder et al. 1993; Bertina et al. 1994; Altshuler et al. 2000). Most of these studies are conducted by collecting common variants and perform a series of single-marker tests where each variant is tested individually to discover associations. However, only a small portion of disease heritability is explained by common variants, and several recent studies consider rare variants that collectively affect diseases (Cohen et al. 2004; Fearnhead et al. 2004; Kryukov et al. 2007; Romeo et al. 2007; Blauw et al. 2008; Bodmer and Bonilla 2008; Gorlov et al. 2008; International Schizophrenia Consortium 2008; Ji et al. 2008; Walsh et al. 2008; Xu et al. 2008). Since each rare variant is present in only a small number of individuals, single-marker tests have low power to identify these variants involved in disease. Hence, groupwise association tests that group rare variants in genes have received considerable attention as methods that increase the power of studies on rare variants, and a number of methods have been proposed such as the cohort allelic sums test (CAST) (Morgenthaler and Thilly 2007), the combined multivariate and collapsing (CMC) method (Li and Leal 2008), a weighted-sum statistic (Madsen and Browning 2009), and recently a variable-threshold approach (Price et al. 2010).
A groupwise association test is more complex than a single SNP association because there are many different ways of combining information across multiple variants. How the information from different variants is combined affects the statistical power of the association test, which also depends on the actual effect sizes of the variants on the disease phenotype. The challenge in developing groupwise association testing methods is that the underlying disease-risk model is not known.
In this article, we focus on a disease-risk model that is motivated by filling a blind spot in traditional GWAS. In this model, all variants including common variants make an equally small contribution to disease risk; that is, rarer variants are assumed to have higher effect sizes than common variants. Since each variant contributes only a small amount to the total disease risk, the single-marker test is not likely to detect associations in this disease-risk model, and thus this model describes associations usually not found in traditional GWAS. This is the same model discussed in Madsen and Browning (2009). Under this model, a weighted-sum statistic by Madsen and Browning (MB) is shown to be more powerful than other grouping methods such as CAST and CMC (Madsen and Browning 2009).
We propose a new method for the groupwise association test called the rare variant weighted aggregate statistic (RWAS). RWAS computes a weighted sum of differences between case and control mutation counts where weights are estimated from data to increase power of studies. The optimal weights that maximize the power can be derived when the effect sizes of variants are known. When the true effect sizes are not known, RWAS approximates the optimal weights under the assumption that each variant makes an equal contribution to population disease risk. Simulations show that RWAS outperforms MB and the approximated weights achieve nearly the same power as the optimal weights under this assumed disease model. We also show how prior information on whether a variant is likely to be involved in a disease can be incorporated into RWAS. We first show through simulations that prior information greatly influences the statistical power of studies. Then, by using the real mutation screening data of the susceptibility gene for ataxia telangiectasia along with information of how likely a variant is to be deleterious (Tavtigian et al. 2009), we demonstrate that prior information plays a key role in this association study and RWAS is able to successfully detect the association in real data. The software package implementing RWAS is publicly available at http://genetics.cs.ucla.edu/rarevariants.
METHODS
Optimal weighted aggregate statistic:
We consider an association study in which multiple variants within a gene affect the trait. For each variant, a difference in mutation counts between case and control individuals is computed, and a weighted sum of differences is used as a statistic for the group. This is in fact equivalent to computing a weighted sum of z-scores of variants where the z-score of a variant is computed from an allele frequency difference between cases and controls (Eskin 2008; Han et al. 2008; Zaitlen et al. 2010).
The greatest power is achieved when the NCP is maximized, which is equivalent to maximizing the term. Using the Cauchy–Schwartz inequality, the NCP is maximized when wi = λi. Therefore, the optimal weight for variant i is λi, and we call the weighted association method based on the optimal weights the optimal weighted aggregate statistic (OWAS). The OWAS is optimal under any disease-risk models, but determining optimal weights requires knowledge of relative risk and population MAF of variants according to the definitions of and (Equations 2–4). We can estimate the population MAF from observed MAF of case and control individuals (see supporting information, File S1 for details), but obtaining or estimating relative risk is often not easy. We note that if the numbers of cases (N+/2) and controls (N−/2) are unequal, we replace above with and replace and in Equations 1 and 2 with and , respectively, and the above results hold.
RWAS:
Approximation of MB to a sum of z-scores:
RWAS with prior information:
RWAS can be directly extended to incorporate prior knowledge about the degree that each variant is believed to be causal. Note that the underlying truth is that each variant is either causal or not. Thus, let Vi be the variable indicating the “causal status” of variant i, such that Vi = 1 if variant i is causal and Vi = 0 if not. Let V = {V1, … , VM} denote the causal statuses of all M variants. V can have 2M possible values. Let υj be the jth value of 2M possible values. That is, is an ordered set of 0 and 1 that represents a specific scenario of causal statuses.
Web resources:
The software package for RWAS is publicly available online at http://genetics.cs.ucla.edu/rarevariants.
RESULTS
Power comparison between RWAS and MB:
We evaluate the power of our novel method, RWAS, in the constant PAR disease-risk model where all variants have the same PAR. This was the model used to estimate the power of MB, and MB was shown to be more powerful than other competing methods (Madsen and Browning 2009). Throughout all experiments, we use the sum of genetic scores of case individuals as a statistic for MB, rather than using the sum of ranks of cases suggested by Madsen and Browning. One reason is that both sums yield similar results (Madsen and Browning 2009), and another reason is that the sum of genetic scores allows RWAS and MB to be compared in the same sum of z-scores framework (see methods for approximation of MB to a sum of z-scores method). The power of RWAS is also compared to the power of OWAS that is the optimal weighted sum of z-scores and from which the weights of RWAS are derived. OWAS uses the effect sizes of variants for its weights, and hence the power of OWAS can be thought of as the upper bound of power that can be achieved in the weighted sum of z-scores approach. In this experiment, OWAS knows the group PAR that generated data sets (see below), computes relative risk of each variant using Equation 6, and estimates population MAF as described in File S1.
We use exactly the same simulation parameters as in Madsen and Browning to estimate the power of methods. In the simulations, a total of 10,000 data sets are generated, each with 1000 case and 1000 control individuals having 100 variants. The power of a method is estimated as the number of significant data sets among the 10,000 data sets using a significance threshold of 2.5 × 10⁻⁶ based on the Bonferroni correction assuming 20,000 genes genome-wide. Among 100 variants, 50 variants are disease-risk contributing variants (D variants) and 50 variants are disease-risk neutral variants (N variants). For each variant, we sample its MAF in controls using Wright's formula (Wright 1931; Ewens 2004) with the same parameter values as in Madsen and Browning (see Madsen and Browning 2009 for details). According to Equation 6, relative risk of D variants is calculated from MAF of variants in controls and the marginal PAR that is the group PAR divided by the number of D variants while relative risk of N variants is 1. MAF of variants in cases can then be calculated using relative risk and MAF of variants in controls according to Equation 3. We independently sample mutations of each variant in case and control individuals according to its MAF in cases and controls, respectively.
The results of power simulations demonstrate that RWAS consistently outperforms MB when the group PAR varies from 1% to 5% (Figure 1). For example, at the group PAR of 3%, RWAS has 78% power while MB has 40% power. The power simulations also show that the power of RWAS is very close to the power of OWAS. Although OWAS has higher power than RWAS at all group PAR levels, the difference in power between the two methods is small; the power of RWAS is ∼2–4% smaller than that of OWAS. Therefore, the analytical approximation of the optimal weights in RWAS reduces its power by only a small amount in this disease model, and it can achieve high power even if it is not given the true effect sizes of variants.
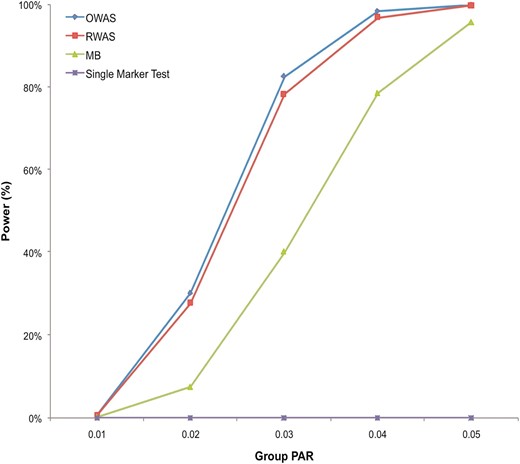
Power comparison in the constant PAR model. There are five group PAR levels (1%, 2%, 3%, 4%, and 5%), and for each group PAR, 10,000 data sets were generated. Each data set contained 1000 case and 1000 control individuals having 100 variants (50 D variants and 50 N variants). Four different methods (RWAS, OWAS, MB, and the single-marker test) were tested, and their power was estimated as the number of significant data sets among the 10,000 data sets using a significance threshold of 2.5 × 10⁻⁶.
Type I error rates of RWAS and OWAS:
To check whether type I error rates (false positive rates) of RWAS and OWAS are correctly controlled, we create 100 million data sets without any causal variant. Each data set has 1000 cases and 1000 controls with 100 variants, and we measure type I error rates of RWAS and OWAS on the 100 million null data sets under three different significance thresholds: 0.05, 0.01, and 2.5 × 10⁻⁶. The reason why we use a very large number of data sets is because the significance threshold for power is very low (2.5 × 10⁻⁶). The proportion of significant data sets is an estimate of the type I error rate for each method.
The type I error rates for RWAS are 0.0503, 0.0089, and 1.2 × 10⁻⁷, and those for OWAS are 0.0502, 0.0091, and 1.8 × 10⁻⁷ for the significance thresholds of 0.05, 0.01, and 2.5 × 10⁻⁶, respectively. This indicates that the type I error rates are correctly controlled for RWAS and OWAS when the significance thresholds are 0.05 and 0.01. When the significance threshold is 2.5 × 10⁻⁶, RWAS and OWAS both have lower type I error rates than the expected rate.
Power of RWAS with the different numbers of variants:
Since the number of variants in a gene may be >100, we evaluate effects of the number of variants in a gene on the power of groupwise tests. We create five different data sets with five different numbers of total variants: 100, 200, 300, 400, and 500. In all five data sets, the number of causal variants is 50, and the group PAR is 3%. The number of case and control individuals is the same as in the previous experiment.
Figure 2 shows that as the number of total variants in a gene increases, the power of all methods decreases. For example, when a gene contains 100 variants, RWAS achieves 78% power while it has 6% power when there are 500 variants in a gene. This is because there are more noncausal variants in a gene as the number of variants increases. A large number of noncausal variants reduce our ability to detect causal variants and power of the groupwise tests.
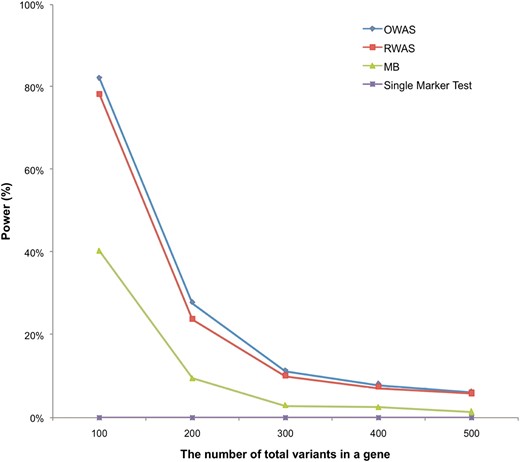
Power comparison with the different numbers of total variants in a gene. We simulated five different numbers of total variants: 100, 200, 300, 400, and 500. All simulations had 50 causal variants, the group PAR of 3%, and 1000 case and 1000 control individuals. We created 10,000 data sets for each of five different simulations. The plot shows the power of RWAS, OWAS, MB, and the single-marker test.
Power of RWAS with prior information:
Prior information can reduce or remove the influence of noncausal variants, and in this experiment we observe how prior information influences the power of RWAS. The prior information we consider is the probability of a variant being causal to a disease, denoted as ci. We generate data sets with predefined true ci values, and we evaluate how the power of RWAS changes when different prior information is given to RWAS. We first generate data sets that contain 100 variants split into two groups, each with 50 variants. We set ci of the first group to 0.8 and ci of the second group to 0.2. Then, five different types of prior information are given to RWAS: (1) “correct ci” that is equivalent to true ci of data sets, (2) “uniform incorrect ci” in which ci = 1 for all variants, (3) “three-fourths correct ci” that corresponds to three-fourths of true ci of the first and second groups, (4) “one-half correct ci” that matches one-half of true ci of the first and second groups, and (5) “very incorrect ci” in which ci of the first and second groups is 0.2 and 0.8, respectively, which is opposite to true ci of data sets. The single-marker test and MB are also tested to compare their power to RWAS.
We follow the same experimental framework as in the previous experiment in this power simulation with two changes. The first change is that we have two different ci values assigned to the two groups of variants as mentioned earlier. For each data set, a variant is causal with the probability proportional to its ci. Relative risk of a causal variant is given by Equation 6 whereas a noncausal variant has relative risk of 1. The other change is that the same set of control MAFs is assigned to the two groups: MAFs of 50 variants in control individuals are sampled using Wright’s formula and assigned to each group. The reason is that we want to observe only the effect of prior information on the power of studies, but the power is also dependent on MAF of variants.
Results show that the power of RWAS with correct ci is always the highest among different prior information applied to RWAS (Figure 3). By knowing the correct prior information, the power increases as much as 7%; at the group PAR of 3%, the power of RWAS with correct ci is 84% while the power of RWAS with uniform incorrect ci is 77%. However, if RWAS is given incorrect prior information, it may suffer power loss as the power of RWAS with very incorrect ci is >70% lower than the power of RWAS with correct ci at the group PAR of 3% and 4%. This shows that when prior information is not very accurate, RWAS may achieve higher power by assuming that every variant is causal. The results also indicate that as RWAS is given more correct prior information, its power increases: the power of RWAS with three-fourths correct ci is higher than the power of RWAS with one-half correct ci. Results of the experiment demonstrate that prior information may considerably influence the power of studies and higher power can be achieved by knowing correct prior information.
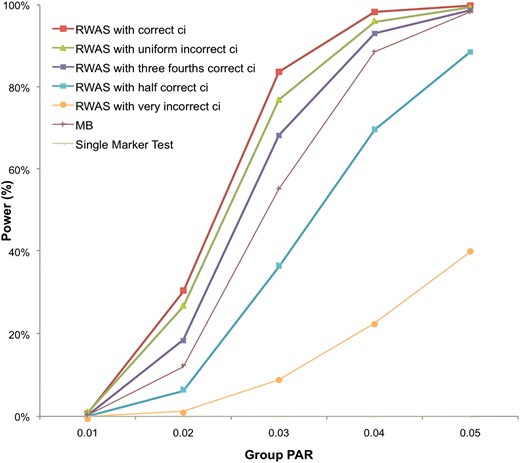
Power of RWAS with different prior information. For each group PAR, 10,000 data sets were generated, and each data set contained 1000 case and 1000 control individuals having 100 variants with predefined true ci values. ci of 50 variants was 0.8, and ci of the other 50 variants was 0.2. Five different types of prior information were given to RWAS: “correct ci” (same ci as true ci of data sets), “uniform incorrect ci” (ci = 1 for all variants), “three-fourths correct ci” (three-fourths of true ci), “one-half correct ci” (one-half of true ci), and “very incorrect ci” (opposite ci to true ci of data sets). The single-marker test, MB, and RWAS with the five different types of prior information were tested.
RWAS with prior information on real mutation screening data:
To evaluate RWAS and effects of prior information on real sequencing data, we use mutation screening data of the susceptibility gene for ataxia telangiectasia (Tavtigian et al. 2009). This gene is called ATM, and it is also known as an intermediate-risk gene for breast cancer. Tavtigian et al. (2009) collected data from seven ATM mutation screening studies in breast cancer cases and controls as well as data from their own mutation screening, which resulted in collecting 2531 case and 2245 control individuals (called “bona fide case–control studies”). They further increased the number of cases and controls by adding 17 case-only or control-only mutation screening studies, but we focus on the bona fide case–control studies in our experiment because adding the case-only and control-only studies does not yield substantial changes in results (Tavtigian et al. 2009).
Tavtigian et al. discovered 170 rare missense variants in the ATM data set and used the missense analysis programs, Align-GVGD (Tavtigian et al. 2006) and SIFT (Ng and Henikoff 2003), to find how likely each variant is to be deleterious. Align-GVGD categorizes variants into seven grades: C0 (most likely neutral), C15, C25, C35, C45, C55, and C65 (most likely deleterious). Since the absolute deleteriousness of grades is not reported, we arbitrarily assign ci of 0.05, 0.2, 0.35, 0.5, 0.65, 0.8, and 0.95 to the seven grades, respectively. SIFT yields scores for variants ranging from 1.00 (most likely neutral) to 0.00 (most likely deleterious) in steps of 0.01. There is a predefined threshold (0.05) in SIFT scores such that variants whose SIFT scores are ≤0.05 are considered deleterious while other variants are considered neutral. Hence, we assigned ci of 1 to variants with SIFT scores ≤0.05 and ci of 0 to other variants.
We first apply RWAS to the case–control studies without prior information, and RWAS yields a P-value of 0.3946. The P-value indicates no significant difference in mutation counts between cases and controls, and Tavtigian et al. also reported that they did not find a significant association by comparing frequency in cases vs. controls or by using CMC (Tavtigian et al. 2009). However, when RWAS is applied with prior information from Align-GVGD, it yields a P-value of 0.0078, which indicates a significant association between rare variants and the disease. The result is consistent with the results of Tavtigian et al. (2009); a significant P-value was obtained by performing a log-linear trend test with output of Align-GVGD. Therefore, this suggests that prior information may be useful in association studies and that RWAS can be applied to detect an association in real data.
Interestingly, RWAS reports a nonsignificant P-value of 0.0881 when using SIFT scores as prior information while Tavtigian et al. (2009) found a significant association with SIFT scores. It may be because the binary classification of variants according to SIFT scores is not as informative as output of Align-GVGD in predicting how likely each variant is to be causal. In other words, variants that are considered deleterious (SIFT scores ≤0.05) may be deleterious to different degrees, but SIFT scores do not capture this. The relative degree of a variant’s deleteriousness is important in RWAS because more deleterious variants receive higher weights. Hence, this experiment shows that methods to determine prior information of variants play a key role in the real data analysis, and different prior information may yield different results.
DISCUSSION
In this article, we presented the RWAS to detect associations with a group of rare variants. We first developed the OWAS that maximizes the power of studies under the weighted sum of z-score statistics, but we need to know the effect sizes of variants to use OWAS. We then developed RWAS by analytically approximating the optimal weights, and it can be applied without the knowledge of effect sizes. The simulations demonstrate that RWAS outperforms a weighted sum statistic by Madsen and Browning (2009) in the same disease-risk model discussed in Madsen and Browning (2009). The simulations also show that the power of RWAS is very close to the power of OWAS, suggesting that RWAS achieves nearly optimal power in the disease-risk model we focused on.
We then extended RWAS to incorporate prior information of variants, and we considered the probability of a variant being causal to a disease as prior information in this article. To determine effects of prior information on association studies, we used both simulated data and real mutation screening data for the susceptibility gene for ataxia telangiectasia. The results of simulated data show that power can be increased by incorporating correct prior information, and this is confirmed in the real data since RWAS is able to detect an association in the real data with prior information while it is not able to do so without the information. Hence, this suggests that it would be advantageous to incorporate prior information into association studies and RWAS can be used to find associations in such association studies.
Many studies suggest that rare variants are not in linkage disequilibrium with each other (Pritchard 2001; Pritchard and Cox 2002; Li and Leal 2008). To compute the P-values, our statistic assumes that these variants are independent. However, in the case that the rare variants are linked, we can apply a permutation test to obtain P-values to apply the method.
Acknowledgements
J.H.S., D.H., B.H., and E.E. are supported by National Science Foundation grants 0513612, 0731455, 0729049, and 0916676 and National Institutes of Health grants K25-HL080079 and U01-DA024417. B.H. is supported by a Samsung Scholarship. This research was supported in part by the University of California, Los Angeles subcontract of contract N01-ES-45530 from the National Toxicology Program and National Institute of Environmental Health Sciences to Perlegen Sciences.
Footnotes
Communicating editor: F. Zou
LITERATURE CITED
Author notes
Supporting information is available online at http://www.genetics.org/cgi/content/full/genetics.110.125070/DC1.
