


Abstract
Carbon dioxide (CO2) sensing and metabolism via carbonic anhydrases (CAs) play pivotal roles in survival and proliferation of pathogenic fungi infecting human hosts from natural environments due to the drastic difference in CO2 levels. In Cryptococcus neoformans, which causes fatal fungal meningoencephalitis, the Can2 CA plays essential roles during both cellular growth in air and sexual differentiation of the pathogen. However the signaling networks downstream of Can2 are largely unknown. To address this question, the present study employed comparative transcriptome DNA microarray analysis of a C. neoformans strain in which CAN2 expression is artificially controlled by the CTR4 (copper transporter) promoter. The PCTR4∷CAN2 strain showed growth defects in a CO2-dependent manner when CAN2 was repressed but resumed normal growth when CAN2 was overexpressed. The Can2-dependent genes identified by the transcriptome analysis include FAS1 (fatty acid synthase 1) and GPB1 (G-protein β subunit), supporting the roles of Can2 in fatty acid biosynthesis and sexual differentiation. Cas3, a capsular structure designer protein, was also discovered to be Can2-dependent and yet was not involved in CO2-mediated capsule induction. Most notably, a majority of Can2-dependent genes were environmental stress-regulated (ESR) genes. Supporting this, the CAN2 overexpression strain was hypersensitive to oxidative and genotoxic stress as well as antifungal drugs, such as polyene and azole drugs, potentially due to defective membrane integrity. Finally, an oxidative stress-responsive Atf1 transcription factor was also found to be Can2-dependent. Atf1 not only plays an important role in diverse stress responses, including thermotolerance and antifungal drug resistance, but also represses melanin and capsule production in C. neoformans. In conclusion, this study provides insights into the comprehensive signaling networks orchestrated by CA/CO2-sensing pathways in pathogenic fungi.
CARBON dioxide (CO2) sensing, transport, and metabolism are critical in survival, proliferation, and differentiation in diverse microbes, including pathogenic fungi (Bahn and Mühlschlegel 2006). Opportunistic fungal pathogens exposed to ambient air in a natural environmental setting must overcome dramatic changes in CO2 levels during infection (150-fold change from 0.036 to 5%). In Candida albicans, which causes superficial and systemic candidiasis in immunocompromised patients, high CO2 levels induce the morphological transition from yeast to hypha that is an important virulence attribute contributing to tissue adhesion and invasion of the pathogen (Sims 1986; Mock et al. 1990). Recently it has been reported that CO2 sensing by C. albicans is mediated by adenylyl cyclase, which produces cAMP, thereby activating protein kinase A (PKA) to trigger filamentous growth (Klengel et al. 2005). Another striking example of fungal CO2-mediated signaling has also been demonstrated in Cryptococcus neoformans, which causes fatal fungal meningoencephalitis in both immunocompetent and immunocompromised individuals. High CO2 levels enhance antiphagocytic polysaccharide capsule production during infection (Granger et al. 1985; Vartivarian et al. 1993) and inhibit sexual differentiation by blocking cell–cell fusion via repression of pheromone production (Bahn et al. 2005).
During CO2 sensing and metabolism, carbonic anhydrase (CA), a zinc-containing metalloenzyme, is the key enzyme that catalyzes hydration of CO2 and produces bicarbonate (HCO3−) and a proton (H+). Since the soluble form of CO2, bicarbonate, is likely to be a key intracellular CO2 signaling molecule as well as a substrate for diverse carboxylating enzymes essential for lipid, amino acid, and pyrimidine synthesis, CAs are considered to play pivotal roles in the metabolic process. CA is ubiquitously found in all organisms, catalyzing diverse cellular processes including carbon fixation in plants, and tumor development, respiration, pH and ion homeostasis, and electrical activity in the retinal and nervous systems in mammals (Bahn and Mühlschlegel 2006). The CA enzyme family can be broadly grouped into four classes: α-CA, β-CA, γ-CA, and δ-CA (for reviews, see Henry 1996; Tripp et al. 2001). The α-CAs are widely distributed in bacteria, plants, and mammals. In humans, 14 α-class CAs have been identified including four membrane-associated (IV, IX, XII, and XIV) and extracellularly secreted (VI) CAs. Particularly, CA IV and XIV were found to be extracellular membrane-bound CAs expressed in the lung and brain (Wang et al. 1997; Parkkila et al. 2001).
β-CAs are found in bacteria, algae, plants, and fungi, but not in mammals (Henry 1996; Watson et al. 2003). Fungal β-CA was first characterized in the nonpathogenic model yeast, Saccharomyces cerevisiae, called Nce103, and found to be essential for growth in ambient CO2 levels (Gotz et al. 1999; Clark et al. 2004; Amoroso et al. 2005). The requirement of Nce103 for growth can be relieved by enriching air with 5% CO2 (Amoroso et al. 2005), which appears to result in spontaneous hydration of CO2 into bicarbonate. The role of fungal CA in pathogenic fungi has been recently uncovered in C. albicans and C. neoformans (Bahn et al. 2005; Klengel et al. 2005; Mogensen et al. 2006). C. albicans contains a single functional CA, called Nce103 (Klengel et al. 2005), whereas C. neoformans possesses two CAs, named Can1 and Can2, although the latter is the major form of CA (Bahn et al. 2005; Mogensen et al. 2006). Disruption of genes encoding Nce103 and Can2 causes growth arrest of C. albicans and C. neoformans, respectively, under ambient air conditions (Bahn et al. 2005; Klengel et al. 2005; Mogensen et al. 2006). Normal growth of those CA mutants can be restored by incubating them in either high CO2 conditions or an animal host (Bahn et al. 2005; Klengel et al. 2005). Interestingly, these studies raised the hypothesis that CAs might be directly or indirectly involved in fungal CO2 signaling pathways. In C. albicans, the activity of adenylyl cyclase (AC) to produce cAMP and thus activate the cAMP-signaling pathway is enhanced by bicarbonate (Klengel et al. 2005; Mogensen et al. 2006). In C. neoformans, the mating inhibition by high CO2 can be partially reversed by mutation of the CAN2 gene (Bahn et al. 2005). Therefore, fungal CA is not only crucial for cell survival and proliferation, but also mediates various CO2-related signaling cascades that are important for virulence and differentiation of pathogenic fungi. On the basis of recent analysis of crystal structure of Can2 (Schlicker et al. 2009), Can2 belongs to the “plant-type” β-CA and carries a unique N-terminal extension consisting of four antiparallel α-helices. The N-terminal extension of Can2 appears to interact with the active site entrance of the dimer (Schlicker et al. 2009). Although lipid biosynthesis was found to be one of the essential cellular processes affected by mutation of the CA gene (Bahn et al. 2005), downstream genes and signaling networks regulated by CO2 and CAs remained to be elucidated.
To elucidate downstream target genes of a signaling network, genome-wide comparative transcriptome analysis by using the wild-type (WT) strain and the corresponding mutant strain is normally employed. However, this type of comparative analysis is not appropriate for identifying target genes downstream of Can2 since the can2Δ deletion mutant exhibits severe growth defects under ambient air conditions, and growth restoration of the can2Δ mutant by enrichment with high CO2 will bypass the requirement of Can2 by spontaneous hydration of CO2 into bicarbonate (HCO3−). To circumvent this problem, we constructed a C. neoformans strain in which expression levels of the CAN2 gene are artificially controlled by an alternative promoter system. For this purpose, we used the copper-regulated CTR4 promoter system that has been successfully utilized to conditionally modulate expression levels of genes of interest (Ory et al. 2004; Chayakulkeeree et al. 2007). We employed this strain to elucidate its transcriptome patterns by DNA microarray to identify and characterize genes whose transcript levels are regulated directly or indirectly by Can2 in C. neoformans. This transcriptome analysis discovered a number of CA-dependent genes, including those involved in fatty acid biosynthesis (FAS1), organization of polysaccharide capsule (CAS3), and sexual differentiation (GPB1), although a majority of them do not have any known function. Furthermore, among the Can2-dependent genes, a number of environmental stress-response (ESR) genes and the oxidative stress-responsive Atf1 transcription factor were included, suggesting that differential CA expression could be correlated with stress-response regulation in C. neoformans. Therefore, this study not only elucidates CA-dependent genes on a genome-wide scale for the first time, but also provides further insights into the signaling network of CA/CO2-sensing pathway in pathogenic fungi.
MATERIALS AND METHODS
Strains and media:
The strains used in this study are listed in supporting information, Table S1. All C. neoformans strains were cultured in YPD (yeast extract-peptone-dextrose) medium unless indicated separately. L-DOPA or Niger seed medium for melanin production and agar-based Dulbecco's modified Eagle's (DME) medium for capsule production were all as described (Granger et al. 1985; Alspaugh et al. 1997; Bahn et al. 2004; Hicks et al. 2004).
Construction of the PCTR4∷CAN2 promoter replacement strain:
To replace the native CAN2 promoter with the CTR4 promoter, the CAN2 promoter replacement cassette was generated as follows. The left flanking region [the CAN2 promoter region spanning from −1192 to −376, relative to the ATG start codon (+1 to +3)] and the right flanking region (CAN2 gene, +1 to +1147 region) were PCR amplified with primer pairs B357/B358 and B359/B93, respectively. The underlined sequences of primers B358 and B359 in Table S1 overlap with those of the NAT-CTR4 promoter insert of plasmid pNAT-CTR4-2 (kindly provided by John Perfect, Duke University). The NAT-CTR4 promoter fragment was PCR-amplified with two primers B354 and B355. The CAN2 promoter replacement cassette was generated by overlap PCR with two primers B357 and B93, gel extracted, precipitated onto 600-μg of gold microcarrier beads (0.6 μm, BioRad), and introduced into the serotype A C. neoformans strain H99 strain via biolistic transformation (Davidson et al. 2002). Stable transformants were selected on YPD medium containing nourseothricin (100 mg/liter). The PCTR4∷CAN2 promoter replacement strains were screened by diagnostic PCR and Southern blot analysis using a CAN2-specific probe generated by PCR with primers B359 and B93.
Total RNA isolation:
For total RNA isolation used in DNA microarray analyses, the WT H99 and PCTR4∷CAN2 strains were cultured in 50 ml YPD medium at 30° for 24 hr, washed with sterile PBS buffer twice, and resuspended with sterile water. Then 1 ml of resuspended cells was innoculated into 100 ml of YNB medium (optical density at 600 nm is ∼0.2) and incubated for 12 hr. For zero-time samples, 50 ml out of the 100-ml culture was used. Then 20 ml of the resuspended culture was inoculated into 200 ml of fresh YNB medium containing either 200 μm bathocuproinedisulfonic acid (BCS) for induction of CAN2 or 25 μM copper sulfate (CuSO4) for repression of CAN2, and further incubated for up to 36 hr at 30°. During incubation, 50 ml of the culture was sampled after 6, 12, 24, and 36 hr and used for total RNA isolation. As biological replicates for DNA microarray, three independent cultures for each strain and growth condition were prepared for total RNA isolation. Total RNAs were isolated by using TRizol reagent as previously described (Ko et al. 2009).
DNA microarray and data analysis:
For an experimental set of total RNAs (Cy5 labeling), we used three independent total RNA samples that were isolated from each WT H99 and PCTR4∷CAN2 strain grown for 12 hr in YNB containing either BCS or CdSO4. For control total RNA (Cy3 labeling), all of the total RNAs prepared from WT and PCTR4∷CAN2 strains grown in the conditions described above were pooled (pooled reference RNAs). For cDNA synthesis, Cy5/Cy3 labeling, prehybridization, hybridization, and slide washing, we followed the protocols described previously (Ko et al. 2009). For DNA microarray slides, we utilized C. neoformans serotype D (JEC21) 70-mer oligonucleotide microarray slides containing 7936 spots (Duke University). Three independent DNA microarrays with three independent biological replicates were performed.
The DNA microarray slides were scanned with a GenePix 4100A scanner (Axon Instrument) and the scanned images were analyzed with GenePix Pro (ver. 6.0) and gal file (http://genomeold.wustl.edu/activity/ma/cneoformans/array_spec.cgi). For array data analysis, we used the serotype A gene identification (ID) database that has been mapped to each corresponding 70-mer oligonucleotide sequence printed on the array slides as previously described (Ko et al. 2009). The JEC21 oligomer chip covers 6302 genes of the total 6980 genes in the H99 strain with an e-value 1e−6 (90% coverage) by blastn search. Each S. cerevisiae gene name or ID listed in Table S1, Table S2, Table S3, Table S4, and Table S5 was identified by blastp search with the serotype A gene sequence, (e-value cutoff: e−6). For hierarchical and statistical analysis, data transported from GenePix software were analyzed with Acuity software by employing LOWESS normalization, reliable gene filtering (>95% filtering), hierarchical clustering, zero transformation, ANOVA analysis (P < 0.05), and Excel software (Microsoft).
Construction of the cas3Δ and atf1Δ mutant strains:
The gene disruption cassettes for the CAS3 and ATF1 genes were constructed by double joint PCR with NAT split marker or overlap PCR by using primers listed in Table S1 as previously described (Davidson et al. 2002; Kim et al. 2009). For amplification of NAT marker, plasmid pNATSTM#220 for ATF1 and pNATSTM#122 for CAS3 were used as templates (Table S1). Purified gene disruption cassettes were introduced into the H99 strain by biolistic transformation. Each mutant was screened and confirmed by both diagnostic PCR and by Southern blot analysis.
Northern hybridization:
Northern blot analysis was performed with 10 μg of total RNA from each strain that was used for DNA microarray analysis. Electrophoresis, probe preparation and radiolabeling, hybridization, and development were carried out by following the standard protocols previously described (Ausubel et al. 1994; Ko et al. 2009).
Growth and stress-response assay:
For quantitative growth assays, the WT H99 and PCTR4∷CAN2 (YSB734) strains were cultured overnight at 30° in liquid YPD medium, inoculated into YNB liquid medium containing 200 μm BCS and 25 μm CuSO4, and further incubated at 30° for 6, 12, and 24 hr. After the indicated time of incubation, a portion of the cultures was sampled, serially diluted, spread onto duplicate YPD agar plates, and incubated at 30°. After 2 days, colony-forming units (CFUs) per each plate were determined. Stress and antifungal drug sensitivity tests were performed as previously described (Ko et al. 2009; Maeng et al. 2010).
Capsule and melanin assays:
Qualitative visualization and quantitative measurement of capsule and melanin production was performed as described previously (Bahn et al. 2004). For additional quantitative measurement of capsule size, packed cell volume was also measured by using hematocrit capillary tubes. Briefly, cells grown on DME medium for 2 days were scraped, washed with PBS buffer to remove released polysaccharide, and fixed with 10% formalin. Cell concentration was determined by using hemocytometer and adjusted to 1 × 10⁹ cells/ml with PBS buffer. Forty microliters of the cell suspension was loaded into microhematocrit capillary tubes (Hirschmann Labogeräte, no. 9100275), of which tips were sealed with clay and parafilm to prevent evaporation of medium during incubation. The capillary tubes were placed vertically overnight at room temperature to allow cell packing by gravity. The packed volume of cells was measured by ratio length of packed cell volume phase/length of total volume phase. Two or three independent experiments were performed in triplicate. Statistical difference in relative capsule size between strains was determined by Bonferroni's multiple comparison test by using Prism 4 software (GraphPad).
Microarray data accession number:
The microarray data generated by this study was submitted to the Gene Expression Omnibus (GEO) (http://www.ncbi.nlm.nih.gov/geo/) with accession number GSE21192.
RESULTS
Construction of the PCTR4∷CAN2 strain for artificially controlling of CAN2 expression:
To construct the CAN2 promoter replacement strain, the 375-bp CAN2 promoter region was replaced with the 2-kb fragment of the CTR4 promoter and the NAT dominant selectable maker (Figure 1A). We verified the correct genomic organization of the PCTR4∷CAN2 allele by Southern blot analysis with Xba1/Xho1- or HindIII-digested genomic DNAs (Figure 1B and data not shown). Four independent PCTR4∷CAN2 strains were confirmed and employed for further analyses.
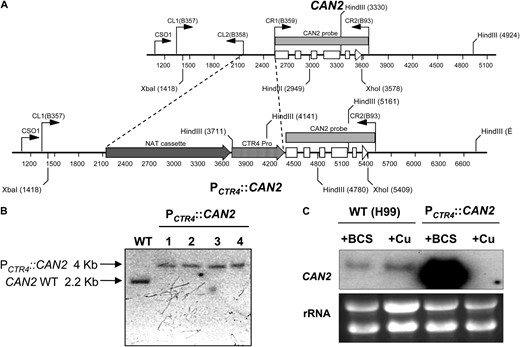
Construction of the PCTR4∷CAN2 promoter replacement strain. (A) The strategy for construction of the CAN2 promoter replacement allele with the CTR4 promoter. The first five exons of the CAN2 gene are illustrated as open boxes and an arrow for exon 6 depicts the direction of transcription. Primers for overlap PCR and diagnostic PCR are indicated as bent arrows. The shaded arrow box illustrates a NAT selectable marker, which consists of ACT1 promoter, NAT (nourseothricin acetyltransferase) gene, and TRP1 terminator, and the shaded, striped arrow box illustrates the CTR4 promoter as previously described (Ory et al. 2004). (B) Verification of the PCTR4∷CAN2 strain by Southern hybridization. Each genomic DNA was digested with XbaI and XhoI and blotted membrane was probed with CAN2-specific probe that was PCR amplified with primers B359 and B93. WT indicates the H99 strain and lanes 1 to 4 indicate the independently isolated PCTR4∷CAN2 strains (YSB733, YSB734, YSB735, and YSB736, respectively). (C) Northern hybridization of the controlled CAN2 expression by the CTR4 promoter. The WT H99 strain and the PCTR4∷CAN2 strain (YSB734) were grown overnight at 30° in liquid YPD medium and subcultured into a fresh YNB liquid medium containing 200 μm BCS (+BCS) and 25 μm CuSO4 (+Cu). After a 12 hr-incubation, a portion of cultures was sampled and its total RNAs was isolated for Northern blot analysis as described in materials and methods.
We further verified whether CAN2 expression levels in the PCTR4∷CAN2 strains are modulated by adding “BCS (a copper chelator) or CuSO4,” which activates or represses the CTR4 promoter, respectively. Northern blot analysis showed that CAN2 expression levels in the PCTR4∷CAN2 strains were strongly induced by addition of BCS and repressed by addition of CuSO4 (Figure 1C), indicating that CAN2 expression levels can be modulated by controlling copper levels in the growth media. CAN2 expression levels in the PCTR4∷CAN2 strains grown in the presence of BCS were even higher than native CAN2 expression levels in the WT strain grown in the presence of BCS (Figure 1C), suggesting that the CTR4 promoter is stronger than the CAN2 promoter under copper-depleted conditions.
The PCTR4∷CAN2 strain exhibited conditional growth defects in response to copper levels:
We addressed whether the growth of PCTR4∷CAN2 strains could be controlled under ambient air conditions by changing copper levels in the medium. The PCTR4∷CAN2 strains did not show any growth defects in YNB medium containing BCS, which activates the CTR4 promoter, whereas the strains exhibited severe growth defects in YNB medium containing CuSO4, which represses the CTR4 promoter (Figure 2A). A normal growth ability of the PCTR4∷CAN2 strains was restored in the presence of high CO2 concentrations (5%) (Figure 2A), further confirming that the growth defects observed in the PCTR4∷CAN2 strains under the copper-depleted conditions were caused by reduced expression of CAN2. The growth defect of the PCTR4∷CAN2 strains was also quantitatively measured in liquid YNB medium containing either BCS or CuSO4 at different time points. In agreement with results described above, the PCTR4∷CAN2 strains also showed growth defects in the liquid YNB medium containing CuSO4, but not BCS (Figure 2B). Taken together, our results demonstrate that CAN2 expression is tightly controlled by the replaced CTR4 promoter, which enables the precise control of C. neoformans growth under ambient air conditions, depending on copper levels in the culture medium.
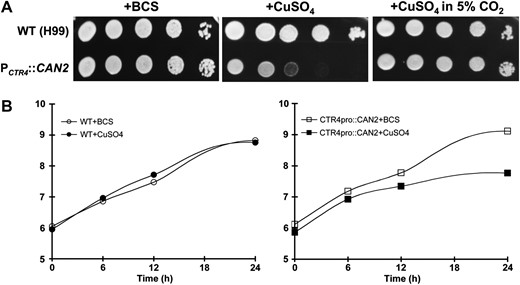
Growth of the PCTR4∷CAN2 strain is tightly controlled by copper levels in a CO2-dependent manner. (A) The wild-type H99 and PCTR4∷CAN2 (YSB734) strains were grown overnight at 30° in liquid YPD medium, 10-fold serially diluted (1–104 dilutions), and spotted (3 μl of dilution) on YNB agar containing 200 μm BCS and 25 μm CuSO4. Cells were incubated at 30° for 24 hr under either normal air or high CO2 conditions (5%) and photographed. (B) Quantitative growth assay of the PCTR4∷CAN2 strain. The wild-type H99 and PCTR4∷CAN2 (YSB734) strains were grown overnight at 30° in liquid YPD medium and inoculated into YNB liquid medium containing 200 μm BCS and 25 μm CuSO4. Cells were incubated at 30° for 6, 12, and 24 hr, and a portion of cultures was sampled, serially diluted, and spread on YPD agar medium for viable cell count. Three independent experiments were performed and one representative graph was demonstrated. All three 12-hr total RNA samples were confirmed for differential CAN2 regulation by Northern hybridization (data not shown) and used for subsequent DNA microarray analysis.
Identification of Can2-dependent genes by comparative transcriptome analysis of the PCTR4∷CAN2 strain and the wild-type C. neoformans:
To identify CA-regulated genes, we performed genome-wide comparative transcriptome analysis of the WT and PCTR4∷CAN2 strains grown in the presence of BCS or CuSO4 by using DNA microarrays as described in materials and methods.
First we compared genome-wide expression profiles of the PCTR4∷CAN2 strains under copper-depleted conditions (+BCS), which showed normal growth patterns with induced CAN2 expression, with those under copper-enriched conditions (+Cu), which showed retarded growth patterns with repressed CAN2 expression. A total of 133 genes (120 genes with serotype A gene ID) exhibited significantly different expression levels (ANOVA, P < 0.05) (Figure 3A). Among these, 9 genes were differentially regulated in the WT strain between BCS and CuSO4-containing media, indicating that these genes are copper-dependent genes. These genes include the SOD1, LAC1, and CTR3 genes. The CTR3 gene that encodes a copper transporter was most downregulated, mainly due to the increased copper concentrations in the growth medium. The SOD1 and LAC1 genes are also known to be induced by copper (Culotta et al. 1995; Jiang et al. 2009). Therefore, a total of 123 genes appeared to be CAN2-dependent genes. Among these, only 10 genes exhibited >1.5-fold induction or reduction when CAN2 is repressed. As expected, the CAN2 gene was the most highly repressed gene (Figure 3B), further verifying the quality of our microarray results. Upregulation of the FUR1 gene, encoding uracil phosphoribosyltransferase, upon repression of the CAN2 gene is notable. Previously we have hypothesized that the can2 mutation inhibits cellular growth by affecting a variety of decarboxylating enzymes that use bicarbonate as a substrate and are required for biosynthesis of lipid, amino acids, and pyrimidines (Bahn et al. 2005). Therefore, it is conceivable that reduced pyrimidine biosynthesis by CAN2 repression allows cells to induce the FUR1 gene, which is one of the genes in the pyrimidine salvage pathway.
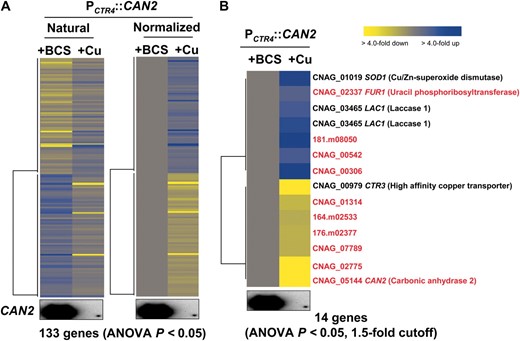
Genes regulated by differential CAN2 expression in the PCTR4∷CAN2 strain. (A) The hierarchical clustering analysis of 133 genes, which exhibited significantly different expression patterns (ANOVA test, P < 0.05) by comparing the transcriptome of the PCTR4∷CAN2 strain grown in YNB containing 200 μm BCS (+BCS, CAN2 overexpression) or 25 μm CuSO4 (+Cu, CAN2 repression) after a 12-hr incubation. (B) The tree view of 14 genes, which exhibited >1.5-fold induction or repression among genes showing significantly different expression patterns (ANOVA test, P < 0.05). The fold change is illustrated by color (see color bar scale in B).
CAN2 expression levels induced by the CTR4 promoter were higher than those by the CAN2 native promoter in the presence of BCS (Figure 1C). Therefore, we compared transcriptome profiles of the WT and CAN2-promoter replacement strains in the presence of BCS. A greater number of genes (524 genes) were significantly and differentially regulated (ANOVA, P < 0.05) (Figure 4A). Among these, a total of 136 genes (128 genes with serotype A ID) showed >1.5-fold induction or reduction and only 10 genes showed more than twofold regulation (Figure 4B). Except the CAN2 gene, only two genes, CNAG_04307.2 (uricase, named URI1) and CNAG_06917.2 (peroxiredoxin, named PRX1), have predicted functions based on sequence homology (Figure 4C). Regulation of the uricase gene appears to be related to CA and CO2 metabolism. Uricase catalyzes the oxidation of uric acid to 5-hydroxyisourate, which can interact with H2O2 to produce allantoin and carbon dioxide.
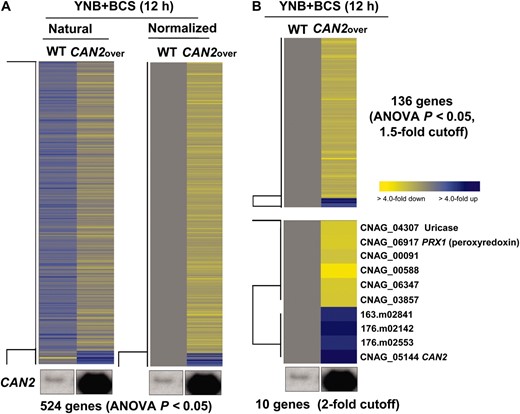
Genes regulated by CAN2 overexpression. (A) The hierarchical clustering analysis of 524 genes, which exhibited significantly different expression patterns (ANOVA test, P < 0.05) by comparing the transcriptomes of the wild-type H99 (WT) and PCTR4∷CAN2 strains “CAN2over” grown in YNB containing 200 μm BCS after a 12-hr incubation. (B) The tree view of 136 and 10 genes, which exhibited >1.5-fold or twofold, respectively, induction or repression among genes showing significantly different expression patterns (ANOVA test, P < 0.05). The fold change is illustrated by color (see color bar scale in B).
On the basis of these array results, we further defined a true Can2-dependent gene based on the following criteria. First a Can2-dependent gene should be identified from both array data sets with statistical significance (ANOVA, P < 0.05). Second, the Can2-dependent gene should exhibit opposite expression patterns in each data set. Following these criteria, we have selected 17 Can2-dependent genes except CAN2 itself (Table 1). These include MEU1, GPB1, NAP1, FAS1, CFO2, CAS3, and ATF1; a majority of these (9 of 17 genes) do not have orthologs in other fungi. The FAS1 gene encodes fatty acid synthase and has been reported to be essential for survival of C. neoformans (Chayakulkeeree et al. 2007). The MEU1 gene encodes methylthioadenosine phosphorylase, which is the initial enzyme catalyzing the methionine salvage pathway (Subhi et al. 2003). The GPB1 gene encodes the Gβ-subunit in the pheromone response MAPK pathway and positively controls sexual differentiation of C. neoformans (Wang et al. 2000). These data further confirm that the CO2-sensing carbonic anhydrase signaling pathway is closely connected to the fatty acid and amino acid biosynthetic pathways and sexual differentiation of C. neoformans as previously proposed (Bahn et al. 2005).
Can2-dependent genes in C. neoformans
C. ne gene name | S. ce gene name | S. po gene name | Fold changes (log2 scale) | ||||
|---|---|---|---|---|---|---|---|
| SeroA ID (CNAG) | CAN2 repressed | CAN2 overexressed | Function | Crypto-ESR | |||
| 00054 | None | None | None | 0.308 | −0.397 | DUF1264 domain-containing protein | OxR-up |
| OsR-dw | |||||||
| 00165 | None | MEU1 | None | 0.313 | −0.613 | Methylthioadenosine phosphorylase | |
| 00906 | None | None | None | 0.365 | −0.661 | Nucleolar protein | |
| 01262 | GPB1 | STE4 | Git5 | 0.333 | −0.482 | G-protein beta subunit GPB1 | OxR-dw |
| 02091 | None | NAP1 | NAP1 | 0.343 | −0.59 | Nucleosome assembly protein | OxR-up |
| 02099 | FAS1 | FAS1 | FAS1 | 0.453 | −0.67 | Fatty acid synthase beta subunit | OxR-dw |
| FxR-dw | |||||||
| 02741 | None | OCT1 | None | 0.399 | −0.831 | Mitochondrial intermediate peptidase | |
| 02958 | CFO2 | None | None | 0.549 | −0.286 | Ferroxidase | OsR-dw |
| 03544 | None | None | None | 0.259 | −0.52 | Conserved hypothetical protein | OxR-dw |
| 03644 | CAS3 | None | None | −0.461 | 0.344 | Cap64 homologs | |
| 04090 | ATF1 | None | ATF1 | 0.347 | −0.483 | Activating transcription factor 2 | |
| 04837 | None | None | None | 0.422 | −0.461 | Conserved hypothetical protein | |
| 05976 | None | NOP58 | None | −0.338 | 0.262 | SnoRNA binding domain containing protein | OxR-dw |
| OsR-up | |||||||
| 06356 | None | None | None | 0.189 | −0.447 | Mitochondrial protein | OxR-dw |
| 06668 | None | AIM38 | None | 0.538 | −0.284 | Mitochondrial protein | FxR-dw |
| 06968 | None | None | None | 0.154 | −0.493 | Hypothetical protein | OxR-dw |
| 07465 | None | None | None | −0.449 | 0.72 | Conserved hypothetical protein | OxR-dw |
C. ne, Cryptococcus neoformans; S. ce, Saccharomyces cerevisiae; S. po, Schizosaccharomyces pombe; ESR, environmental stress regulated; OxR-up/dw, up- or down-regulated by oxidative stress; OsR-up/dw, up- or down-regulated by osmotic stress; FxR-up/dw, up- or down-regulated by fludioxonil.
The role of Cas3 in capsule production of C. neoformans:
CAS3 is one of a few genes whose expression is positively regulated by CAN2 overexpression in our array analysis (Table 1). Although it is homologous to Cap64, which is required for capsule production, Cas3 is not directly involved in capsule formation but instead is required for O-acetylation of the capsule in C. neoformans (Moyrand et al. 2004). However it is still possible that Cas3 is indirectly involved in capsule production through regulation of other capsule genes as the authors speculated (Moyrand et al. 2004). Here we tested the possibility that Cas3 might be involved in CO2-mediated capsule induction since it has been previously reported that capsule production of C. neoformans is increased by high CO2 concentrations (Granger et al. 1985; Vartivarian et al. 1993).
To address this hypothesis, we generated two independent cas3Δ mutants and tested their ability to produce capsule in either ambient air or high CO2 concentrations (Figure S1). Based on quantitative measurements of capsule production, the WT strain exhibited greatly enhanced capsule production in the presence of high CO2 (5%) conditions (Figure 5A). In contrast, the cac1Δ mutant that is highly defective in capsule production under ambient air did not show any enhanced levels of capsule in response to high CO2 concentrations (Figure 5A), indicating that CO2-mediated capsule induction is required for activation of adenylyl cyclase, which has been proposed before (Bahn and Mühlschlegel 2006). The two independent cas3Δ mutants exhibited WT levels of capsule under ambient air conditions (Figure 5A), as previously reported (Moyrand et al. 2004). In response to high CO2 concentration, the cas3Δ mutants also showed enhanced capsule production like the WT H99 strain (Figure 5A), indicating that Cas3 is not required for CO2-mediated capsule induction.
![The role of Cas3 and Can2 in CO2-mediated capsule induction. Capsule synthesis levels of the following C. neoformans strains were quantitatively measured by using hematocrit as described in materials and methods. The Y-axis indicates the relative capsule volume, which is percent ratio of length of packed cell volume phase vs. length of total loading volume phase. (A) C. neoformans strains [the wild-type H99 and cac1Δ (YSB42) and cas3Δ (YSB667 and YSB668) mutant strains] were grown in DME medium under either ambient air (−CO2) or high CO2 (5%, +CO2) conditions for capsule induction. (B) C. neoformans strains [the wild-type H99 and cac1Δ (YSB42) and PCTR4∷CAN2 (YSB734) mutant strains] were grown in DME medium containing 200 μm BCS under either ambient air (−CO2) or high CO2 (5%, +CO2) conditions for capsule induction. Three independent experiments with triplicates were performed. Statistical analysis was performed by using Bonferroni multiple comparison test. *P < 0.001 and NS, not significant (P > 0.05).](https://oup.silverchair-cdn.com/oup/backfile/Content_public/Journal/genetics/185/4/10.1534_genetics.110.118315/5/m_1207fig5.jpeg?Expires=1716451486&Signature=Uy--myDeubsf24GxvtAyDwxZRDJTc8oqpZfofj6loD6s3xEgDoGblN1wS-haionpGta-pQJHNtbCOs8SE8PbSQ20OmgpszYjm0feMarkmkX7DfSchMBBTeVK-YEYyCkxM-x3uZtupWiRd2ErwqzegBORJH-qEv7R7a6fyBS-wOO1E1DRYKzEQvWxMr6HmhktvT8F-ZaM3VFfG0eeeZoZ3V~teukS25DF-u3kFzkAoMZVSeCxMclNn2y5YeXeVSL7CIqfoJy0SMeemQAnnCnAYqLZv7AuliOMWaekCRjS5m0jKeyuCHU6YnbuY-YDvt-pS9nlZVxTen7wAstqY8jSHQ__&Key-Pair-Id=APKAIE5G5CRDK6RD3PGA)
The role of Cas3 and Can2 in CO2-mediated capsule induction. Capsule synthesis levels of the following C. neoformans strains were quantitatively measured by using hematocrit as described in materials and methods. The Y-axis indicates the relative capsule volume, which is percent ratio of length of packed cell volume phase vs. length of total loading volume phase. (A) C. neoformans strains [the wild-type H99 and cac1Δ (YSB42) and cas3Δ (YSB667 and YSB668) mutant strains] were grown in DME medium under either ambient air (−CO2) or high CO2 (5%, +CO2) conditions for capsule induction. (B) C. neoformans strains [the wild-type H99 and cac1Δ (YSB42) and PCTR4∷CAN2 (YSB734) mutant strains] were grown in DME medium containing 200 μm BCS under either ambient air (−CO2) or high CO2 (5%, +CO2) conditions for capsule induction. Three independent experiments with triplicates were performed. Statistical analysis was performed by using Bonferroni multiple comparison test. *P < 0.001 and NS, not significant (P > 0.05).
We also tested whether overexpression of CAN2 may enhance capsule production by growing the PCTR4∷CAN2 strains in DME + BCS medium. We hypothesized that increased production of intracellular bicarbonate by CAN2 overexpression might activate adenylyl cyclase, resulting in enhanced capsule induction. Unexpectedly, however, the PCTR4∷CAN2 strains exhibited WT levels of capsule in DME + BCS medium under either ambient air or high CO2 conditions (Figure 5B). In conclusion, CAN2 overexpression does not enhance capsule induction in C. neoformans, although adenylyl cyclase is required for CO2-mediated capsule induction.
ESR genes are regulated by Can2:
A recent genome-wide transcriptome analysis of the stress-activated HOG pathway uncovered a number of ESR genes, whose expression is affected by osmotic shock, antifungal drug, or oxidative stress in C. neoformans (Ko et al. 2009). Interestingly, a majority of the Can2-dependent genes (11 of 17 genes) were found to be ESR genes of C. neoformans (Table 1). This finding suggests that CAN2 overexpression can be sensed as stress because increased levels of bicarbonate and protons may change normal cellular physiological conditions. To test this hypothesis, we performed diverse stress sensitivity tests with the PCTR4∷CAN2 strains grown on YNB + BCS medium (Figure 6). The PCTR4∷CAN2 strains exhibited hypersensitivity to several stress-inducing agents, including H2O2, CdSO4, and methylmethane sulfonate (MMS) compared to the WT strain. This indicates that CAN2 overexpression render cells hypersensitive to oxidative and genotoxic stress. However, the PCTR4∷CAN2 strains were as sensitive to hydroxyurea (HU), which is another genotoxic stress agent, as the WT strain.
![The effect of CAN2 overexpression in stress response. Each C. neoformans strain [the wild-type H99 and ras1Δ (YSB53), cac1Δ (YSB42), hog1Δ (YSB64), and PCTR4∷CAN2 (YSB733 and YSB734) mutant strains] was grown overnight at 30° in liquid YPD medium, washed, 10-fold serially diluted (1–104 dilutions), and spotted (3 μl of dilution) on YNB agar medium containing 200 μm BCS and the indicated concentrations of hydrogen peroxide (H2O2), CdSO4, methylmethane sulfonate (MMS), hydroxyurea (HU), SDS, amphotericin B (AmpB), fluconazole, ketoconazole, and itraconazole. Cells were incubated at 30° for 72 hr and photographed.](https://oup.silverchair-cdn.com/oup/backfile/Content_public/Journal/genetics/185/4/10.1534_genetics.110.118315/5/m_1207fig6.jpeg?Expires=1716451486&Signature=JkHAUT1BNPmznSv2fc6Vc~tlakMf6JmST63DQ~3xWT97~Bniuv0w7duo9FSIgddYBSxpDw47EMRiJFK773DdImx8yMJqSOR1aHO7NQaT~YmqsMCF2I-dx5DanJ6sdGdEqF9vJdUki4HuJOp~maagn60Yuv~gFsmqzsR4vpq0COdN3gnCdTgO2TfPRrCDG8idLvHjwXQdZD~t3DsBP7SIBtuD~rHAimMhM88-oh3Nt38z-0kWYPlojy-P5Q73SPgOCXomTPt0JHxb7AFYPGEgAzYOcmgeTNsYNs8Vunn9DNDxJj3v62iRciz4t-0~Cr78F-rDpfQPKYN0xGg7dmGEcQ__&Key-Pair-Id=APKAIE5G5CRDK6RD3PGA)
The effect of CAN2 overexpression in stress response. Each C. neoformans strain [the wild-type H99 and ras1Δ (YSB53), cac1Δ (YSB42), hog1Δ (YSB64), and PCTR4∷CAN2 (YSB733 and YSB734) mutant strains] was grown overnight at 30° in liquid YPD medium, washed, 10-fold serially diluted (1–104 dilutions), and spotted (3 μl of dilution) on YNB agar medium containing 200 μm BCS and the indicated concentrations of hydrogen peroxide (H2O2), CdSO4, methylmethane sulfonate (MMS), hydroxyurea (HU), SDS, amphotericin B (AmpB), fluconazole, ketoconazole, and itraconazole. Cells were incubated at 30° for 72 hr and photographed.
The PCTR4∷CAN2 strains exhibited extreme sensitivity to amphotericin B as well as azole drugs, such as fluconazole, ketoconazole, and itraconazole (Figure 6). These indicate that increased antifungal drug susceptibility of the PCTR4∷CAN2 strains appears to be independent of the ergosterol biosynthesis because the phenotypes of the PCTR4∷CAN2 strains were distinct from those of hog1Δ mutants that are defective in ergosterol biosynthesis (Figure 6). Instead, hypersensitivity of the PCTR4∷CAN2 strain to antifungal drugs may result from its defective membrane integrity because the PCTR4∷CAN2 strains exhibited increased sensitivity to SDS. Taken together, CAN2 overexpression alters normal cellular physiology, which results in defective responses to diverse environmental stresses and antifungal drugs.
The role of the transcription factor Atf1 regulated by Can2:
Among the Can2-dependent genes, the one encoding the transcription factor Atf1 was notable, although it does not belong to ESR genes (Table 1). Northern blot analysis confirmed that ATF1 expression was slightly upregulated when CAN2 is repressed, but slightly downregulated when CAN2 is overexpressed (Figure S2), similar to the microarray results. Atf1 is a major transcription factor activated by the stress-activated Sty1 (a Hog1 MAPK homolog) MAPK in Schizosaccharomyces pombe (Shiozaki and Russell 1996; Wilkinson et al. 1996; Degols and Russell 1997). In C. neoformans, the thioredoxin system is controlled by Atf1, indicating that Atf1 is involved in oxidative stress response (Missall and Lodge 2005). However, the function of Atf1 in diverse stress responses and its relationship with the HOG pathway in C. neoformans still remains unknown. Therefore, we independently constructed the atf1Δ mutant strain in the WT H99 strain that retains full virulence (Figure S3) and tested various stress sensitivities and virulence factor production compared with the mutants of the stress-activated HOG pathway and other stress-related signaling pathways such as the Ras and cAMP pathways. As control strains, we used the atf1Δ mutant (here designated as atf1ΔE), which was previously constructed in the H99-Eunuch strain background (H99E) (Missall and Lodge 2005).
The two independently generated atf1Δ mutants exhibited the expected hypersensitivity to tert-butyl hydroperoxide (tBOOH) similar to the atfΔE mutant (Figure 7) as previously reported (Missall and Lodge 2005). The atf1Δ mutants also exhibited hypersensitivity to H2O2, but hyperresistance to diamide (Figure 7). Furthermore, the atf1Δ mutant showed increased sensitivity to high temperature (40°) and the toxin methylglyoxal (Figure 7). These stress-response phenotypes of the atf1Δ mutant are similar to those of the hog1Δ mutant. In contrast, the atf1Δ mutant did not show any increased sensitivity to osmotic shock, cell wall/membrane-destabilizing agents such as SDS, and genotoxic agents, such as hydroxyurea and methylmethane sulfonate (Figure 7 and Figure S4). As previously described (Ko et al. 2009), the hog1Δ and ssk1Δ mutants were more sensitive to osmotic shock under carbon-starvation conditions and the presence of hydroxyurea. Furthermore, the atf1Δ mutant exhibited rather unique antifungal drug resistance patterns, which were also distinguished from those of the hog1Δ, ras1Δ, and cac1Δ mutants (Figure 7). As previously reported, the hog1Δ mutant exhibited hypersensitivity to amphotericin B, but increased resistance to fluconazole and fludioxonil (Figure 7). However, the atf1Δ mutant exhibited increased resistance to both amphotericin B and fluconazole, but showed slightly enhanced sensitivity to fludioxonil (Figure 7). Notably, the atf1Δ mutant was much more sensitive to flucytosine treatment than the WT strain. Similarly, the ras1Δ mutant also exhibited hypersensitivity to flucytosine. In contrast, the hog1Δ, but not cac1Δ, mutant exhibited only slightly increased sensitivity to flucytosine (Figure 7). The stress and antifungal drug response phenotypes of the atf1ΔE mutant in the H99E background were generally identical to those of the atf1Δ mutants in the WT H99 background, although we have found several phenotypic differences between H99 and H99E strains (Figure 7). Since the H99E strain was more thermosensitive than the H99 strain, thermosensitivity of the atf1ΔE strain was not observed (Figure 7).
![The role of Atf1 in stress response and resistance to antifungal drugs. Each C. neoformans strain [the wild-type H99 and H99-Eunuch strains and ras1Δ (YSB53), cac1Δ (YSB42), hog1Δ (YSB64), atf1Δ (YSB676 and YSB678), and atf1ΔE (BE7-151) mutant strains] was grown overnight at 30° in liquid YPD medium, 10-fold serially diluted (1–104 dilutions), and spotted (3 μl of dilution) on YPD agar containing the indicated concentrations of hydrogen peroxide (H2O2), diamide, tert-butyl hydroperoxide (tBOOH), methylglyoxal, KCl, SDS, amphotericin B, fluconazole, flucytosine, and fludioxonil. Cells were incubated at 30° for 72 hr and photographed. For thermotolerance test, cells spotted on YPD medium were incubated at 40° for 4 days and photographed.](https://oup.silverchair-cdn.com/oup/backfile/Content_public/Journal/genetics/185/4/10.1534_genetics.110.118315/5/m_1207fig7.jpeg?Expires=1716451486&Signature=KhDWuqee9-n4XvWwnv6acvk1egChcxLEIo2gevaMIYri57pCeZZd4XjFrflCzwIUpeV8VDid5gIA3zhTf-NTJKEoPT3l3MErYBVcPcan8-2KV2jLr5C059OZUV5LVxLI4IeMyBL8ZgC5WWqIXNl2A8plrULyK6zVjRFEIKwJEpw980xnC6WKU6SFm-lQ~UrXYnI16diu7-OpIQ7mhDsOV2~Pg~Tuz4KZqH7zm3JX5WgQF6s4GHMi7d3Pd4nTuuybbC5aVnZpWx79Icl0HcJKhpk97tgBqAbXc5InsCcKqUMf1HWRMQw260f6fUmqEsPFoaHawa7PpvhrazUmkXKHbA__&Key-Pair-Id=APKAIE5G5CRDK6RD3PGA)
The role of Atf1 in stress response and resistance to antifungal drugs. Each C. neoformans strain [the wild-type H99 and H99-Eunuch strains and ras1Δ (YSB53), cac1Δ (YSB42), hog1Δ (YSB64), atf1Δ (YSB676 and YSB678), and atf1ΔE (BE7-151) mutant strains] was grown overnight at 30° in liquid YPD medium, 10-fold serially diluted (1–104 dilutions), and spotted (3 μl of dilution) on YPD agar containing the indicated concentrations of hydrogen peroxide (H2O2), diamide, tert-butyl hydroperoxide (tBOOH), methylglyoxal, KCl, SDS, amphotericin B, fluconazole, flucytosine, and fludioxonil. Cells were incubated at 30° for 72 hr and photographed. For thermotolerance test, cells spotted on YPD medium were incubated at 40° for 4 days and photographed.
The atf1Δ mutant exhibited increased melanin and capsule production (Figure 8), which is similar to the hog1Δ mutant. In capsule production, both atf1Δ and atf1ΔE mutants exhibited higher levels of capsule than the H99 and H99E strains, respectively (Figure 8A). Similarly, melanin production was more enhanced in both atf1Δ and aft1ΔE mutants than the H99 and H99E strains, respectively (Figure 8B). Interestingly, the H99E strain was found to be highly defective in melanin production, which is similar to the cac1Δ mutant, compared to the H99 strain (Figure 8B). In both Nigher seed and L-DOPA media, the atf1Δ mutant exhibited increased melanin production (Figure 8B). Taken together, Atf1 appears to play important roles in response to environmental stress and antifungal drug treatment and production of melanin and capsule in a manner that is shared with and distinct from the HOG pathway in C. neoformans.
![The role of Atf1 in caspule and melanin production. (A) Capsule synthesis levels of C. neoformans strains [the wild-type H99 and H99-Eunuch strains and cac1Δ (YSB42), atf1Δ (YSB676), and atf1ΔE (BE7-151) mutant strains] were quantitatively measured by using hematocrit as described in materials and methods and Figure 5A. Two independent experiments with triplicates were performed. Statistical analysis was performed by using Bonferroni multiple comparison test. *P < 0.01 and **P <0.001, respectively. (B) For melanin production, the wild-type H99 and H99-Eunuch strains and cac1Δ (YSB42), atf1Δ (YSB676 and YSB678), and atf1ΔE (BE7-151) mutant strains were grown overnight (∼16 hr) in YPD medium, spotted on solid Niger seed containing either 0.1 or 1.0% glucose or L-DOPA medium containing 0.3 or 0.5% glucose, incubated at 37° for 2 days, and photographed after 2 days.](https://oup.silverchair-cdn.com/oup/backfile/Content_public/Journal/genetics/185/4/10.1534_genetics.110.118315/5/m_1207fig8.jpeg?Expires=1716451486&Signature=UsJb42D6BOsxV3qTDWnjDOzh9MQQ0csp2xHvnQhCCrDFxq5xFs-IDijrVxbfu6hTBSaEC6R9m92aTVFjE2mzOih~E0QmEMw2sLfZHAZ3mlxeqV51K4LpWJ2XQ0ClBu~fIx0W0aa6hFsuWfmAwVWEKarYv93GNG8QMgEU7zAUkkqf~bceKi7HeVgd5VOmc1IBoJVj6yhkxzh8~PbP0OKzeuFrHVeM74XYPoPgtcd6pdmEaK9L93k5dYU~TDRsKzeT2KUvqlwN5KrRUP291nHyQuHI4imQQj24g7IzNYrDpZ4N1leCR~50gp1Z-EMYOvPvGnB0VKgDnnhx-8rWzlY7eg__&Key-Pair-Id=APKAIE5G5CRDK6RD3PGA)
The role of Atf1 in caspule and melanin production. (A) Capsule synthesis levels of C. neoformans strains [the wild-type H99 and H99-Eunuch strains and cac1Δ (YSB42), atf1Δ (YSB676), and atf1ΔE (BE7-151) mutant strains] were quantitatively measured by using hematocrit as described in materials and methods and Figure 5A. Two independent experiments with triplicates were performed. Statistical analysis was performed by using Bonferroni multiple comparison test. *P < 0.01 and **P <0.001, respectively. (B) For melanin production, the wild-type H99 and H99-Eunuch strains and cac1Δ (YSB42), atf1Δ (YSB676 and YSB678), and atf1ΔE (BE7-151) mutant strains were grown overnight (∼16 hr) in YPD medium, spotted on solid Niger seed containing either 0.1 or 1.0% glucose or L-DOPA medium containing 0.3 or 0.5% glucose, incubated at 37° for 2 days, and photographed after 2 days.
DISCUSSION
In this study, we aimed to elucidate the genes regulated by CA, which is essential for growth and differentiation of C. neoformans, on a genome-wide scale. To achieve this goal, we constructed the conditional CAN2 expression mutant in which the native CAN2 promoter is replaced with the CTR4 promoter, which is controlled by the copper levels in the growth medium (Ory et al. 2004). The PCTR4∷CAN2 strain exhibited growth defects when CAN2 expression is repressed by addition of CuSO4, but grew normally when the CAN2 gene is overexpressed by addition of BCS. Expectedly, the growth defect was restored to normal by addition of high CO2. As an additional benefit from this study, we could monitor CAN2 overexpression phenotypes in media containing BCS because CAN2 expression levels induced by the CTR4 promoter were much higher than the native CAN2 expression levels.
Through the comparative transcriptome analysis by DNA microarray with the PCTR4∷CAN2 strain, we found several Can2-dependent genes in C. neoformans, which have not been reported before. To the best of our knowledge, this is the first genome-wide transcriptome analysis to discover the target genes directly or indirectly regulated by carbonic anhydrase in the CO2-sensing and metabolic pathway. The majority of Can2-dependent genes appeared to be uniquely found in C. neoformans. However, the list of Can2-dependent genes that have predicted functions based on sequence homology, including FUR1, URI1, PRX1, FAS1, GPB1, CAS3, CFO1, ATF1, MEU1, NAP1, OCT1, NOP58, and AIM38, provided insight into the downstream signaling network modulated by CO2 and CA in C. neoformans.
The FAS1 (fatty acid synthase 1) gene was upregulated when CAN2 is repressed, but downregulated when CAN2 is overexpressed. This result may explain how fatty acid biosynthesis is regulated by CA. Previously we have shown that the growth defect of the can2Δ mutant can be partially restored to normal by exogenous addition of fatty acid, such as palmitate and myristate, indicating the role of Can2 in fatty acid biosythesis (Bahn et al. 2005). Therefore expression of the FAS1 gene may be controlled as a compensatory mechanism for different CA activity and intracellular bicarbonate levels. Both Fas1 and Fas2 are known to be required for fatty acid biosynthesis and essential for growth of C. neoformans (Chayakulkeeree et al. 2007).
Differential expression of GPB1, a Gβ-subunit of the pheromone-responsive Cpk1 MAPK pathway, also helps us to understand the role of Can2 in sexual differentiation of C. neoformans. Can2 is involved in both initial and terminal stages of sexual cycles of C. neoformans in negative and positive manners, respectively (Bahn et al. 2005). Our array data showing that basal expression levels of GPB1 is induced when CAN2 is repressed indicate that the Gpb1-mediated Cpk1 MAPK pathway can be controlled by Can2.
In C. neoformans, high CO2 enhances capsule production (Granger et al. 1985; Vartivarian et al. 1993). Originally we hypothesized that Can2-mediated CAS3 induction may be responsible for enhancement of capsule production by high CO2 concentration. Cas3 has been identified as one of a seven-member family of capsular structure designer proteins, although it is not directly involved in capsule formation but instead required for O-acetylation of the capsule in C. neoformans (Moyrand et al. 2004). Our data showed that Cas3 is not required for CO2-mediated capsule induction. Mogensen and co-workers demonstrated that bicarbonate directly activates Cac1 adenylyl cyclase in vitro, which is the key component of the cAMP-signaling pathway, which plays a major role in capsule biosynthesis (Mogensen et al. 2006). Supporting this, we also found that CO2-mediated capsule induction requires functional adenylyl cyclase in vivo. However, we have found that CAN2 overexpression did not enhance capsule production in either ambient air or high CO2 conditions. Therefore, it still remains elusive whether increased bicarbonate or activated Can2 directly activates adenylyl cyclase for capsule induction in vivo. It is also possible that unnatural CAN2 overexpression by the CTR4 promoter may affect other factors that counteract normal capsule induction.
One of the interesting findings of our array analysis is that a majority of Can2-dependent genes were ESR genes, whose expression is differentially regulated in response to environmental stresses, such as osmotic shock and oxidative stresses (Ko et al. 2009). The reason for regulation of the ESR genes by the CAN2 gene is not clear. Differential expression of the CAN2 gene will change intracellular levels of bicarbonate and proton, which affect intracellular pH and osmotic balance. xThese intracellular physiological changes can be sensed as stress, which may trigger cells to induce or repress ESR genes to counterbalance the stress. Supporting this, the CAN2 overexpression strain was hypersensitive to oxidative stress (H2O2) and genotoxic stress (MMS).
Related to this finding, the transcription factor Atf1 was found to be differentially regulated by Can2. Atf1 is orthologous to S. pombe Atf1, which is a key downstream transcription factor of the stress-activated Sty1 MAPK (Shiozaki and Russell 1996; Wilkinson et al. 1996; Degols and Russell 1997). Although Missall and Lodge previously reported that Atf1 is involved in regulation of the thioredoxin system during oxidative stress response, here we further characterized the role of Atf1 in diverse stress response by using independently constructed atf1Δ mutants in the WT H99 strain background. The atf1Δ mutants that we generated generally exhibited identical phenotypes compared to the atf1ΔE mutants that Missall and Lodge generated in the H99E strain background. Minor phenotypic differences appear to result from the strain background difference. At this point, it is not clear whether Atf1 is the transcription factor working downstream of the HOG pathway. The atf1Δ mutant shared some of stress-response phenotypes with the hog1Δ mutant and yet exhibited phenotypes distinct from those of the hog1Δ mutant, including genotoxic stress and membrane-destabilizing response and antifungal drug resistance. It is possible that Atf1 may be responsible for a subset of HOG-dependent phenotypes. Whether Atf1 is a direct downstream effector for the Hog1 MAPK needs to be further addressed in future study.
Recently, Sheth and co-workers monitored global transcriptional response of C. albicans under 5.5% CO2, which mimics host physiological conditions. Interestingly, among the 14 genes whose expressions are significantly changed by high CO2, three of them (HSP12, AAH1, and OPT1) are known to be regulated by the HOG pathway (Sheth et al. 2008), indicating that CO2 sensing and metabolism could also be related to the stress-response signaling pathway in C. albicans. Particularly, transcript abundance of HSP12, which encodes a small heat-shock protein involved in protein folding under stress conditions, are lowered by 5.5% CO2 in an adenylyl cyclase/cAMP-dependent manner, suggesting that C. albicans considers ambient air having 0.036% CO2 as stress. Supporting this finding, our recent transcriptome analysis of the cAMP-signaling pathway in C. neoformans demonstrated that two HSP12 orthologous genes, HSP12 and HSP122, are both regulated by cAMP and HOG pathways in the pathogen (Maeng et al. 2010).
The last notable finding of this study is a potential of Can2 and Atf1 as targets for combination antifungal therapy along with commercially known antifungal drugs. First, the CAN2 overexpression strains were extremely sensitive to amphotericin B (AmpB) and azole drugs. Therefore, a molecule(s) that is able to induce activity of Can2 or expression of CAN2 could be used for treatment of cryptococcosis along with AmpB and azole drugs. The synergistic mechanism between CAN2 overexpression and AmpB or azole drugs is not clear at this point. It is possible that decreased FAS1 expression in the CAN2 overexpression strain may affect cell membrane integrity, which results in increased sensitivity to AmpB, which destroys membrane integrity or increased intracellular uptake of the antifungal drugs. Another benefit for the Can2-activating molecule could be decreased stress sensitivity of C. neoformans, which may result in rapid clearance during host infection. Second, the atf1Δ mutant was much more sensitive to flucytosine than the wild-type strain. Interestingly, the ras1Δ mutant was also found to be hypsersensitive to flucytosine. These data indicate that an inhibitor of Atf1 or Ras1 in combination with flucytosine could be effective for treatment of cryptococcosis. The reason for this synergism is not understood at this point.
In conclusion, our CA-transcriptome analysis not only discovered a number of Can2-dependent genes in C. neoformans, but also made the finding that perturbed CO2/bicarbonate homeostasis may cause impaired cellular response to diverse environmental stresses. Therefore, modulation of the signaling network of the CA/CO2-sensing pathway may provide a novel therapeutic method for treatment of pathogenic fungi.
Footnotes
Supporting information is available online at http://www.genetics.org/cgi/content/full/genetics.110.118315/DC1.
These authors contributed equally to this work.
Footnotes
Communicating editor: A. P. Mitchell
Acknowledgements
This work was supported by the Pioneer Research Center Program through the National Research Foundation of Korea, funded by the Ministry of Education, Science and Technology (no. 2009-0081512), the National Research Foundation of Korea grant, funded by the Korean government (MEST) (2009-0063344), and Yonsei University Research Fund of 2008 (2008-7-0285) (to Y.S.B). This work was also supported in part by RO1 grant AI50438 and R21 grant AI70230 from the National Institutes of Health/National Institute of Allergy and Infectious Diseases (to J.H.).
References
Amoroso, G., L. Morell-Avrahov, D. Muller, K. Klug and D. Sultemeyer,
Ausubel, F. M., R. Brent, R. E. Kingston, D. D. Moore, J. G. Seidman et al.,
Maeng, S., Y. J. Ko, G. B. Kim, K. W. Jung, A. Floyd et al.,
Parkkila, S., A. K. Parkkila, H. Rajaniemi, G. N. Shah, J. H. Grubb et al.,
