


Abstract
With the improvement and decline in cost of high-throughput genotyping and phenotyping technologies, genome-wide association (GWA) studies are fast becoming a preferred approach for dissecting complex quantitative traits. Glucosinolate (GSL) secondary metabolites within Arabidopsis spp. can serve as a model system to understand the genomic architecture of quantitative traits. GSLs are key defenses against insects in the wild and the relatively large number of cloned quantitative trait locus (QTL) controlling GSL traits allows comparison of GWA to previous QTL analyses. To better understand the specieswide genomic architecture controlling plant-insect interactions and the relative strengths of GWA and QTL studies, we conducted a GWA mapping study using 96 A. thaliana accessions, 43 GSL phenotypes, and ∼230,000 SNPs. Our GWA analysis identified the two major polymorphic loci controlling GSL variation (AOP and MAM) in natural populations within large blocks of positive associations encompassing dozens of genes. These blocks of positive associations showed extended linkage disequilibrium (LD) that we hypothesize to have arisen from balancing or fluctuating selective sweeps at both the AOP and MAM loci. These potential sweep blocks are likely linked with the formation of new defensive chemistries that alter plant fitness in natural environments. Interestingly, this GWA analysis did not identify the majority of previously identified QTL even though these polymorphisms were present in the GWA population. This may be partly explained by a nonrandom distribution of phenotypic variation across population subgroups that links population structure and GSL variation, suggesting that natural selection can hinder the detection of phenotype–genotype associations in natural populations.
NATURAL phenotypic variation within a species or population is largely quantitative, polygenic, and controlled by the interaction of environmental and genetic factors (Fisher 1930; Falconer and Mackay 1996; Lynch and Walsh 1998). Advances in both high-throughput genotyping and phenotyping has enabled the use of intraspecific natural variation to identify the molecular and genetic bases of complex traits such as disease resistance, growth and development and correspondingly provide a preliminary view of the ecological and evolutionary consequences of this variation. While quantitative trait locus (QTL) mapping has been the standard approach to studying complex traits in the past, its application to self-incompatible and long-generation species has been limited by the labor and time required to generate and genotype mapping populations (Liu 1998; Lynch and Walsh 1998; Mauricio 2001). As such, the molecular basis of most quantitative traits remains unknown.
Genome-wide association (GWA) mapping has become a popular alternative to QTL mapping in recent years for studying natural genetic variation. GWA identifies association between phenotypes and genotypes, at a genome-wide level, using “unrelated” individuals that have been simultaneously genotyped and phenotyped (Hirschhorn and Daly 2005; Weigel and Nordborg 2005; Nordborg and Weigel 2008). Genetic recombination across generations leads to a decay of linkage disequilibrium (LD), or apparent genetic linkage, between neighboring polymorphisms such that polymorphisms separated by hundreds to thousands of bases are effectively inherited independently (Kim et al. 2007; Nordborg and Weigel 2008). The goal of GWA mapping is to identify polymorphisms associated with the quantitative traits of interest. This potential has been demonstrated, typically within candidate genes previously identified from molecular or QTL data (Begovich et al. 2004; Palaisa et al. 2004; Szalma et al. 2005; Brock et al. 2007; Easton et al. 2007; Harjes et al. 2008) but increasingly using genome-wide analyses (Easton et al. 2007; Zhao et al. 2007; Ghazalpour et al. 2008).
While the potential of GWA studies has been experimentally supported, one's ability to identify phenotype–genotype associations may be obscured by many factors, including (1) population structure, which can lead to a high level of false significant associations (de Bakker et al. 2005; Wang et al. 2005; Kang et al. 2008; Rosenberg and Nordborg 2006); (2) extended LD blocks resulting from selective events, such as recent positive selection (Palaisa et al. 2004) or stochastic probabilities (Verhoeven and Simonsen 2005); (3) epistasis, a fundamental component of complex genetic landscapes (Whitlock et al. 1995; Charlesworth et al. 1997; Byrne et al. 1998; Moore 2003; Caicedo et al. 2004; Carlborg and Haley 2004; Whibley et al. 2006; Wentzell et al. 2007); and (4) rare causal alleles that require a large population for detection (Clark et al. 2007; Nordborg and Weigel 2008; Spencer et al. 2009). Population structure, LD blocks, allele frequency, and epistasis are typically less significant issues when using structured mapping populations, suggesting that these two approaches may have differential likelihood of identifying particular causal polymorphisms (Mackay 2001). Recognizing and acknowledging the respective advantages and disadvantages of linkage mapping and GWA mapping (Mackay 2009; Myles et al. 2009), it is logical to borrow strengths from both approaches by directly comparing results obtained from GWA mapping with the results obtained from an extensive analysis of structured populations for the same phenotype.
Arabidopsis thaliana is a key model organism for advancing genetic technologies and analytical approaches for studying complex quantitative genetics in wild species (Koornneef et al. 2004; Weigel and Nordborg 2005; Nordborg and Weigel 2008). These include exploring the genetics of complex expression traits via genome resequencing and transcript profiling (Clark et al. 2007; Keurentjes et al. 2007; West et al. 2007; Zhang et al. 2008), querying the complexity of genetic epistasis in laboratory and natural populations (Caicedo et al. 2004; Malmberg et al. 2005; Bomblies et al. 2007; Rowe et al. 2008; Rowe and Kliebenstein 2008; Alcazar et al. 2009; Bikard et al. 2009), and studying the mechanistic basis and ecological impact of genotype × environment interactions (Maloof et al. 2001; Loudet et al. 2003; Filiault et al. 2008; Wentzell et al. 2008; Wentzell and Kliebenstein 2008; Wilczek et al. 2009). A. thaliana has long provided a model system for both GWA mapping and QTL mapping in structured populations (Clarke et al. 1995; Alonso-Blanco et al. 1998; Nordborg et al. 2002; Nordborg et al. 2005; Kim et al. 2007; Zhao et al. 2007).
Glucosinolate (GSL) secondary metabolite accumulation within A. thaliana has been the subject of extensive quantitative genetic study and provides useful tools for comparing and understanding the differences between QTL studies and GWA studies (Kliebenstein et al. 2001b; Raybould and Moyes 2001; Kliebenstein 2009). Two major classes of GSL are produced by A. thaliana, aliphatic (methionine derived) and indolic (tryptophan derived), both showing extensive intraspecific variation in structure and content. Previous studies using at least five different A. thaliana populations to map GSL accumulation provide an excellent set of known QTL (Kliebenstein et al. 2001b, 2002a; Keurentjes et al. 2006; Pfalz et al. 2007; Wentzell et al. 2007). The genetic tools available for A. thaliana have facilitated cloning of several QTL controlling variation of GSL structure and content between natural A. thaliana accessions, most notably the AOP and MAM/Elong loci. The polymorphisms controlling these QTL also vary within the foundation collection of 96 accessions for A. thaliana GWA studies (Kliebenstein et al. 2001c; Lambrix et al. 2001) (Figure 1). For instance, the GSL.AOP locus controls the type and amount of glucosinolate made depending upon the expression of two tandem genes, AOP2 and AOP3. If AOP2 is expressed the plant accumulates alkenyl GSL, if AOP3 is expressed the plant accumulates hydroxyalkyl GSL, and if neither gene is functional the plant accumulates the precursor methylsulfinyl GSL (Figure 1) (Kliebenstein et al. 2001a,c). A second locus, GSL.Elong (MAM), controls diversity in chain length, with polymorphisms leading to accumulation of three-carbon or four-carbon long GSL (Figure 1) (Mithen et al. 1995; Kliebenstein et al. 2001c; Kroymann et al. 2001). In addition to the known QTL causal genes, knowledge of many enzymes and regulators for GSL biochemical pathways provides a strong practical advantage to studying GSL as a quantitative trait (Wittstock and Halkier 2002; Grubb and Abel 2006; Halkier and Gershenzon 2006). As such, GSL within A. thaliana provide a system to compare GWA findings with results from structured mapping populations and discern how these approaches may yield differing views of the genomic architecture controlling a complex quantitative trait.
In addition to being an advantageous molecular system for studying quantitative genomics, natural variation in both GSL pathways has fitness effects related to A. thaliana interaction with pathogens or insects. Indolic GSL are a critical determinant of resistance to pathogens and insects and additionally act as oviposition deterrents (Kim and Jander 2007; de Vos et al. 2008; Bednarek et al. 2009; Clay et al. 2009). Aliphatic GSL influence fitness of A. thaliana and related cruciferous species via their contribution to defense against herbivory (Mauricio 1998; Bidart-Bouzat and Kliebenstein 2008; Lankau and Kliebenstein 2009). Interestingly, the relationship between fitness and GSL is not linear and displays hallmarks of fluctuating and/or balancing selection. These selection pressures are dependent upon both the insect and neighboring plant species within the plant's environment (Benderoth et al. 2006; Lankau 2007; Lankau and Strauss 2007; Bakker et al. 2008; Lankau and Strauss 2008).
To better understand the genetics and evolution of GSL, we conducted a genome-wide association mapping study using 96 A. thaliana accessions, 43 GSL phenotypes and 229,940 SNPs (Atwell et al. 2010), with specific reference to 16 cloned QTL controlling GSL traits that are known to vary within this set of A. thaliana accessions. This study identified a partial overlap between GWA-identified genes and cloned QTL genes in the same accessions. A nonrandom distribution of phenotypic variation across hypothesized population subgroups indicates a link between population structure and GSL variation that suggests an explanation for the incomplete overlap between GWA and QTL results. While GWA is expected to identify trait-associated polymorphisms within a narrower candidate genomic region than QTL mapping, due to the increased recombination across accessions compared to structured mapping populations, we identified large blocks of positive associations coinciding with extended LD blocks surrounding the previously cloned GSL QTL AOP/GSL.AOP and MAM/GSL.Elong that appear to diminish the precision with which causal SNP can be identified (Kliebenstein et al. 2001a; Kroymann et al. 2001; Wentzell et al. 2007). We hypothesize that these extended LD blocks arose from balancing or fluctuating selective sweeps at both the AOP and MAM loci and that these hypothesized sweeps are linked with the formation of new defensive chemistries that increase plant fitness in natural environments. The presence of these association blocks suggests that GWA and QTL mapping in structured populations will complement each other to identify causal polymorphisms.
MATERIALS AND METHODS
Population and growth conditions:
GSL accumulation was measured in a previously described collection of 96 natural A. thaliana accessions (Nordborg et al. 2002, 2005; Borevitz et al. 2007). Seeds were imbibed and cold stratified at 4° for 3 days to break dormancy. For all experiments, plants were grown in 36-cell flats with one plant per cell. Four plants per accession were grown in a randomized block design, providing four GSL assays per accession. Plants were maintained under short-day conditions in controlled environment growth chambers. The full experiment was duplicated utilizing the same growth chambers. The two replicate experiments are identified as “2007” and “2008.” At 35 days postgermination, a mature leaf per plant was harvested and analyzed for GSL content as described below (Kliebenstein et al. 2006a; West et al. 2007).
SNP genotypes:
Genotypes of 248,584 SNP for the 96 A. thaliana accessions were obtained using the SNP chip described by Kim et al. (2007) and were generated by the groups of J. Bergelson, J. O. Borevitz, and M. Nordborg. The data were downloaded from the project website (http://walnut.usc.edu/2010/data)(Atwell et. al. 2010). For unpublished data, see File S3. We performed an additional preprocessing step to exclude SNPs with <5% minor allele frequencies, resulting in a final set of 229,940 SNPs.
Analysis of GSL content and data processing:
GSL content of excised leaves was measured using a previously described high-throughput analytical system (Kliebenstein et al. 2001b, 2005b). Briefly, one leaf was removed from each plant, photographed, and placed in a 96-well microtiter plate with 500 μl of 90% methanol and one 3.8-mm stainless steel ball-bearing. Tissue was homogenized for ∼1 min in a paint shaker, centrifuged, and the supernatant transferred to a 96-well filter plate with 50 μl of DEAE sephadex. The sephadex-bound GSL were eluted by incubation with sulfatase. Individual desulfo-GSL compounds within each sample were separated and detected by HPLC-DAD and identified and quantified by comparison to purified standards (Reichelt et al. 2002). Area for each leaf was measured using ImageJ with scale objects included in each digital image (Abramoff et al. 2004). The GSL traits are reported per cm2 of leaf area. No significant variation was detected for leaf density within these accessions under these growth conditions (data not shown).
In addition to individual GSL compounds, we developed a set of summation and ratio traits on the basis of prior knowledge of the GSL pathways to examine the variation at individual steps of GSL biosynthesis (Table S3) (Kliebenstein 2007; Wentzell et al. 2007). For instance, the content of 3-methylthiopropyl, 3-methylsulfinylpropyl, 3-hydroxypropyl, and allyl glucosinolates were summed (total C3 aliphatic) to provide an estimate of the content of 3C aliphatic glucosinolates within these lines (Figure 1 and Table S3). This enables the detection of associations that specifically influence 3C glucosinolate accumulation irrespective of side-chain modification. The ratio traits were created to measure the efficiency of partitioning a class of glucosinolates into particular structures. For example, the ratio of 3-methylthiopropyl to total C3 aliphatic shows the efficiency of conversion of the 3-methylthiopropyl glucosinolate into its potential products (Table S3). These ratios and summation traits allow us to isolate the effects of variation at individual steps of glucosinolate biosynthesis from variation affecting the rest of the biosynthetic pathway (Wentzell et al. 2007). The independence of these derived traits is supported by their low correlation with the raw traits (Table S4).
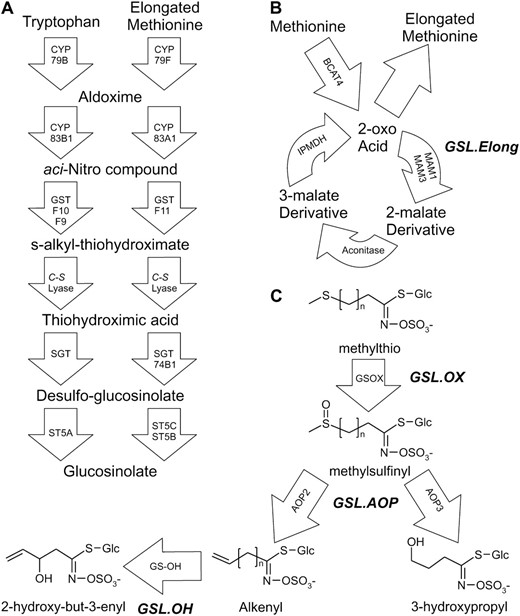
GSL biosynthesis and cloned QTL. Arrows show the known and predicted steps for GSL biosynthesis with the gene name for each biochemical reaction within the arrow. For undetected intermediate compounds, only chemical names are provided; for detected compounds, both the structure and chemical name are provided. The position of known genetic loci controlling biosynthetic variation is shown in bold italics. (A) The pathway and genes responsible for the production of the core GSL structure from tryptophan (indolic GSL) and methionine (aliphatic GSL). (B) Chain elongation cycle for aliphatic GSL production. Each reaction cycle adds a single carbon to a 2-oxo-acid, which is then transaminated to generate homomethionine for aliphatic GSL biosynthesis. The GSL.Elong QTL alters this cycle through variation at the MAM1, MAM2, and MAM3 genes that leads to differential GSL structure and content (Kroymann et al. 2001; Textor et al. 2004). (C) Aliphatic GSL side chain modification within the Bay-0 × Sha RIL population. Side-chain modification is controlled by variation at the GSL.ALK QTL via cis-eQTL at the AOP2 and AOP3 genes (Wentzell et al. 2007). The Cvi and Sha accessions express AOP2 to produce alkenyl GSL. In contrast, the Ler and Bay-0 accessions express AOP3 to produce hydroxyl GSL. Col-0 is null for both AOP2 and AOP3, producing only the precursor methylsulfinyl GSL (Kliebenstein et al. 2001a; Wentzell et al. 2007). The GSL.OX QTL appear to be controlled by cis-eQTL regulating flavin-monoxygenase enzymes (GS-OX1 to 5) that oxygenate a methylthio to methylsulfinyl GSL (Hansen et al. 2007; Li et al. 2008). The GSL.OH QTL is a cis-eQTL in the GS-OH gene, which encodes the enzyme for the oxygenation reaction (Hansen et al. 2008).
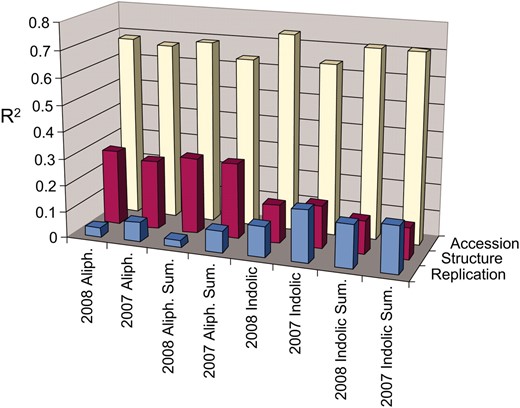
Trait variance explained by accession or structure across GSL trait types. The fraction of total trait variance (R2) attributable to the three main factors, accession, population structure, and replicate error, are presented for both the 2007 and 2008 experiments. Aliph, average variance per factor across all individual methionine-derived GSL; indolic, average variance per factor across all individual tryptophan-derived GSL; and sum, average variance across the descriptive summation and ratio variables that were used for the analysis per GSL group (Wentzell et al. 2007).
Prior to statistical analysis, the data was first queried for outliers (more than three standard deviations) and each of these was compared to the expected GSL profile for that accession to rule out planting error. GSL phenotype data were not normalized, as a number of phenotypes show bimodal distributions that are caused by polymorphisms within the previously cloned QTL (Figure S1) (Kliebenstein et al. 2001a). Further, known epistatic interactions create skewed normal distributions of GSL phenotypes within structured RIL populations, so the observed skewed normal and bimodal distributions are the biological expectation for these phenotypes. Finally, zero values within the data set are due to the absence of specific enzymes and as such are biological and not sampling zeroes. Given the biological expectations and previous observations that the residuals are typically normal, statistical normalization will lead to inappropriate biological inferences (Kliebenstein et al. 2001a,b; Wentzell et al. 2007). Previous analysis of glucosinolate and metabolomics data with complex point-mass statistics showed that normal statistical approaches function adequately to identify causal relationships (Taylor and Pollard 2009).
Parititioning H2 between population structure and accession:
Population substructure exists within A. thaliana accessions and previous genetic assessment of the 96 accessions analyzed here suggests a subdivision into eight distinct groups (Nordborg et al. 2002, 2005). To estimate broad-sense heritability for GSL traits explained by accession and previously defined population group (“structure”), we tested the model where the metabolite traits are
The 2007 and 2008 experiments showed differing variance distributions, despite care to avoid environmental variation and were therefore analyzed separately (Figure S1, Table S1, Table S2, Table S3). Previous studies have shown strong impact of genotype × environment interactions within glucosinolate QTL, but as the level of replication within each experiment was not sufficient to directly test the genotype × experiment interaction term, separate analyses of these two data sets were undertaken as a conservative approach.
Association mapping:
For single-locus genome-wide association mapping we adopted a previously published method, efficient mixed-model association (EMMA) (Kang et al. 2008). EMMA employs a mixed model (Kang et al. 2008) where each SNP is modeled as a fixed effect and population structure, represented as a genetic similarity matrix, is modeled as a random effect. Variance components to this mixed model were estimated directly using maximum likelihood as implemented in a modified version of the R/EMMA package (version 1.0.7; Supplementary Method, File S2) (Kang et al. 2008). Within this model, the four independent measures of each metabolite from each accession were directly incorporated as genetic averages for the accessions. The model was run independently for the 2007 and 2008 data sets (Supplemental Data set 1, File S1).
Criteria for determining significant associations:
The GWA P-value distributions were not uniform. As we are attempting to link these results with a preidentified set of QTL we chose a liberal criterion for calling a SNP significantly associated with GSL traits. Accepting the inherently elevated false discovery rate, we identified, independently for each trait, SNPs with P-values in the bottom 0.1 percentile of the distribution. Given previous observations that, for genuine associations, multiple SNPs per gene show statistical association with a trait (Zhao et al. 2007), we developed and tested three criteria for significant association between a trait and a gene. These were (1) at least two SNPs within ±1 kb of a gene's coding region were identified in this list, (2) at least 20% of the SNPs within ±1 kb of a gene's coding region were identified in this list, or (3) at least one SNP within ±1 kb of a gene's coding region were identified in this list. We used previously validated genetically variable GSL genes to identify the optimum criterion (Table 2 and Table S8): the “at least 2 SNPs/gene” criterion generated the lowest false negative rate and reduced false positive rates (Table S5 and Table S8). A similar comparison using all known and putative GSL related genes (Table S7) suggested a bias toward lower P-values compared to a tested set of randomly selected genes. As this trend was not significant, we concentrated on the smaller set of validated genes as a filter for true associations.
Linkage disequilibrium and hierarchical clustering of accessions:
Pairwise LD was calculated between all SNP within MAM1, MAM3, AOP3, and AOP2, as well as two loci proposed to have experienced recent positive selective sweeps (Clark et al. 2007) against all remaining 229,939 SNPs. The two genotypes of each SNP were arbitrarily designated as 0 or 1. We utilized both r2 (Hill and Robertson 1968) and χ2 (Hill 1975) tests for pairwise comparisons between SNP for these tests (Figure S3). For each query locus, we evaluated LD decay by first calculating LD between each query SNP and all SNPs within 100 kb. A cubic smoothing spline was fitted between the estimated LD and distance of the SNP pairs (smoothing parameter, spar = 1; R Development Core Team 2008). The LD block of a query locus is declared as the region where the fitted values are above the 99th percentile (or 98th for MAM3—no fitted values exceeded the 99th percentile) of the nonsyntenic LD determined between the corresponding set of query SNP and all SNP not on the same chromosome as the query locus (Figure S3).
To identify the haplotypes at the putative sweeps, we clustered the accessions using SNP within the LD blocks of MAM1, MAM3, AOP3, or AOP2 that are also in strong LD (>99th or >98th for MAM3, percentile of nonsytnenic LD) with at least one query SNP. Relationships between accessions were estimated using Jaccard's asymmetric similarity coefficient by recoding the major allele of each SNP within an LD block as 0 and the minor allele as 1. Accessions were then clustered via complete linkage hierarchical agglomeration (Figure S4).
AOP BAC Sequencing:
A BAC containing the AOP region from the Ler accession of Arabidopsis thaliana was purified using Qiagen high molecular weight DNA purification columns and shotgun sequenced at the University of California Davis College of Biological Sciences DNA Sequencing facility. The AOP region was reconstructed using VectorNTI (Invitrogen, Carlsbad, CA).
RESULTS
GSL and population structure:
We measured GSL from leaves of 96 A. thaliana accessions at 5 weeks postgermination in two independent experiments (2007 and 2008). Foliar tissue grown under these conditions has been used in multiple independent QTL analyses of GSL accumulation with recombinant inbred line (RIL) populations generated from subsets of these 96 accessions (Kliebenstein et al. 2001a, 2002b; Wentzell et al. 2007), thus providing independent corroboration of observed GSL phenotypes. This analysis detected 18 aliphatic GSL compounds and four indolic GSL compounds. We defined an additional 21 descriptive variables from these measurements, for a total of 43 traits (Table S1, Table S2, Table S3, Table S4) (Wentzell et al. 2007). The distribution of mean GSL accumulation for both the aliphatic and indolic GSL differed between the two experiments (Figure S1), thus we conservatively analyzed the experiments separately throughout (Table S1, Table S2, Table S3) (Kliebenstein et al. 2002a). However, significant correlation between traits in both experiments (Table S4) suggests that there is a common underlying genetic basis between the two experiments.
Population stratification has been noted in this set of A. thaliana accessions, where eight subpopulations were proposed as the most appropriate partition of genetic differences among the 96 accessions (Nordborg et al. 2002, 2005). As expected, we found population structure to be a confounding factor in our GWA study: we estimated population structure accounted for 25–30% of total variance for the aliphatic GSL and 10–15% of total variance for the indolic GSL (Figure 2). This is further demonstrated in Figure 3 showing unequal distribution of the six major GSL chemotypes (3- and 4-carbon forms of methylsulfinyl, alkenyl, and hydroxyalkyl GSL) across the accessions (Figure 1) (Kliebenstein et al. 2001c) within each of the eight subpopulations (Nordborg et al. 2002, 2005). By comparison, 65–75% of the total GSL variation is attributable to variation among the accessions (Figure 2). Despite the confounding association between population structure and GSL, a large portion of GSL phenotypic variation appears independent of this structure, providing promise for detection of GSL-associated loci in our GWA study.
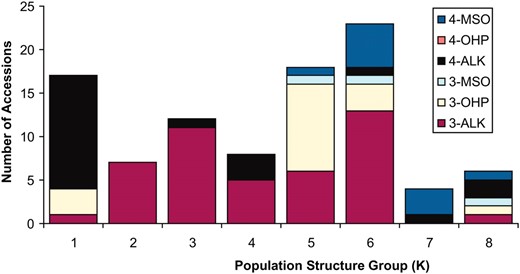
GSL distribution across population structure. The 96 A. thaliana accessions were grouped by their estimated population structure (1–8) as previously classified (Nordborg et al. 2002, 2005). The accessions were labeled by their previously recognized chemotypes as generated by the combination of three GSL phenotypic outcomes of variation at AOP (alkenyl, hydroxyalkyl, and methylsulfinyl) and the two known GSL phenotypes from MAM (3C vs. 4C) (Kliebenstein et al. 2001c). The chemotypes are labeled by their predominant glucosinolate; 4-MSO accumulates 4-methylsulfinylbutyl, 4-OHB accumulates 4-hydroxybutyl, 4-Alk accumulates But-3-enyl, 3-MSO accumulates 3-methylsulfinylpropyl, 3-OHP accumulates 3-hydroxypropyl, and 3-Alk accumulates allyl. The number of accessions in each of the six main GSL classes generated by AOP and MAM variation are shown for each of the eight subpopulation groups. The distribution is highly nonrandom (χ2, N = 95, P < 0.001).
GWA tests:
Using 229,940 SNPs available for this collection of 96 accessions, we conducted GWA mapping using a maximum likelihood approach that accounts for genetic similarity (EMMA) (Kang et al. 2008). This identified a large number of significant SNPs and genes for both experiments (Table 1). To control for false positive and false negative rates in GWA studies we tested three criteria for significance of genes. These criteria required ≥1 SNP, ≥2 SNPs, or ≥20% of SNPs within a gene to show significant association with a specific GSL trait. This test was independently repeated for all GSL traits for each experiment (Table S8). Comparing the results, the more stringent ≥2 SNPs/gene criterion greatly decreased the overall number of significant genes identified. We compiled a list of 172 genes with the potential to directly or indirectly affect GSL synthesis, including genes controlling synthesis of methionine or tryptophan precursors, and determined the proportion of these genes identified under each of the three tested significance criteria (Table S6). The criterion requiring ≥2 significant SNPs–phenotype associations per gene identified the highest fraction of this a priori set of GSL genes, suggesting that this criterion decreases the false positive rate with no associated dramatic decrease in detection of true positive associations (Table S8). Our approach recovered 16 genes that have been cloned as GSL QTL and are known to vary within these 96 accessions (Table 2).
Genome-wide association mapping summary
2007 | 2008 | |
|---|---|---|
| Total no. SNP tested | 229,940 | 229,940 |
| Total no. genes tested | 31,505 | 31,505 |
| Avg no. sig SNP per trait | 230 | 229 |
| Total no. unique sig genes over all traits | 1,056 | 893 |
| Avg no. sig genes per trait | 37 | 36 |
| Range (no. genes sig per trait) | 17–57 | 22–49 |
| Avg no. sig SNP per gene per trait | 3 | 3 |
| Range (avg no. sig SNP per gene per trait) | 2–4 | 2–4 |
| Max no. sig SNP per gene per trait | 8 | 8 |
| Range (max no. sig SNP per gene per trait) | 3–15 | 4–18 |
Summary results from GWA mapping on two different GSL data sets (2007 and 2008) from the same 96 accessions. Sig, significant; avg, average; max, maximum.
Recovery of known causal QTL GSL genes in GWA mapping
AGI | Name | 2007 | 2008 |
|---|---|---|---|
| AT1G12140 | GSOX5 | — | — |
| AT1G24100 | UGT74B1 | — | — |
| AT1G62540 | GSOX2 | — | — |
| AT1G62560 | GSOX3 | — | — |
| AT1G62570 | GSOX4 | — | Yes |
| AT1G65860 | GSOX1 | — | — |
| AT2G25450 | GS-OH | — | — |
| AT2G31790 | UGT74C1 | — | — |
| AT4G03050 | AOP3 | Yes | Yes |
| AT4G03060 | AOP2 | Yes | Yes |
| AT5G07690 | MYB29 | — | — |
| AT5G07700 | MYB76 | — | — |
| AT5G23010 | MAM1 | Yes | Yes |
| AT5G57220 | CYP81F2 | — | — |
| AT5G60890 | ATR1/MYB34 | — | — |
| AT5G61420 | MYB28 | — | — |
Shown are genes that have been previously proven to be both genetically polymorphic and control a QTL for GSL accumulation within the 96 accessions used in this analysis (Kliebenstein 2009). Yes, if the gene has ≥2 SNPs showing significant association to one or more GSL traits in the corresponding GWA; —, no significant associations.
In all, our approach identified 1056 genes significantly associated with at least one GSL trait for the 2007 experiment and 893 significant genes for the 2008 experiment. To visualize the relationships of these gene-to-trait associations and to test the breadth of phenotypic effects (i.e., whether detected associations control specific traits or suites of traits), we divided GSL traits into four biosynthetic groups on the basis of their biochemical and genetic regulation (Figure 1) (Kliebenstein et al. 2002a; Gigolashvili et al. 2007a,b; Hirai et al. 2007; Sønderby et al. 2007; Hansen et al. 2008; Kliebenstein 2009). These groups were INDOLE, all indolic GSL traits; OHBUT, all 2-hydroxy-but-3-enyl traits; SC, all 3- and 4-carbon-long aliphatic GSL-related traits except the OHBUTs; and LC, all 5 carbon and longer aliphatic GSL-related traits. The majority of significant gene–trait associations detected were unique to individual trait groups (Figure 4). In particular, little overlap is observed between the aliphatic (SC, LC, OHBUT) and indolic GSL (Figure 4), reflecting the independence of their biosynthetic pathways (Figure 1A). This lack of overlap agrees with the low correlation between metabolites in these groups (Table S4). However, the lack of common genetic control of the INDOLE, OHBUT, and SC groups contrasts with previous observations whereby QTL detected in structured populations control all three phenotype classes (Pfalz et al. 2007; Wentzell et al. 2007).
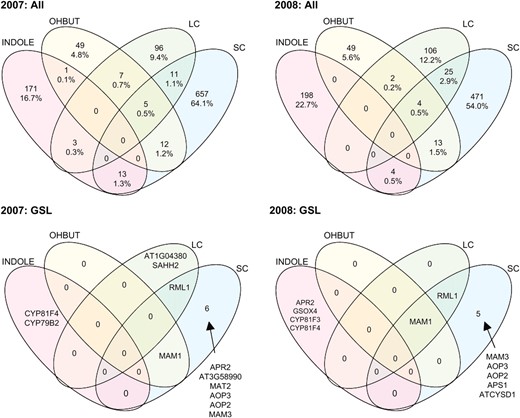
Most gene effects are specific to a GSL trait group. GSL were separated into four trait groups on the basis of previous biochemical analysis. INDOLE, indolic GSL; OHBUT, 2-hydroxy-but-3-enyl GSL traits; LC, 7- and 8-carbon-long methionine-derived GSL; and SC, 3- and 4-carbon-long methionine-derived GSL. The number and percentage of genes identified by GWA as significantly associated with one or more traits within each group are shown for 2007 and 2008 in the top panel. The bottom panel shows the identity of putative GSL genes using the full 172 gene list found to be significant.
Two gene lists were used to evaluate the power of our GWA analysis to detect association between GSL traits and genetic polymorphisms. The first is a list of 16 genes known to control GSL QTL and the second list contains an additional 156 genes with the potential to contribute to the synthesis of GSL either directly or indirectly (172 genes total; Table S6). Three major genes found via GWA with aliphatic GSL variation were the AOP2, AOP3, and MAM1 genes that are the causal genes controlling the two major GSL-related QTL, GSL.AOP and GSL.Elong (MAM), (Kliebenstein et al. 2001a,c; Kroymann et al. 2003; Wentzell et al. 2007) (Figure 4). Two additional genes on the list of 16 cloned QTL, MAM3 and GSOX4, were also identified as impacting GSL phenotypes although the linkage of GSOX4 to INDOLIC traits was unexpected, given its role in aliphatic GSL metabolism (Figure 4) (Benderoth et al. 2006; Hansen et al. 2007; Li et al. 2008). Interestingly, 11 of the 16 known causal genes showed no significant association with any GSL trait. While failure to detect some of these loci via GWA analysis may be explained by low frequencies of informative alleles among the set of accessions studied, both the MYB28 and MYB29/76 QTL are at intermediate frequency within the species (Kliebenstein et al. 2001b; Sønderby et al. 2007; Wentzell et al. 2007). Alternatively, epistatic dependence of the MYB28 and MYB29/76 QTL on GSL-AOP and GSL-Elong may reduce our power to detect the effects of these loci via GWA (Wentzell et al. 2007).
We increased this list of known GSL-affecting genes with an additional 156 genes implicated in direct or indirect synthesis of GSL within the model accession Col-0. Only a few of these 156 showed an association with GSL in the 96 accessions (Figure 4), including RML1 (At4g23100; also known as CAD2, GSH1, and PAD2), a glutamate cysteine ligase involved in glutathione metabolism. Previous studies showed that this gene indirectly controls GSL accumulation via a regulatory and/or biosynthetic linkage (Schlaeppi et al. 2008); experiments in our laboratory have independently confirmed this capacity. While this gene was not previously known to control natural variation in GSL metabolism, the existence of naturally variable transcript accumulation from this locus (supported by detection of a cis-eQTL within the Bay-0 × Shahdara RIL population) suggests At4g23100 as a strong candidate for containing a causal polymorphism altering GSL phenotypes and potentially other glutathione-dependent phenotypes within A. thaliana (Kliebenstein et al. 2006b; West et al. 2007). Beyond these 172 known and putative genes, hundreds of additional new gene–trait associations identified in these analyses await functional validation in future studies.
Clusters of significant associations:
While GWA did identify the causal AOP2, AOP3, and MAM1 genes, we noted an enrichment of genes significantly associated with multiple GSL traits in these regions; some showing associations of greater statistical significance than the known causal polymorphisms. To systematically test for GWA clustering we calculated the number of GSL traits significantly associated with each tested gene in the A. thaliana genome and averaged this within a 25-gene sliding window. The gene order was randomly permuted across the genome using 1000 bootstrap resamplings, identifying a maximal value of 0.86 traits per gene per 25 gene window. Interestingly, seven genomic regions exceeded this empirical threshold; most prominently the AOP and MAM regions, averaging 3.2 and 2.3 traits per gene, respectively (Figure 5). This enrichment of significant GWA gene–trait associations extended hundreds of genes and several hundred kilobases around both loci (Figure 5). Gene-specific studies have shown that both loci have normal or elevated levels of diversity suggesting this nonrandom GWA clustering is not an artifact of a loss of diversity around either locus (Kliebenstein et al. 2001a; Wright et al. 2002; Benderoth et al. 2006).
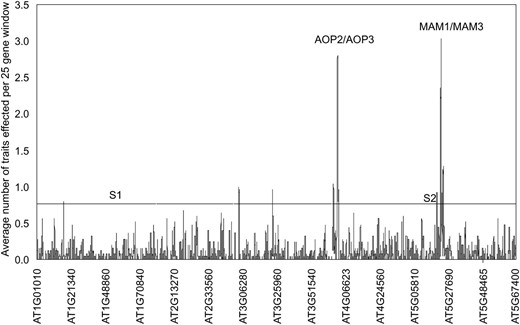
Genomic clusters of significant associations. A 25-gene sliding window analysis surveys the genomic distribution of genes associated with GSL traits. The sliding window took the average number of traits identified across every 25 genes such that if the value crosses 1, the average for that 25-gene window is that each gene is significantly associated with one GSL trait. Results for the 2007 and 2008 data sets were combined. The horizontal line represents the 95% percentile value for a 25-gene window from 1000 random bootstrap analyses that randomly shuffled gene position within the genome. The y-axis shows the order of genes on a given chromosome such that 5.1 is the position of At5g10000. “S1” and “S2” indicate the position of previously identified selective sweeps on chromosomes I and V.
Given that the average LD in A. thaliana is <10 kb, one interpretation of these results is that these two regions harbor hundreds of genes contributing to GSL phenotype variation (Nordborg et al. 2002, 2005; Kim et al. 2007). The observation that polymorphism in the MAM1 gene is sufficient to explain all of the GSL variation associated with the GSL-Elong QTL in mapping populations derived from accessions represented in this GWA population, Ler × Cvi, Ler × Col-0, and Bay-0 × Sha, argues against this interpretation (Figure 9) (Kroymann et al. 2003). Additionally, analysis of 10,000 meiotic recombination events around the MAM locus in Ler × Col-0 showed that the MAM genes are the only genes in this region exerting detectable effects on GSL variation (Haubold et al. 2002; Kroymann et al. 2003; Textor et al. 2004; Benderoth et al. 2006). A similar analysis of the AOP locus in the same RIL and F2 populations showed that polymorphisms within AOP2 and AOP3 were sufficient to explain the observed GSL variation attributed to that region (Kliebenstein et al. 2001a, 2001b; Wentzell et al. 2007). Thus, the high density of significant gene–trait association detected near AOP and MAM is likely due to linkage with the causal polymorphisms; these polymorphisms are not likely causal themselves. These gene–trait associations are hereafter referred to as linked associations.
LD between causal and nearby genes:
Because the causal polymorphism controlling phenotypic variation is not necessarily part of the tested SNP data set, GWA mapping relies on LD between the causal polymorphism and test polymorphism. A possible explanation for the elevated clustering of trait–gene associations observed around the MAM and AOP loci is extended LD, even though there is genetic diversity at both loci (Figures 6 and 7). We estimated LD between each SNP within the MAM and AOP loci and each of the 229,940 genome-wide SNPs (Figure S2). As predicted, extended LD around both loci was observed, but only for a subset of SNPs within these four genes. A regional elevation of LD (P(χ2) < 10−4 with >20% of the SNP within 100 kb) surrounding the AOP locus involved only 9 of 13 SNPs within AOP2 and AOP3; of these, 7 showed more associations with GSL traits than the average SNP (in at least one of the two data sets) (Figure 6). A similar elevation of LD in the region surrounding the MAM genes involved only 15 of 18 MAM1 SNPs and 7 of the 14 MAM3 SNPs; of these, 10 of the MAM1 SNPs and 3 of the MAM3 SNPs also were associated with a higher number of glucosinolate traits than the average SNPs (Figure 7). In contrast, the SNPs not participating in extended LD at these two loci were not significantly associated with GSL traits in either of the two data sets (Figures 6 and 7).
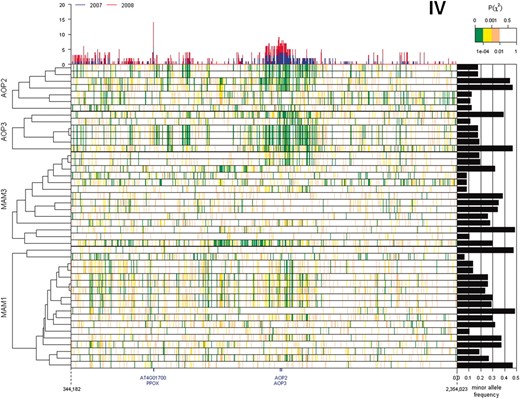
Extended LD surrounding AOP2 and AOP3. Pairwise linkage disequilibrium between SNPs within coding regions of query genes (AOP2, AOP3, MAM1, and MAM3) and SNPs within ±1 Mb of the AOP locus is shown as a heatmap with significantly strong to weak LD indicated by green to white, respectively. The top histogram shows the number of GSL phenotypes significantly associated with individual SNP in this region for both the 2007 and 2008 data sets. The right bar graph shows the minor allele frequency of each SNP within the query genes. The cladogram on the left indicates the hierarchical clustering of linkage patterns for each SNP position within the query genes.
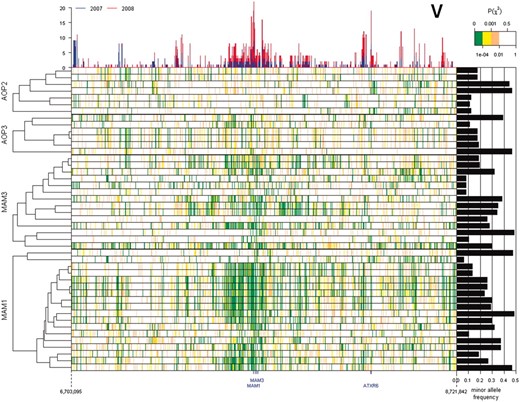
Extended LD around MAM1 and MAM3. Pairwise linkage disequilibrium between SNPs within coding regions of query genes (AOP2, AOP3, MAM1, and MAM3) and SNPs within ±1 Mb flanking the MAM locus is shown as a heatmap with significantly strong to weak LD indicated by green to white, respectively. The top histogram represents the number of GSL phenotypes showing a significant association with the individual SNP in this region for both the 2007 and 2008 data sets. The right bar graph shows the minor allele frequency of each SNP within the query genes. The cladogram on the left indicates the hierarchical clustering of linkage patterns for each SNP position within the query genes.
For SNPs in both the AOP and MAM loci, LD extended approximately ±75 kb; we refer to these regions of extended LD as LD blocks (Figure S3). This observation suggests that the clusters of GWA associations detected within these LD blocks are caused by long-range LD surrounding the AOP and MAM genes, such that SNPs in genes with little or no effect on GSL phenotypes are declared significant due to their linkage with SNPs at the causal AOP and MAM genes, hence linked associations.
To test whether LD blocks generally generate clusters of linkage associations, we examined two previously identified recent positive selective sweeps on chromosome I (sweep 1) and chromosome V (sweep 2) (Clark et al. 2007). Specific tests for association of GSL phenotypes with SNPs in these regions showed that while both regions showed slow LD decay, neither showed clusters of significant associations similar to those observed for AOP and MAM (Figure 5 and Figure S2). Extended LD is therefore not sufficient to generate clusters of associations: there is a further requirement for linkage of the associated polymorphisms with a causal polymorphism for the phenotype in question. Hence, while extended LD may increase the detection of noncausal associations, this is unlikely to occur in the absence of at least one causal association within the region.
Evolution of GSL phenotypes:
Extended LD generally arises because recombination has not had sufficient time or opportunity to occur within the region. This is often considered a sign of selection. Thus, the unusually extended LD around MAM and AOP likely is associated with polymorphisms that have increased in frequency within the population, possibly via selection. The presence of multiple SNPs showing identical LD decay patterns at both loci supports this supposition, though the moderate to high levels of sequence diversity at these loci argue against directional selection (barplots on Figures 6 and 7). Further, given that LD decays on average of 10 kb in A. thaliana the lack of recombination at these two loci also suggests the action of selection (Kim et al. 2007).
To determine how diversity at the observed AOP and MAM LD blocks relate to the evolution of GSL phenotypes, we compared the corresponding haplotype groups generated using SNPs that contribute to these LD blocks to the GSL phenotypes predominantly expressed by the corresponding accessions (Figure 8). If these LD patterns were associated with selection for particular GSL chemotypes, clustering of accessions based on the genotypes within an LD block should reflect the accessions' GSL chemotypes. Such a correlation was observed with all four genes of both the AOP and MAM loci (Figure 8 and Figure S4).
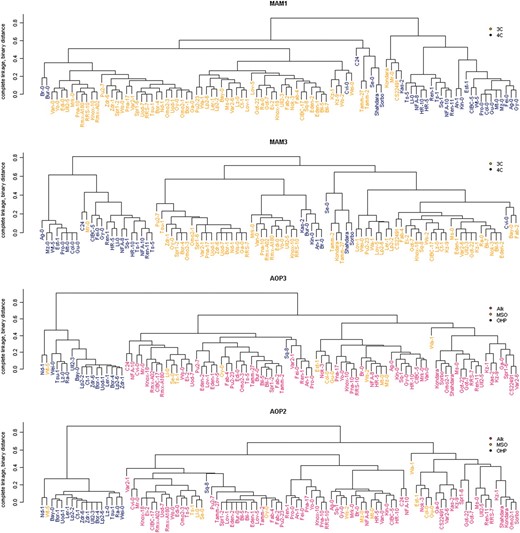
Cladograms of accessions at the AOP and MAM loci. Cladistics relationships were determined using 82 (MAM1), 45 (MAM3), 139 (AOP3), and 88 (AOP2) SNPs within the identified LD blocks of the respective loci. Pairwise SNP distances were estimated with Jaccard's similarity coefficient by representing genotypes as 0 (major allele) and 1 (minor allele) and the cladogram constructed using complete linkage hierarchical clustering. In the MAM cladograms, accessions favoring the production of 3-carbon GSL are shown in orange and those favoring 4-carbon GSL are shown in blue. For the AOP2/3 cladograms, accessions that predominantly produce alkenyl, methylsulfinyl, or hydroxypropyl GSL are colored red, orange, and blue, respectively.
At both loci, specific haplotypes for the LD blocks correspond to subpopulations of accessions with distinct GSL chemotypes (Figures 6–Figures 8 and Figure S4). In particular, SNPs at the AOP locus define a specific haplotype where, with the exception of Sq-8, this AOP haplotype is exclusively associated with the 3-hydroxypropyl (OHP) GSL chemotype within A. thaliana (Figure 8). To better understand the evolution of this locus, we obtained a BAC covering this region in the Ler accession, which exhibits the 3-hydroxypropyl GSL chemotype and sequenced the AOP region. This showed that 3-hydroxypropyl GSL accumulation is associated with an inverted duplication of AOP1 and a complete inversion of AOP2 and AOP3 such that their promoters are exchanged (Figure 9). In spite of being on separate chromosomes, the MAM and AOP LD blocks display trans-LD with each other, reflecting the known interaction between these two loci (Mithen et al. 1995; Kliebenstein et al. 2001b; Wentzell et al. 2007). For instance, the observation of 3-hydroxypropyl GSL is dependent on both the appropriate AOP haplotype for the accumulation of hydroxypropyl vs. alkenyl or methylsulfinyl GSL and MAM1 haplotype for the production of 3C vs. 4C GSL (Figure 1 and Figure S4).
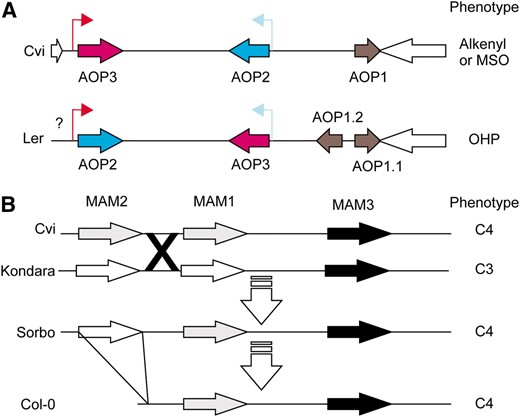
Structure of the MAM and AOP loci. (A) A diagram of AOP structure in A. thaliana accessions representing the two major haplotype classes. White arrows show the flanking genes in the reference Col-0/Cvi genome for this locus. The color shows the combination of promoters and ORF for the Cvi/Col genomic fragment: AOP2 ORF and promoter are blue while the AOP3 ORF and promoter are red. An inversion and duplication led to the generation of the Ler sequence. The question mark indicates that there is an insertion of an unknown size in this region. (B) A diagram of the GSL.Elong (MAM) region in A. thaliana accessions (Kroymann et al. 2003). Genes are shaded as most similar to Sorbo MAM1 (gray) or Sorbo MAM2 (white). The triangle from Sorbo to Col-0 indicates a large deletion and the X indicates a putative crossover between Cvi and Kondara. Predominant GSL side chain length is indicated on the right as either C3 or C4.
The majority of accessions (24 of 31) producing predominantly 4C GSL possess the same haplotype at MAM1; the other 7 accessions appear to represent at least four convergent evolutions of the same biochemical chemotype (Figures 8, 9, and Figure S4) (Kroymann et al. 2003). Interestingly, a genome rearrangement event in the MAM LD block involves the deletion of an entire gene within the Col-0 MAM locus, echoing the complicated history of rearrangements observed at AOP (Figure 9) (Kroymann et al. 2003). Together, the observed haplotype patterns at AOP and MAM support the hypothesis that haplotypes within extensive LD blocks may arise from derived polymorphisms that have since increased in frequency within the species. Further, this link between LD blocks and a specific derived biochemical phenotype suggests that these biochemical phenotypes may be subject to natural selection.
DISCUSSION
In recent years, association mapping studies have arguably become more popular than classical QTL mapping studies for elucidating genetic polymorphisms underlying complex traits. To determine its usefulness in furthering our knowledge of glucosinolate genetic architecture we performed a GWA analysis using 96 natural A. thaliana accessions and compared the results to existing QTL analyses, including a large number of naturally variable loci contributing to GSL biosynthesis and regulation (Table 2) (Kliebenstein 2009). Numerous significant associations were identified by GWA, including known causal genes and genes previously implicated in control of GSL synthesis that have not been previously identified as naturally polymorphic. Further, a large number of associations linked GSL phenotypes with genes not previously implicated in glucosinolate metabolism. These include loci contributing to blue light perception and ABA metabolism; their role in glucosinolate metabolism and the potential interaction of these pathways will require experimental validation. Interestingly, associations between GSL phenotypes and most QTL causal genes were not detected in this GWA study even with a permissive significance threshold, possibly due to the confounding influence of population structure (Figures 2 and 3).
While GWA mapping has potential to directly identify specific causal polymorphisms, in reality the actual causal SNP may be lost in a forest of linked associations. We observed large clusters of significant gene–trait associations surrounding the previously cloned AOP/GSL.AOP and MAM/GSL.Elong QTL, accounting for nearly 12% of the observed significant associations (Figures 5–Figures 7) (Kliebenstein et al. 2001a; Kroymann et al. 2003). Thus, it appears that the identified cluster of phenotype–genotype associations represent linkage associations where the phenotype-associated polymorphisms are not causal but instead show a genetic correlation with the true causal polymorphism. One approach to locating the causal gene within a linkage cluster may be to increase the population size, in hope of also increasing the number of recombination events within the population, and thus the discrimination power for GWA tests. This presumes that evolution, selection, and recombination between the accessions are independent. As evidenced by the AOP and MAM loci, the assumption of independence is not always valid and increasing population sizes may not increase power (de Bakker et al. 2005). A more promising approach would be to use GWA methods to identify interesting regions and then develop structured QTL populations to provide finer genetic resolution.
Glucosinolates and selective sweeps:
Several hypotheses might explain the slow LD decay around the AOP and MAM loci and the associated maintenance of LD blocks. A selective sweep may have increased the frequency of the derived AOP and MAM haplotypes, causing extended LD (Palaisa et al. 2004). This possibility is supported by the observation that the 3-hydroxypropyl GSL-accumulating accessions display the highest fitness in an environment with predominantly specialist insect herbivores that have evolved to overcome GSL defenses (Bidart-Bouzat and Kliebenstein 2008). Further, A. thaliana accessions possessing the 4C GSL-associated haplotype at the MAM locus showed the second-highest fitness in the same experiment (Bidart-Bouzat and Kliebenstein 2008). Demonstrated fitness benefits in the wild for both the 3-hydroxypropyl AOP haplotypes and the Col-0 MAM haplotypes could therefore drive selection of these haplotypes in the presence of specialist herbivores, generating the observed pattern of extended LD.
Interestingly, neither the AOP nor MAM loci show the decreased nucleotide diversity which is a hallmark of recent positive selective sweeps identified in plants and other species (Nurminsky et al. 1998; Przeworski 2002; Palaisa et al. 2004; Wright et al. 2005; Clark et al. 2007). The selective sweeps hypothesized to have occurred at the AOP and MAM loci may thus represent early sweep events that are ongoing. Yet given that the extended LD within both loci is <200 kb, and that the recombination breakpoints defining the LD blocks are not absolute, it is likely that derived haplotypes were not recently generated (Przeworski 2002; Palaisa et al. 2004).
Many methods used to search for selective sweeps assume the action of directional selection and so may not be appropriate for detecting complex selection pressures such as balancing or fluctuating selection (Przeworski 2002). AOP and MAM may in fact be subject to such pressures. While the 3-hydroxypropyl AOP and 4C MAM haplotypes were associated with high fitness in the presence of specialist herbivores in the wild, they are not the most fit haplotypes in the presence of generalist herbivores (Mauricio 1998; Kliebenstein et al. 2002b; Bidart-Bouzat and Kliebenstein 2008). Thus, an ever changing frequency of specialist vs. generalist herbivores in the environment may lead to balancing or fluctuating selection, which could generate the extended LD observed at these loci. This hypothesis is supported by studies demonstrating that the genes underlying GSL phenotypes are subject to balancing selection in the wild as a consequence of annual fluctuations in the relative abundance of generalist and specialist herbivores (Lankau 2007; Lankau and Strauss 2008; Lankau and Kliebenstein 2009). Thus, it is possible that balancing selection maintains blocks of LD at both AOP and MAM that are responsible for a significant fraction of linkage associations detected in GWA mapping of GSL traits.
A final explanation for the observed pattern of extended LD at AOP and MAM is that bottlenecks in A. thaliana populations led to an increase in the observed haplotypes as a consequence of genetic drift. However, this would be expected to leave a wider genomic signature of extended LD than the 150–200 kb surrounding the AOP and MAM loci (Figures 6, 7, and Figure S3) (Simonsen et al. 1995). Additionally, a population bottleneck should have resulted in dramatic loss of diversity, but both loci show moderate to high minor allele frequencies. Further, genetic drift should have ensured independent segregation of concurrently swept but unlinked regions; as displayed by two previously proposed selective sweeps on chromosome I and V (Figure S2) (Clark et al. 2007). In contrast with those expectations, the AOP and MAM LD blocks show trans-LD, consistent with the biochemical requirement for the presence of MAM C3 allele to observe the AOP GSL chemotype. Thus, bottleneck or random drift provides only inefficient explanation of the observed patterns of polymorphism at AOP and MAM.
AOP and new haplotype/chemistry formation:
The major haplotype at the AOP LD block is associated with OHP GSL accumulation. This LD block haplotype appears to result from a local inversion that exchanged the promoters of two genes (Figure 9A). In the A. thaliana Cvi and Col-0 accessions, the AOP3 gene product hydroxylates 3C GSL within seeds and is controlled by a seed-specific promoter while the product of AOP2 generates alkenyl GSL within leaves and is controlled by a leaf-specific promoter. Hence, this AOP2/3 inversion has caused the previously seed-specific 3-hydroxypropyl GSL to be produced in the leaf (Figure 9) (Kliebenstein et al. 2001c). These inversions are also associated with a local depression in recombination rates surrounding the AOP locus (Kliebenstein et al. 2001a; Pfalz et al. 2007). Local inversion therefore seems to have maintained LD around this locus.
Nonsyntenic linkage associations vs. coadaptive complexes:
Interestingly, a cluster of GWA associations was detected near RML1 on chromosome IV, suggesting that RML1 is a causal gene for a linkage association block (Figure S2). However, this interpretation is complicated by the observation that RML1 also shows elevated trans-LD with the MAM1 locus, located on chromosome V (Figure S2). As such, RML1, while having the biological capacity to affect GSL accumulation, may be detected as significantly associated with GSL phenotypes due to nonrandom association with MAM1. It is also possible that both genes control natural variation in GSL but that allelic variation at both loci is structured via epistatic interaction (Whitlock et al. 1995). Nonrandom distribution of alleles at unlinked GSL loci has been previously identified at both biosynthetic and hydrolysis loci and is typically associated with epistatic interactions that control insect resistance in A. thaliana (Lambrix et al. 2001; Kliebenstein et al. 2005a; Bidart-Bouzat and Kliebenstein 2008; Hansen et al. 2008; Kliebenstein 2009). This suggests that discounting phenotype–genotype association of any SNP because it shows linkage with a causal polymorphism may not be biologically warranted, especially if the queried trait is subject to selection. Testing whether the detected association between RML1 and GSL phenotypes is generated by trans-LD with MAM1 or an epistatic interaction with MAM1 will require the development of a structured population to determine whether there is a QTL at RML1 and if it interacts with the MAM QTL.
QTL genes not found in GWA:
Previous analyses identified 16 causal polymorphic genes for GSL QTL in structured A. thaliana populations. However, GWA only identified 4 of these known causal polymorphic genes. One potential hindrance to detection of these associations is the strong correlation between GSL phenotypes and population structure, which could obscure causal gene–trait associations through normalization for population structure (Figure 3). Another potential explanation for missing these genes is allele frequency: structured populations usually contain only two alleles at a given locus, but a large number of SNPs in A. thaliana have minor allele frequencies <20%, which can complicate GWA (Spencer et al. 2009). However, GWA analysis did not identify the MYB loci, despite intermediate allele frequencies, suggesting that allele infrequency cannot explain all of the missed genes. A potentially related obstacle to identification of causal loci by GWA is genetic epistasis: at least six loci (MAM1, AOP2, GSOX4, GS-OH, MYB28, MYB29) show both genetic and functional epistasis controlling GSL natural variation (Kliebenstein et al. 2005a; Kliebenstein 2009). Of these six loci, only three (MAM1, AOP2, GSOX4) were recovered in the current study, suggesting that the effects of the identified genes may have concealed their epistatic partners. For instance, the MYB28 locus is epistatic to the MAM1, AOP2, and GSOX4 loci, requiring a precise allele combination at these three loci before its effects are measurable. Thus, the allele frequency at the MYB28 locus is subdivided by the other epistatic loci, which create statistical limitations similar to minor allele frequencies. Interestingly, it has recently been shown that polymorphic epistatic loci can be a major contributor to population structure, suggesting a causal relationship between the known epistatic interactions and measured genome-wide population structure (Neher and Shraiman 2009).
Conclusion:
This study used the model quantitative genetic system of A. thaliana GSL biosynthesis to show the potential of selective sweeps and LD blocks to generate linkage association hotspots in genome-wide association mapping. We noted the existence of trans-LD between MAM1 and a known GSL gene, RML1, suggesting that this is epistatic to the MAM locus. Further, epistasis and population structure can diminish our ability to detect causal genes via GWA mapping. It will be interesting to see how commonly extended LD blocks generate clusters of linkage associations. Further work is also required to optimize methods to distinguish true causal association from linkage association. It will be interesting to determine the frequency of associations between phenotypic variation and population substructure and whether these occur by chance or represent a common outcome of natural selection.
Footnotes
Supporting information is available online at http://www.genetics.org/cgi/content/full/genetics.109.108522/DC1.
Present address: Seminis Vegetable Seeds, 37437 State Highway 16, Woodland, CA 95695.
Present address: Department of Botany, University of British Columbia, 3529-6270 University Blvd., Vancouver, BC V6T 1Z4, Canada.
Footnotes
Communicating editor: L. M. McIntyre
Acknowledgements
We thank Daphne Preuss for providing the Ler BAC used to elucidate the structure of the AOP locus. We also thank Juergen Kroymann, Jeffrey Ross-Ibarra, Julin Maloof, three anonymous reviewers, and the editor for insightful comments on this manuscript. We thank Bjarne Gram Hansen for help with setting up the broader set of metabolic GWA experiments of which this manuscript is but a piece. Finally, we would like to thank Magnus Nordborg, Justin Borevitz, and Joy Bergelson and their groups for generating the SNP data key to the success of this work. This work was supported by National Science Foundation grants DBI 0642481 and DBI 0820580 (to D.J.K.).
References
Abramoff, M. D., P. J. Magelhaes and S. J. Ram,
Alcazar, R., A. V. Garcia, J. E. Parker and M. Reymond,
Atwell, S., Y. Huang, B. J. Vilhjalmsson, G. Willems, M. Horton et al.,
Benderoth, M., S. Textor, A. J. Windsor, T. Mitchell-Olds, J. Gershenzon et al.,
Bomblies, K., J. Lempe, P. Epple, N. Warthmann, C. Lanz et al.,
Borevitz, J. O., S. P. Hazen, T. P. Michael, G. P. Morris, I. R. Baxter et al.,
Byrne, P. F., M. D. McMullen, B. R. Wiseman, M. E. Snook, T. A. Musket et al.,
Caicedo, A. L., J. R. Stinchcombe, K. M. Olsen, J. Schmitt and M. D. Purugganan,
Carlborg, O., and C. S. Haley,
Falconer, D. S., and T. F. C. Mackay,
Filiault, D. L., C. A. Wessinger, J. R. Dinneny, J. Lutes, J. O. Borevitz et al.,
Hansen, B. G., R. E. Kerwin, J. A. Ober, V. M. Lambrix, T. Mitchell-Olds et al.,
Hirai, M., K. Sugiyama, Y. Sawada, T. Tohge, T. Obayashi et al.,
Hirschhorn, J. N., and M. J. Daly,
Keurentjes, J. J. B., J. Y. Fu, I. R. Terpstra, J. M. Garcia, G. van den Ackerveken et al.,
Kliebenstein, D., V. Lambrix, M. Reichelt, J. Gershenzon and T. Mitchell-Olds,
Kliebenstein, D. J.,
Kliebenstein, D. J.,
Kroymann, J., S. Donnerhacke, D. Schnabelrauch and T. Mitchell-Olds,
Lankau, R. A., and D. J. Kliebenstein,
Liu, B.-H.,
Lynch, M., and B. Walsh,
Mauricio, R.,
Mithen, R., J. Clarke, C. Lister and C. Dean,
Neher, R. A., and B. I. Shraiman,
Palaisa, K., M. Morgante, S. Tingey and A. Rafalski,
R Development Core Team,
Taylor, S., and K. Pollard,
Textor, S., S. Bartram, J. Kroymann, K. L. Falk, A. Hick et al.,
Wentzell, A. M., H. C. Rowe, B. G. Hansen, C. Ticconi, B. A. Halkier et al.,
Whitlock, M. C., P. C. Phillips, F. B.-G. Moore and S. J. Tonsor,
Zhang, X., S. Shiu, A. Cal and J. O. Borevitz,
