


Abstract
The meiotic prophase chromosome has a unique architecture. At the onset of leptotene, the replicated sister chromatids are organized along an axial element. During zygotene, as homologous chromosomes pair and synapse, a synaptonemal complex forms via the assembly of a transverse element between the two axial elements. However, due to the limitations of light and electron microscopy, little is known about chromatin organization with respect to the chromosome axes and about the spatial progression of synapsis in three dimensions. Three-dimensional structured illumination microscopy (3D-SIM) is a new method of superresolution optical microscopy that overcomes the 200-nm diffraction limit of conventional light microscopy and reaches a lateral resolution of at least 100 nm. Using 3D-SIM and antibodies against a cohesin protein (AFD1/REC8), we resolved clearly the two axes that form the lateral elements of the synaptonemal complex. The axes are coiled around each other as a left-handed helix, and AFD1 showed a bilaterally symmetrical pattern on the paired axes. Using the immunostaining of the axial element component (ASY1/HOP1) to find unsynapsed regions, entangled chromosomes can be easily detected. At the late zygotene/early pachytene transition, about one-third of the nuclei retained unsynapsed regions and 78% of these unsynapsed axes were associated with interlocks. By late pachytene, no interlocks remain, suggesting that interlock resolution may be an important and rate-limiting step to complete synapsis. Since interlocks are potentially deleterious if left unresolved, possible mechanisms for their resolution are discussed in this article.
MEIOSIS is a specialized cell division found in all organisms with a sexual life cycle. It requires the intricate coordination and precise timing of a series of cellular processes to ensure proper chromosome segregation and reduction in ploidy level. Meiotic prophase is initiated by the formation of cytologically characteristic leptotene chromosomes, which requires the installation of axial elements (AEs) onto the chromosomes. Cohesin complexes, required for sister chromatid cohesion during mitosis and meiosis, are an essential component of AE formation or maintenance (Klein et al. 1999). After the formation of double-strand breaks to initiate recombination, there is a global reorganization of chromosomes at the leptotene–zygotene transition as telomeres cluster on the nuclear envelope in the bouquet configuration (Harper et al. 2004). As zygotene proceeds, the close association of the paired homologs is stabilized by formation of the synaptonemal complex (SC). During synapsis, a transverse element is installed between the AEs, now called the lateral elements (LEs), to assemble the tripartite ladder-like SC (Page and Hawley 2003). On the basis of electron microscopy (EM) surveys, synapsis typically starts from the ends of chromosomes and works its way inward, although interstitial sites of synapsis initiation are also found, especially in organisms that have long chromosomes such as maize (Burnham et al. 1972; Zickler and Kleckner 1999). As homologous chromosomes synapse, their axes coil around each other. This feature has been called “relational coiling/twisting” of homologs (Moens 1972, 1974; Zickler and Kleckner 1999). The cause or possible function of this coiling is not known.
As first described by Gelei, during zygotene chromosomes can become entangled within other synapsing pairs, forming interlocks (Gelei 1921). Either a bivalent (type I interlock) or one unsynapsed chromosome (type II interlock) can become trapped between unsynapsed AEs and caught by the formation of the SC on both sides of the loop. In one example described in maize, multiple chromosomes are trapped, forming a “complex interlock” (Gillies 1981). Since interlocks can be deleterious if left unresolved, mechanisms should be present in meiotic nuclei to prevent or resolve their occurrence (von Wettstein et al. 1984). To date, no mechanism has yet been identified. Interlocks could be resolved by coordinated breakage and rejoining of chromosomes (Holm et al. 1982; Rasmussen 1986; Moens 1990) or by chromosome movement and SC disassembly during zygotene and pachytene (Conrad et al. 2008; Koszul et al. 2008). For chromosomes to escape an interlock by this latter mechanism, one or more telomeres of the interlocking chromosomes either have to separate from each other on the nuclear envelope or be released from the nuclear envelope so that one interlocking chromosome can be pulled away from the other (Rasmussen and Holm 1980).
Meiotic chromosomes are large, complex structures that can be tens of microns in length, yet the size of many structural elements of interest such as recombination nodules (50–200 nm diameter) and the LEs of the SC (spaced 100–200 nm apart) is just beyond the resolution of conventional wide-field microscopy (von Wettstein et al. 1984). In favorable light microscope preparations, DNA is organized into chromomeres of condensed chromatin; however, their organization with respect to AEs cannot be easily resolved by conventional light microscopy. Although analysis of spatial organization of AEs at a high resolution can be accomplished by three-dimensional (3D) EM reconstructions of entire nuclei (e.g., Gillies 1973; Zickler and Olson 1975; Goldstein and Moens 1976), 3D EM analysis of even one cell is arduous. It has been difficult to describe the spatial behavior of AEs during synapsis, which constrains our understanding of the kinetics of this dynamic process. Three-dimensional structured illumination microscopy (3D-SIM), a new method of superresolution light microscopy, can achieve a resolution of better than 100 nm in the lateral (xy) plane and 250 nm along the z-axis (Gustafsson 2008; Gustafsson et al. 2008; Schermelleh et al. 2008). The advantages of 3D-SIM over EM are the ability to use FISH and immunolocalizations with fluorescently labeled proteins to specifically and simultaneously detect DNA, RNA, and proteins on chromosomes and the ability to obtain three-dimensional information from thick specimens.
Maize, a diploid (2n = 20) monocot grass of the Poaceae, is one of the few organisms with a large genome in which chromatin structure, homologous pairing, and synapsis are amenable to analysis by a combination of cytological, genetic, molecular, and biochemical techniques (Cande et al. 2009). Here, we use 3D-SIM to study chromomere and AE/LE organization of maize pachytene chromosomes. In maize, the cohesin REC8 alpha-kleisin homolog, encoded by absence of first division1 (afd1), is required for maintenance of AEs and proper leptotene chromosome structure (Golubovskaya et al. 2006). We used antibodies against AFD1/REC8 and ASYNAPTIC1 (ASY1), the Arabidopsis homolog of the yeast HOP1 gene (Armstrong et al. 2002), to delineate the prophase chromosome axis and show it changes during synapsis. This is the first exploration of chromosome behavior and synapsis at such a high resolution by light microscopy in any organism, and our findings allow us to quantitatively analyze key features of SC axial element behavior during zygotene and pachytene.
MATERIALS AND METHODS
Plant material:
Maize (Zea mays) inbred line B73 was grown in the greenhouse, and immature tassels were harvested before emergence. Anthers were staged using squashes according to criteria described here and in previous studies (Dawe et al. 1994; Bass et al. 1997).
Fixation and preparation of meiocyte slides:
Anthers with the appropriate developmental stage from the same floret and adjacent florets were fixed at room temperature in 4% formaldehyde in buffer A [15 mm PIPES–NaOH (pH 6.8), 80 mm KCl, 20 mm NaCl, 2 mm EDTA, 0.5 mm EGTA, 0.2 mm spermine, 0.5 mm spermidine, 1 mm DTT, 0.32 m sorbitol] for 45 min as described in Golubovskaya et al. (2002). In practice, good reconstructions by 3D-SIM can be obtained from thick specimens to a depth of up to 12 μm from the coverslip surface, so maize meiocytes were embedded in a thin acrylamide pad (∼15 μm in thickness), preserving the 3D spatial structures of chromosomes and SC. Slide preparation was performed as described in Golubovskaya et al. (2002) with modifications: fixed anthers were cut open at their tips to release meiocytes into a drop of buffer A. A total of 5 μl of meiocyte suspension was then transferred onto a no. 1.5 glass coverslip, followed by immediate addition of 2.5 μl activated acrylamide solution. The activated acrylamide solution was made by the addition of 5 μl of 20% ammonium persulfate and 5 μl of 20% sodium sulfide to 100 μl of a 15% (29:1 acrylamide:bisacrylamide) gel stock in 1× buffer A. The mixture of meiocyte suspension and activated acrylamide solution was stirred for 5 sec, and then another no. 1.5 glass coverslip was placed on top to make a coverslip sandwich with an acrylamide filling. A gentle pressure was applied on the coverslip. The sandwich was allowed to polymerize for 45 min and then the two coverslips were separated with a razor blade, leaving a thin pad of acrylamide with embedded meiocytes attached to one of the coverslips.
Indirect immunofluorescence:
Indirect immunofluorescence of AFD1 and ASY1/HOP1 proteins was performed as described in Golubovskaya et al. (2006) and is briefly outlined here. Newly polymerized acrylamide pads attached to a coverslip were washed with 1× PBS and cells were permeabilized for 1 hr in 1× PBS, 1% Triton X-100, and 1 mm EDTA and then blocked for 2 hr in 1× PBS, 3% BSA, 1 mm EDTA, and 0.1% Tween 20. Pads were incubated overnight in a humid chamber with a rat anti-AFD1 antibody (1:50) (Golubovskaya et al. 2006) and a rabbit anti-AtASY1 antibody (1:200), kindly provided by C. Franklin (University of Birmingham, Birmingham, UK) (Armstrong et al. 2002). After washes, pads were incubated with Cy3-conjugated F(ab′)2 donkey anti-rat IgG (1:50) and Alexa 488-conjugated F(ab′)2 donkey anti-rabbit IgG (1:100) secondary antibodies for 2 hr. Chromosomes were stained with 10 μg/ml DAPI.
Deconvolution light microscopy:
Images were acquired and analyzed using a DeltaVision (Applied Precision) system. 3D stacks were subjected to iterative deconvolution, using the SoftWoRx software (Applied Precision).
3D-structured illumination microscopy:
Slides were imaged with the OMX microscope, a custom-built microscope using a 100× 1.4 NA PlanApo oil-immersion objective (Olympus) and immersion oil of refractive index 1.512, empirically determined to give the least spherically aberrated point spread function. For 3D-SIM, incident laser light was directed to a diffraction grating mounted on a piezoelectric stage providing lateral translation and a rotational stage providing rotation around the optical axis. The innermost three orders (−1, 0, and 1) of diffracted light from the grating interfere in the image plane to produce a three-dimensional pattern of light. Three entire z-stacks are taken with the grating in three different rotational positions, at 15°, 75°, and 135° from the x-axis. During each z-stack, each z-section is acquired five times in a row, each time with the grating translated into five different positions perpendicular to its own stripe orientation. The z-section spacing was 125 nm in all cases. The five independent phases suffice to reconstruct the five components of linear three-dimensional structural illumination that sum together in Fourier space to constitute the raw images. To reconstruct the high-resolution images, these components are computationally separated, moved away from the origin to higher-frequency regions of Fourier space, and inverse transformed back to real space.
To visualize the 3D architecture of chromomeres, a volume-rendering projection method was used, in which parts of the 3D object farther from the viewer are occluded by brighter parts closer to the viewer. This method shows the surface details more clearly at the expense of showing the entire object.
Measurement:
To measure the space between AFD1 signals on the SC, cross sections of SC with AFD1 signals as shown in Figure S2 were sampled and the center–center distances between the AFD1 foci were manually measured and averaged from 50 cross sections of SC. To calculate the total chromosome lengths of late zygotene nuclei, the length of synapsed regions and length of unsynapsed regions in a nucleus were manually measured and the total chromosome length was calculated as the sum of the lengths of synapsed regions and half the combined lengths of unsynapsed regions.
Transmission electron microscopy:
TEM analysis of SCs on spread chromosome preparations was performed as described in Golubovskaya et al. (2002).
RESULTS
In each maize anther, all meiocytes are at exactly the same stage of meiosis, and the relative position of anthers in the same tassel reflects the relative development of meiocytes in meiosis. Examination of cohorts of cells from the same anther in comparison to cells from adjacent anthers allowed us to develop the criteria used here for prophase stage identification and to analyze stage-specific processes. Previously, these criteria, including chromosome and heterochromatic knob morphology, nuclear architecture, chromosome width, and cell appearance, were used to analyze the progress of prophase in mutants defective in pairing and synapsis (Pawlowski et al. 2003, 2004; Golubovskaya et al. 2006). The large heterochromatic knobs have a different morphology during zygotene and pachytene. As shown in supporting information, Figure S1, knobs in zygotene nuclei are relatively elongated. During the transition between zygotene and pachytene, the paired knobs become more oval. As pachytene progresses, the chromosome axes further shorten and knobs become spherical. Anthers at the transition between late zygotene and early pachytene based on these morphological criteria contained both meiocytes that had not yet completed synapsis and those that had. In analyzing the extent of synapsis in this population of cells we refer to them as the “late zygotene/early pachytene” population of cells that are either in late zygotene or in early pachytene depending on whether or not they contain unsynapsed regions.
Lateral element organization in pachytene chromosomes visualized with 3D-SIM:
AFD1 is a component of the AE/LE and is located on axes of both unsynapsed and synapsed regions of chromosomes (Golubovskaya et al. 2006). Because of the resolution limitation of conventional light microscopy, immunodetection of AFD1 on synapsed chromosomes gives the appearance of a single axis, rather than two separate LEs (Figure 1C and Figure S2) (Klein et al. 1999; Cai et al. 2003; Golubovskaya et al. 2006). However, with the 100-nm resolution of 3D-SIM, the two LEs of the SC are clearly resolved in pachytene nuclei (Figure 1 and File S1). The apparent center–center distance between the AFD1 signals in our reconstructions is 190-200 nm (n = 50, see materials and methods and Figure S2 D). Using TEM, the center–center distance between two silver-stained LEs is 137 nm (Figure 1D). A previous EM study of maize SCs showed that the center–center distance between LEs is 140 nm and the total width (outer edge to outer edge) of the SC is 190 nm (Gillies 1973). In the late zygotene/early pachytene population of cells, 3D-SIM images of AFD1 in the synapsed regions appeared as numerous foci on LEs, forming discontinuous short stretches and spots with varying intensities (Figure 1B). Furthermore, in the 3D-rotation movie of a projection of the same nucleus (File S1 and File S2), the LEs were clearly visible in the x-, y-, and z-axes along the SC and the resolution was sufficient to display the coiling and spatial organization of the SC. The discontinuous AFD1 signals form island-gap patterns on each LE that can be easily followed along the axis when the SC is less coiled (Figure 1B and File S2). As shown in Figure 1E, after computationally straightening an SC, we found that the AFD1 staining on each LE of the SC was similar and the island-gap patterns showed a bilateral symmetry. In late pachytene nuclei, AFD1 staining becomes more contiguous as chromosome axes shorten (Figure 1F), yet AFD1 signals along the LEs still exhibited varying intensities.
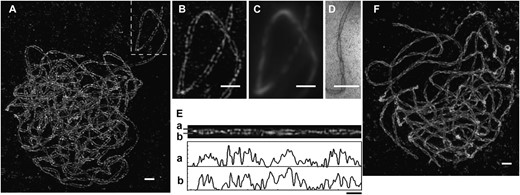
Lateral element organization in pachytene nucleus by 3D-SIM. (A) Visualization of AFD1 on lateral elements in a late zygotene/early pachytene nucleus as revealed by 3D-SIM. A 3D-rotation movie of a projection of the same nucleus is shown in File S1. Inset in A is shown in B and is straightened in E for analysis. A 3D-rotation movie of B showing magnified AFD1 localization is shown in File S2. AFD1 staining appeared as numerous foci on lateral elements, forming discontinuous short stretches and spots with varying intensities. (B–D) Comparison of lateral elements by three different methodologies in B by 3D-SIM, in C by conventional wide-field microscopy, and in D by TEM of spreading synaptonemal complex visualized by silver staining. The comparison demonstrates the resolution power of 3D-SIM (also see Figure S2). (E) Straightened synaptonemal complex and the line profiles of each lateral element show a bilateral symmetric pattern. (F) Visualization of AFD1 on lateral elements at late pachytene as visualized by 3D-SIM. AFD1 staining became more contiguous, yet AFD1 signals along the LEs still exhibited varying intensities. Bars, 1 μm.
Maize pachytene chromatin is organized in a left-handed helix:
Meiotic prophase chromosomes undergo dramatic changes in architecture as they undergo pairing, synapsis, and homologous recombination. Figure 2A shows a DAPI-stained nucleus from a late zygotene/early pachytene population of cells visualized by 3D-SIM and displayed using a volume-rendering projection method that gives a better view of the surface of objects in projection, especially as compared to the conventional fluorescence image (Figure S3 and File S3). The chromosome arms have a very regular chromomere organization, composed of masses of condensed chromatin arranged at regular intervals along the chromosome axis (Figure 2, B and C). The rotation movie demonstrates that chromomeres of each homolog are organized in similar patterns that coil around each other in a left-handed helix (Figure 2C and File S4). In contrast, chromosome morphology in the pericentric regions is distinct from that in the more distal arm regions: the DNA is highly packed and the coiling of chromomeres is not as obvious as it is on more distal parts of the chromosome arms (compare Figure 2B and 2D). Centromeres contain weakly staining, small chromatin strands that form a plane, and there are clear boundaries with the brighter pericentric regions flanking the centromere (Figure 2D and File S5). The paired heterochromatic knobs are solid ellipsoids with an irregular surface (Figure 2E and File S6) and there is an abrupt transition from the regular chromomere pattern to the knob.
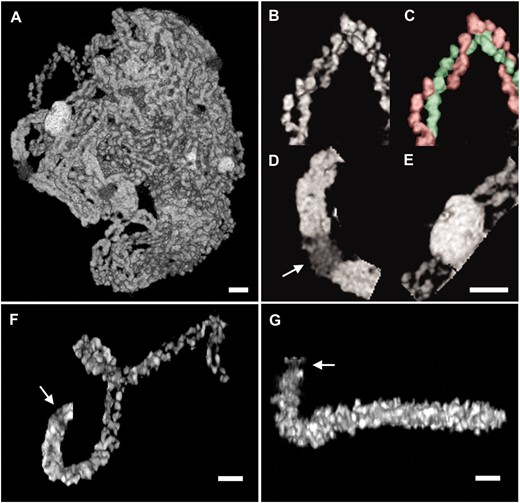
3D-SIM visualization of pachytene chromatin organization detected by DAPI staining. (A) A late zygotene/early pachytene nucleus shown in rendered volume projection, in which parts of the object in higher z-planes occlude parts in lower planes. A 3D rotation of this nucleus is shown in File S3. The same nucleus visualized by conventional wide-field microscopy and by the 3D-SIM with maximum intensity method is shown in Figure S3. (B–E) Subsets from the nucleus shown in A. B and C show an isolated chromosome arm (upper left in A), with both homologs clearly visible and false colored in C. File S4 shows the twisting of the homologs around each other. (D) A centromere region (arrow) showing the differential staining of the dark, fibrous central region and bright pericentric heterochromatin. A 3D-rotation movie is shown in File S5. (E) A heterochromatic knob region, visible as a solid ellipsoid elongated along the axis of the chromosome, with a sharp transition in chromatin organization separating the knob from the rest of the chromosome arm. See File S6. (F and G) The long arms of chromosome 10 in two different nuclei, at early and late pachytene, respectively. File S7 and File S8 show the 3D volumes, and projection views of whole chromosome 10s are shown in Figure S4. Arrows point to the centromere regions of both chromosomes. The difference in chromosome structure between early and late pachytene is seen as closer spacing of chromomeres, which retain a globular appearance. Due to the higher condensation at late pachytene, it is no longer possible to distinguish the homologs from each other or to detect twisting of the homologs. Bars, 1 μm.
An example of the long arm of chromosome 10 from early and late pachytene nuclei is shown in Figure 2, F and G, respectively, and whole chromosome 10s are displayed in Figure S4. The width of the late pachytene chromosome shown here has increased, compared to zygotene, by 70% (1224 nm vs. 711 nm) and the chromosome has shortened 31% (from 44.11 μm to 30.21 μm) (n = 3). The 3D-rotation movies (File S7 and File S8) show that the clearly distinct and regularly arranged chromomeres of early pachytene chromosomes cannot be distinguished in the late pachytene chromosome arms, because chromomeres are tightly packed.
Axes of synapsed chromosomes are coiled:
The organization of the chromomeres and that of underlying twisting LEs in the zygotene/pachytene population of cells were observed simultaneously, using DAPI to stain DNA and anti-AFD1 immunostaining to detect LEs in the same nucleus (Figure 3). The organization of AFD1 along the LEs does not differ noticeably at the centromeres (Figure 3B), the heterochromatic knobs (Figure 3C), the nucleolus organizer (Figure 3D), and the telomeres or interstitial regions (Figure 3I). Moreover, the coiling of the SC is not disrupted in any of these domains, implying the twisting of the SC is irrelevant for establishing chromatin organization. In cross sections of chromosome arms containing chromomeres (Figure 3E) and a heterochromatic knob (Figure 3G), there is a space around the AFD1-staining axes from which the DAPI-stained DNA is excluded. However, this space is not evident at the centromere (Figure 3F) or the nucleolus organizer region (Figure 3H), either because chromatin staining in these regions is too weak or because chromatin and LEs may have a different organization in these regions.
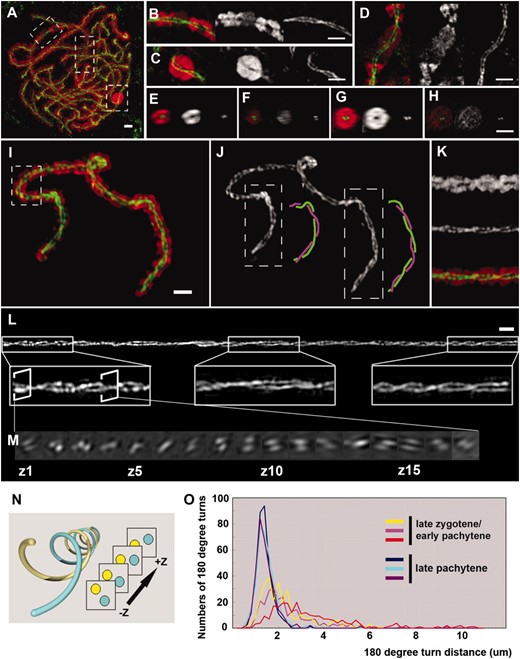
Coiling of chromatin and lateral elements at “late zygotene/early pachytene” and late pachytene. (A) A partial 3D projection of a late pachytene nucleus stained with DAPI (red) and immunostained for AFD1 (green). The lateral elements can be clearly distinguished and can be seen to twist around each other. Three insets are shown from B–H. (B) A centromere region in the upper left inset of A, showing a clearly delineated SC between the homologs in the centromere. (C) A knob region in the right inset of A, showing a curving passage for the SC. (D) The nucleolus organizer region (NOR) in the middle inset of A, showing a weakly staining, fibrous appearance similar to centromeres. In no case does the appearance or twisting of the LEs change as they pass through any of these specialized chromosome regions. (E–H) Cross sections (xz plane) of chromosomes in the pericentric region (E), the centromere (F), the heterochromatic knob (G), and the NOR (H). In the pericentric region (E), the two homologs stained by DAPI can be distinguished. In contrast, the homologs in the centromere (F), the knob (G), and the NOR (H) cannot be distinguished from each other. A wider channel for the SC, excluding DAPI-stained chromatin, is seen in the pericentric region (E) and the knob (G), but is not present in the centromere (F) and the NOR (H). (I–K) A late zygotene/early pachytene chromosome computationally isolated and shown in projection with AFD1 (green) and DAPI (red) staining. The twisting of the LEs, shown in J, follows the same handedness throughout. Two lateral elements of both telomere ends are diagramed in different colors next to the insets in J. 3D rotation is shown in File S9. (K) The dotted-line inset of I, computationally straightened. Chromatin stained by DAPI (top) twists in phase with the LEs (middle; bottom image is the merged data set). (L–N) A computationally straightened chromosome, demonstrating left-handed coiling along the whole chromosome and the variability of helical pitch as a function of position. (L) Synaptonemal complexes near two telomere regions and one interstitial region are magnified and shown in insets. The coils near telomere regions are tighter than those near interstitial regions. (M) Successive cross sections of the region spaced ∼200 nm apart between the planes shown in the inset, top left, demonstrate the overall left-handed coiling of the LEs. A 180° turn is defined as coiling from z1 to z8 shown in M. Movies with cross sections from the left and right telomeres through whole chromosomes are shown in File S10 and File S11, respectively. Left-handed coiling, as opposed to right-handed, is demonstrated by the diagram in N: cross sections revolve counterclockwise as the path is followed away from the viewer. (O) Histograms of helical pitch demonstrate the tightening of coils as pachytene progresses. The twisting pitch in late pachytene, shown by the path length between LE crossings in the xy plane, shows a sharp peak, while late zygotene/early pachytene shows a more variable distribution, with longer distances between crossings. This implies that coiling of SC is a dynamic process and coils of SC get tighter over time and converge in size to an average of 1.34 μm in length by late pachytene. Bars, 1 μm.
When homologous chromosomes are fully synapsed, the two LEs are twisted around each other from telomere to telomere in a left-handed double helix (Figure 3J and File S9). The chromomeres of each homolog also twist along the LEs with the same handedness (Figure 3K). The axes coil in a left-handed sense along their entire length (Figure 3, L–N, File S10, and File S11). The left-handedness was the same for all 60 chromosomes in the six pachytene nuclei examined. In the “late-zygotene” nuclei from a late zygotene/early pachytene population of cells, the average number of 180° turns per cell is 257, whereas in late pachytene it increases to 330 per nucleus, indicating that coiling of the SC continues both during and after synapsis (see materials and methods and Table S1). As chromosomes condense during pachytene, the total length of chromosome axes in a nucleus decreases on average from 729.6 μm in late zygotene/early pachytene to 442.3 μm in late pachytene. As a result of increasing the number of coils as axes shorten, the average length of each 180° turn decreases as meiotic prophase progresses, from 2.66 ± 1.48 μm in late zygotene/early pachytene to 1.34 ± 0.43 μm in late pachytene, by a factor of two. The length of a 180° turn in late zygotene/early pachytene nuclei varies, from a minimum of 0.58 μm to a maximum of 10.51 μm, whereas in late pachytene cells, the length of each turn is strikingly uniform (Figure 3O). When examining the coil distribution in individual chromosomes of late zygotene/early pachytene nuclei, the coils are much tighter near telomeres than interstitial regions of the same chromosome (Figure 3L).
Interlock resolution is a key step in synapsis:
To correlate the extent of synapsis with progression from zygotene through late pachytene as defined by knob and chromosome morphology, we monitored the progression of synapsis using conventional fluorescence deconvolution microscopy, using AFD1 and ASY1 double immunostaining to discriminate between paired and unpaired regions. In zygotene, AFD1 and ASY1 are both associated with the unsynapsed AEs. However, ASY1 can no longer be detected in synapsed regions because its epitope is masked by SC formation while AFD1 staining can be detected until the end of pachytene (Golubovskaya et al. 2006).
First, we identified the meiotic stage of cells in the anther and then determined the extent of synapsis in individual nuclei using conventional light microscopy. As shown in Figure 4A, all 74 midzygotene nuclei examined in this fashion contained extensive unsynapsed chromosome domains. At the late zygotene/early pachytene transition as synapsis nears completion, 21% of the nuclei (17 of 81 nuclei) contained small unsynapsed regions. The sum of those small unsynapsed regions represents <10% of the total chromosome length in a nucleus (see examples in Figure S1). Finally, only one of 58 late pachytene nuclei contained an unsynapsed chromosome domain; this was in the nucleolus organizer region and not associated with interlocks. Thus, synapsis is complete by late pachytene.
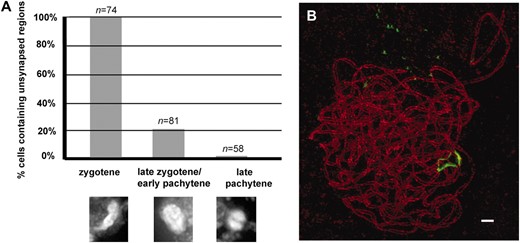
Synapsis progression during zygotene and pachytene. (A) Using chromosome morphology changes as criteria, zygotene, “late zygotene/early pachytene,” and late pachytene nuclei can be distinguished. As shown in the bottom, knobs in zygotene nuclei are elongated, and at late zygotene/early pachytene transition, the paired knobs become more oval. In late pachytene, knobs become more spherical. More examples are shown in Figure S1. After the meiotic stages are determined, the extent of synapsis was monitored by AFD1 and ASY1 antibody staining pattern. All zygotene nuclei contain unsynapsed regions. A total of 21% of the nuclei in the population of cells at the late zygotene/early pachytene transition still contain unsynapsed regions, and many of the unsynapsed regions at this stage are associated with interlocks (see text). At late pachytene, only one of 58 nuclei still contains an unsynapsed region; however, this particular region is not associated with an interlock. This indicates that remaining unsynapsed regions synapse by late pachytene as interlocks are resolved. (B) A late zygotene/early pachytene nucleus with one unsynapsed region associated with an interlock stained with AFD1 (red) and ASY1 (green) and revealed by 3D-SIM. Bar, 1 μm.
Using 3D-SIM, we examined 14 late zygotene/early pachytene nuclei, and 5 nuclei had multiple unsynapsed regions as detected by ASY1 immunostaining (Table 1, Figures 4B and 5). Surprisingly, all 5 nuclei with unsynapsed regions had at least one interlock, and 11 of the 14 unsynapsed regions were associated with interlocks (78%). The total length of all the nonsynapsed regions is <10% of the total AE length in any one nucleus. Since these interlocks are associated with the last regions that synapse, interlock resolution is likely to be a rate-limiting step for the completion of synapsis. In all late pachytene nuclei (n = 6) we examined by 3D-SIM, no unsynapsed axes remained and no interlocks were observed after we traced all chromosome axes in 3D reconstructions (Table 1). Since interlocks are detected in many late zygotene/early pachytene meiocytes, but are not detected in late pachytene, we conclude that all interlocks that may have occurred in a nucleus must be resolved by late pachytene. We can rule out the possibility that late zygotene/early pachytene cells with interlocks are arrested in the cell cycle, or are eliminated by apoptosis, as all meiocytes in a wild-type anther at late pachytene are tightly synchronized and have normal chromosome morphology. Moreover, anthers from mutants with aberrant homologous synapsis, e.g., poor homologous synapsis1 (phs1) or desynaptic2 (dsy2), do not contain any apoptotic meiocytes (they instead contain aborted pollen), indicating that failures of synapsis do not arrest or prematurely terminate meiosis (Franklin et al. 2003; Pawlowski et al. 2004).
Numbers of unsynapsed regions and interlocks examined in pachytene nuclei
Late zygotene/early pachytene | Late pachytene | |
|---|---|---|
| No. of cells examined | 14 | 6 |
| No. of cells with unsynapsed region | 5 | 0 |
| No. of cells with interlocks | 5 | 0 |
| No. of unsynapsed regions | 14 | |
| No. of unsynapsed regions associated with interlocks | 11 | |
| Total no. of interlocks | 6 | |
| No. of type I interlock | 2 | |
| No. of type II interlock | 2 | |
| No. of complex interlock | 2 |
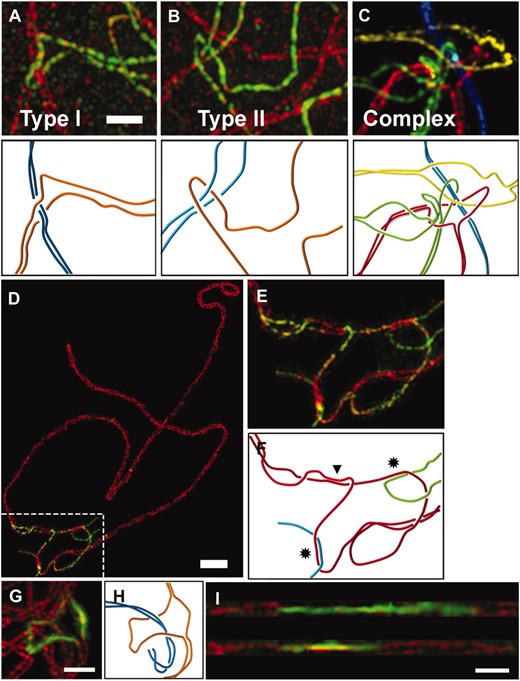
Interlocks and nonhomologous synapsis. (A–C) Three types of interlocks are detected by AFD1 and ASY1 immunostaining in “late zygotene/early pachytene” nuclei. ASY1 (green staining in A and B) can be detected only on nonsynapsed LEs, while AFD1 (red in A and B; red, green, and blue false color in C) is present on both synapsed and nonsynapsed regions of all LEs. Diagrams below the images show chromosome axes configuration as homolog axes are painted with different colors. (A) A type I interlock: a bivalent is caught inside another synapsing chromosome; see File S12 for another example. (B) A type II interlock: an unsynapsed chromosome is caught inside another synapsing chromosome; see File S13 for another example. (C) Complex interlocks contain more than two chromosomes. In the example shown, four chromosomes are involved and are painted with different colors. The blue and green chromosomes are trapped in the red chromosome as type I, and the blue chromosome is also trapped in the green chromosome as a type I interlock. In addition, the yellow chromosome is trapped in the red and the green chromosomes as a type II interlock. The 3D rotation of the same complex interlock is shown in File S14. (D–F) Nonhomologous synapsis is associated with interlocking chromosomes. The inset in D is shown magnified in E and diagrammed in F. The absence of ASY1 staining (green) indicates bona fide synapsis between nonhomologous chromosomes, as indicated by asterisks in F. Each nonhomologous stretch also creates a type II interlock. An arrowhead indicates the site of synapsis initiation between homologous chromosomes. (G–I) A nonsynapsed region associated with a type I interlock showing nonsynapsed axial elements that differ in length. This region was isolated from the nucleus shown in Figure 4B. (H) Diagram shows chromosome configuration as homologs are painted with different colors. (I) Computationally straightened 3D traces of both axes, demonstrating a twofold difference in length (5.3 μm vs. 2.5 μm). A 3D-rotation movie of the axes that are intertwined in this interlock is shown in File S15. Notably, the interlocking chromosome lies more toward the longer half of the bubble and the bubble is in the center of the chromosome. Bars, 1 μm.
Interlock classification using 3D-SIM:
Among our 3D-SIM images, interlocks can be divided into three classes: type I, where a bivalent is trapped in a synapsing bubble (Figure 5A and File S12); type II, where an unsynapsed chromosome is trapped in the unsynapsed region of another bivalent (Figure 5B and File S13); and complex interlocks, containing multiple bubbles with more than one bivalent or univalent (Figure 5C and File S14). At late zygotene/early pachytene, the type I and II interlocks and complex interlocks are almost equal in number (Table 1), and they are located in the interstitial regions of chromosomes, not near the telomeres. For example, the nucleus shown in Figure 4B contains a small unsynapsed region with a type I interlock in the middle of two intertwining chromosomes (also see File S15). As synapsis progresses mainly from the chromosome ends, the unsynapsed regions associated with interlocks are located near the middle of chromosomes and can be as small as a few microns in size (Figures 4B and 5D). Interestingly, type II and complex interlocks involving unsynapsed chromosomes are often associated with nonhomologous synapsis that flanks the interlocking chromosomal domains (Figure 5, D and F).
We measured the lengths of the two unsynapsed branches of a synapsing bubble, as defined by ASY1 staining, and found in most cases that the axes differ in length (Table S2). In an example shown in Figure 5, G–I, and File S15, one axis is about twice as long as the other. After synapsis is complete, the paired homologs are the same length, indicating that the axial element is a dynamic structure that undergoes changes in length during synapsis. We conclude there must be a contraction or expansion of one chromosome axis with respect to the other as the homologs are zipped together by SC formation.
DISCUSSION
By examining the structure of meiotic chromosomes at twice the resolution previously possible with optical microscopy, we have gained new insights into the fundamental processes of meiotic synapsis, while at the same time providing a robust test of the utility of the new technique of 3D-SIM. Most strikingly, the lateral elements of the SC could be fully resolved with 3D-SIM, allowing us to analyze its structure in a way not previously possible. The correspondence between our 3D-SIM images and previously well-characterized EM images validates the 3D-SIM process and its applicability to biological specimens.
In maize and many other organisms, axial element behavior has mostly been described by TEM using preparations of spread chromosomes and silver staining to visualize the axes. While the prophase I stages can be classified in these preparations solely on the basis of the extent of synapsis, it is not possible to determine the exact substage or relate concomitant changes in chromosomes and nuclear architecture as chromatin architecture is not preserved and the 3D arrangement of chromosomes in the nucleus is lost. In addition, the SC proteins that are silver stained are unknown, and no axial substructure can be detected. Here we use 3D-SIM to demonstrate that the distribution of AFD1 is discontinuous along the LE, that the coiling of the axes occurs after SC formation and all SCs are coiled as a left-handed double helix, and that the coils tighten and become more uniform with progression through meiotic prophase. Finally, we show that interlocks are a common occurrence at late zygotene, that they may be a rate-limiting step to complete synapsis, and that they are completely resolved before late pachytene.
AFD1 distribution on the chromosome axes:
We have used AFD1, a meiotic alpha-kleisin, as a marker to define AE behavior. The discontinuous nature of AFD1 staining, possibly indicating the discrete localization of cohesin complexes, is in many cases mirrored on both LEs (Figure 1E). This indicates that a specific localization of this part of the SC is determined by sequence/epigenetic information and/or by the kinetics of assembly of the LEs. The overall appearance of the AFD1 staining, however, does not vary appreciably in regions of chromosomes displaying drastically different DNA organization (i.e., heterochromatic knobs, centromeres, or the nucleolus organizer region). AFD1 is required for chromomere organization along the chromosome axis and the compaction of chromomeres leading to the contraction of the chromosomes as pachytene progresses. In a maize afd1-1 null allele, pachytene chromosomes contain short fragments of abnormal AEs representing <1% of the length of a wild-type AE. Early meiotic prophase nuclei in this mutant have diffuse, disorganized chromatin lacking chromomeres, which does not condense into discrete chromosomes until diplotene/diakinesis (Golubovskaya et al. 2006). It is possible that contraction of the LEs during pachytene may regulate some of the structural changes we observe in chromomere organization. However, the coiling of the axes cannot be responsible for the contraction of chromosomes during pachytene, since the observed decrease in length (31%) is too large to be accounted for by the predicted contraction of a helix of constant diameter (194 nm) from a completely uncoiled state to a pitch of 1.5 μm. Given the relation of distance (z) to arc length (s) of a helix, z = s(c/(r2 + c2)0.5), where r is the helix radius and 2πc is the pitch (distance between gyres), the predicted contraction from coiling alone would be 7.4%. This disparity between coiling and contraction may reflect the fact that the axis length, density (number of molecules per unit length), or both can fluctuate, i.e., that LEs are dynamic and can grow or shrink, by the addition and removal of component parts.
Another indication of the dynamic nature of the LEs comes from the behavior of nonsynapsed regions bordered on both sides by synapsed regions. Usually, one strand of the nonsynapsed region is longer than the other, implying that during synapsis the length of one or both axial element segments is adjusted. Though we observed this presynapsis adjustment in wild-type nuclei, it may utilize mechanisms similar to those involved in synaptic adjustment of inversion loop and deletion heterozygotes and other noncanonical pairing configurations, as first observed in mice (Moses 1977; Moses et al. 1982). However, synaptic adjustment has not been seen in maize and many other plants (Gillies 1981; Anderson et al. 1988).
Axial element behavior at high resolution:
A major advantage gained by distinguishing both LEs is the ability to detect the twisting of LEs around each other. Since the twists in all chromosomes of all maize nuclei are left-handed, the structure of the polymerized SC itself may be helical and impart a specific handedness to the chromosome at a large scale. We do not recognize any abrupt change in the coiling process and the developmental age dependence of the tightness of the coils suggests that coiling is a continuous process initiated as homologous chromosome axes are synapsed together during synaptonemal complex formation. If the SC has a preferred pitch that it would assume if no other forces were present, time would be required for the chromosomes to accommodate themselves to the twisting tendency of the SC and reach an equilibrium state. Since SC formation generally starts at the ends of chromosomes, the implication is that the chromosome regions that have been synapsed for the longest time are closest to this equilibrium state. The twisting of DNA loops or chromomeres of homologous chromosomes around each other in the same left-handed sense, seen in Figure 3, indicates that twisting of the SC is imparted to the chromosome as a whole.
One model has been proposed to explain SC-associated recombination and its relation with a twisted SC (Borner et al. 2004). In this model, chromatin loop expansion could result in the development of compression stress along the chromosome axes. Eventually, such forces would tend to cause the SC to twist along its length during synapsis, bringing the axes of the two chromatids involved in recombination into close proximity. However, the bias in handedness may still result from the structural nature of the LEs or SC-associated proteins (Stack and Soulliere 1984; Costa et al. 2005). Previous EM studies have shown that in rat spermatocytes, all coils are left-handed as observed here, while in Rheo discolor, a dicot, all coils are right-handed (Moens 1972, 1978), consistent with the idea that coiling and its handedness is an intrinsic property of the meiotic chromosome after synapsis. In some organisms such as budding yeast (Moens 1969; Byers and Goetsch 1975; Zickler 1977; Moses 1979; Holm and Rasmussen 1983) handedness appears to be random, raising the possibility that SC structure and/or the synapsed homologs may assume multiple states in these cells.
Interlock resolution:
Nonsynapsed regions of chromosomes at the transition from late zygotene to early pachytene are almost always associated with interlocks. Interlocks could potentially disrupt many meiotic processes, by triggering a synapsis checkpoint or by disrupting metaphase chromosome alignment and segregation at meiosis I. For example, complex interlocks if left unresolved could interfere with the separation of homologous chromosomes at anaphase I. From our observations and other cytological studies (reviewed in Zickler and Kleckner 1999), interlock frequency decreases from late zygotene/early pachytene to late pachytene, suggesting that interlock detection and removal should be integral parts of meiotic prophase. The two postulated methods of interlock resolution, coordinated cutting of both sister chromatids or a controlled desynapsis to allow the passage of a chromosome out of the interlock, are drastic measures that would likely be under complex regulation.
Since no interlocks are found in late pachytene nuclei, and there is no evidence for apoptosis in the anther, even the topologically complicated complex interlocks appear to be completely resolved in wild-type meiocytes. If a type II topoisomerase is involved, its activity would have to be significantly regulated to coordinate breakage of two sister chromatid strands in a biased fashion (Zickler and Kleckner 1999). Consistent with this model of interlock resolution, topoisomerase II has been shown to localize to the AEs of mouse meiotic prophase chromosomes (Moens and Earnshaw 1989). As an alternative model, or additional step, the trapped, unpaired chromosome or bivalent may move back and forth with concomitant reversible SC polymerization and depolymerization, finally being pushed out through one set of paired telomeres (Kleckner and Weiner 1993). For interlocks to be resolved by this latter mechanism, interlocked chromosomes would show a biased movement within the nucleus. For type I interlocks, a trapped chromosome could escape from the interlock if telomeres transiently separated on the nuclear envelope or were released from the nuclear envelope. For complex interlocks to be resolved by this mechanism in the absence of breakage and resealing of chromosome axes, multiple coordinated chromosome movements would have to occur and multiple SCs would have to disassemble. These chromosome movements could be generated during the bouquet stage as telomeres cluster on the nuclear envelope and/or during early pachytene as the bouquet disperses. In our analyses, however, no interlocks are found at chromosome ends (an example is in File S15), a finding that is inconsistent with a model based only on movement unless coordinated movements associated with SC depolymerization are very rapid events. Recently, chromosome movement consistent with that required for interlock resolution has been detected in budding yeast cells during meiotic prophase (Scherthan et al. 2007; Conrad et al. 2008; Koszul et al. 2008). Chromosome movement must also be important for interlock resolution in maize since more interlocks are observed by TEM in the maize pam1 mutant; in this mutant defective telomere movement on the nuclear envelope leads to delayed or abnormal bouquet formation (Golubovskaya et al. 2002). The contribution of telomere-driven chromosome movement may either be direct, if coupled to desynapsis to remove the interlocked chromosome from the desynaptic bubble, or indirect, if tension generated by movement is a necessary step for chromosome axis breakage. Given the complexity of the interlocks we observe in maize, we suggest that both chromosome movements and chromosome axis breakage and reformation will be required for interlock resolution.
Since one-third of the detected interlocks are in the complex class, these may represent a class of interlocks that are particularly difficult to resolve. In support of this idea, complex interlocks coincide with nonhomologous synapsis, another abnormality whose resolution may preempt the normal interlock-clearing mechanisms. Alternatively, the low number of observed interlocks may be due to a highly regulated nonsynchronous synapsis. If several chromosomes complete synapsis before others, the number of type II and complex interlocks would be minimized, as these can form only when two or more pairs of chromosomes synapse simultaneously.
Since interlocks have been observed in many organisms, the exceedingly low rate of meiosis failure in wild-type meiocytes implicates the existence of specific mechanisms to deal with them. 3D-SIM's ability to detect chromosome interlocks in wild-type nuclei suggests a new avenue of cytological study that can shed light on their mechanism of resolution.
Footnotes
Supporting information is available online at http://www.genetics.org/cgi/content/full/genetics.109.108688/DC1.
These authors contributed equally to this work.
Footnotes
Communicating editor: G. P. Copenhaver
Acknowledgements
The authors declare that no competing interests exist.
We thank Chris Franklin for a generous gift of the ASY1 antibody. We thank John Sedat for access to the OMX microscope and David Agard for his support of the software used for data analysis. We thank members of the Cande lab and Jay Hollick, Gary Karpen, Dave Mets, Dave Wynne, and Jacqueline Chretien for their comments on the manuscript. This study was supported by a grant from the National Institute of Health (GM048547) to W.Z.C.
References
Byers, B., and L. Goetsch,
Cande, W. Z., I. Golubovskaya, C. J. R. Wang and L. Harper,
Gelei, J.
Gillies, C. B.,
Gillies, C. B.,
Holm, P. B., and S. W. Rasmussen,
Kleckner, N., and B. M. Weiner,
Moens, P. B.,
Moens, P. B.,
Moses, M. J.,
Moses, M. J.,
Rasmussen, S. W.,
Scherthan, H., H. Wang, C. Adelfalk, E. J. White, C. Cowan et al.,
Stack, S. M., and D. L. Soulliere,
Zickler, D., and L. W. Olson,
