


Abstract
Populations with low linkage disequilibrium (LD) offer unique opportunities to study functional variants influencing quantitative traits. We exploited the low LD in forest trees to identify functional polymorphisms in a Eucalyptus nitens COBRA-like gene (EniCOBL4A), whose Arabidopsis homolog has been implicated in cellulose deposition. Linkage analysis in a full-sib family revealed that EniCOBL4A is the most strongly associated marker in a quantitative trait locus (QTL) region for cellulose content. Analysis of LD by genotyping 11 common single-nucleotide polymorphisms (SNPs) and a simple sequence repeat (SSR) in an association population revealed that LD declines within the length of the gene. Using association studies we fine mapped the effect of the gene to SNP7, a synonymous SNP in exon 5, which occurs between two small haplotype blocks. We observed patterns of allelic expression imbalance (AEI) and differential binding of nuclear proteins to the SNP7 region that indicate that SNP7 is a cis-acting regulatory polymorphism affecting allelic expression. We also observed AEI in SNP7 heterozygotes in a full-sib family that is linked to heritable allele-specific methylation near SNP7. This study demonstrates the potential to reveal functional polymorphisms underlying quantitative traits in low LD populations.
IN plants, gene function is typically investigated by reverse genetic approaches such as knockout mutants and overexpression transgenics. Functional analysis of subtle allele effects under native conditions is difficult. The large extent of linkage disequilibrium (LD) is one of the obstacles to fine mapping of functional variants in many plant species. In this context forest trees offer unique opportunities for fine mapping of candidate genes and functional analysis of gene variants, as LD and population structure are generally low (Brown et al. 2004; Thumma et al. 2005; Neale 2007). In inbreeding species LD typically extends over much larger distances compared to outcrossing species (Nordborg 2000). In Arabidopsis, average LD extends to ∼10 kb (Kim et al. 2007), while in the outcrossing maize and forest tree species, rapid decline in LD (within ≤1 kb) was observed in a number of candidate genes (Thornsberry et al. 2001; Savolainen and Pyhajarvi 2007). Some of the factors that are likely to have contributed to the low LD in forest trees include large effective population size, their outcrossing habit, and long history of recombination.
The functional significance of nonsynonymous polymorphisms may be linked to protein phenotype while synonymous and noncoding single-nucleotide polymorphisms (SNPs) can affect phenotype by influencing alternative splicing, altering mRNA stability and/or allelic expression imbalance (AEI). Allelic expression imbalance or allele-specific expression analysis in heterozygous individuals is a powerful method for identifying cis-acting regulatory variants. Expression of a particular allele is controlled by both cis-acting factors such as DNA polymorphisms and methylation and trans-acting factors such as transcription factors. Differential expression of two alleles within an individual, where they are exposed to the same cellular environment, indicates the presence of cis-acting regulatory polymorphisms (Tao et al. 2006). While total gene expression is influenced by both cis- and trans-acting factors and environmental factors, allele-specific expression is primarily affected by cis-acting factors. Analysis of AEI is therefore more robust compared to that of total gene expression. Since regulatory polymorphisms present in promoters or within genes (i.e., enhancers) will show an effect on allele expression levels, these can be identified by measuring AEI (Pastinen and Hudson 2004).
Many of the AEI studies in humans have been successful in identifying cis-regulatory haplotypes underlying gene expression (Pastinen et al. 2005; Tao et al. 2006). However, identification of the functional polymorphisms controlling allelic expression is generally not possible because of the extent of LD in humans. Further analysis to identify functional variants is generally carried out using transient expression studies. Several AEI studies have been reported in maize (Guo et al. 2004; Stupar and Springer 2006; Springer and Stupar 2007). The proportion of cis-regulatory variation affecting AEI was higher than that of trans-regulatory variation and evidence of tissue-specific differences in AEI was detected (Springer and Stupar 2007). However, all these studies in maize were primarily aimed at understanding the genetic control or mode of inheritance of regulatory variation. In maize AEI has been used to identify upstream regions containing regulatory factors (Clark et al. 2006; Salvi et al. 2007); however, there are few studies in plants where AEI was used to identify regulatory polymorphisms affecting quantitative trait variation.
Identification of genes and gene variants controlling wood quality traits is an important objective in many forest tree breeding programs, as small fraction of a percentage point improvements in traits such as pulp yield can deliver large gains for a pulp mill. During studies of gene expression and wood properties in Eucalyptus nitens branches (Qiu et al. 2008) we identified two COBRA-like ESTs that share strongest DNA sequence similarity with AtCOBL4. These genes were differentially expressed in upper (tension wood) and lower (opposite wood) sides of branch xylem where large differences in cellulose content and cellulose microfibril orientation were observed. In Arabidopsis COBRA and COBRA-like genes have been implicated in cellulose synthesis and deposition in secondary cell walls (Schindelman et al. 2001). Reverse genetic studies in Arabidopsis have shown that insertions in COBL4 resulted in a large decrease in cellulose content (Brown et al. 2005). Mutations in genes homologous with COBL4 in rice (BC1) (Li et al. 2003) and maize (bk2) (Ching et al. 2006) caused reductions in cellulose content in secondary cell walls of stems.
In this study we exploited the low LD found in the COBL4 gene from E. nitens to fine map functional polymorphisms. We present a range of experimental evidence to show that SNP7 is a cis-acting regulatory polymorphism that affects cellulose content in E. nitens.
MATERIALS AND METHODS
Populations, phenotypes, and genotypes:
The association population comprised 420 9-year-old E. nitens growing at Meunna, northwestern Tasmania (41° 06′S, 145° 28′E). Each tree was derived from an unrelated open-pollinated family (consisting of half sibs) growing in the central highlands of Victoria, from where most of the Australian E. nitens breeding material is sourced. The three-generation full-sib family comprised 290 8-year-old trees grown at West Ridgley, northwestern Tasmania (41° 14′S, 145° 78′E). Two of the grandparents came from the central Victorian highlands and two came from New South Wales. Wood cores were collected from all trees at 1.3 m from ground level in 2002. Cellulose microfibril orientation and density were measured using Silviscan II (Evans and Ilic 2001). Cellulose and lignin content and kraft pulp yield were predicted from ground powder from whole cores or across intact cores by near-infrared (NIR) spectra, using appropriate calibration models in the methods of Schimleck et al. (2004). Details of the method describing cellulose estimation based on NIR spectroscopy are presented in the Supporting Information. Leaves collected from each tree were used for DNA isolation. The entire EniCOBL4A gene, including 1.0 kb of promoter region, was sequenced in 18–20 individuals to identify common SNPs (minor allele frequency > 0.10). Common SNPs were genotyped in 300 trees in the association population, using the multiplex ligation-dependent probe amplification (MLPA) assay (Schouten et al. 2002). Accuracy of the genotype calls for SNP7 was tested using primer extension in 300 trees. One SNP from the promoter, SNP1 from the 5′-UTR, SNP2 from exon 1, and SNP7 from exon 5 were genotyped using the GoldenGate (Illumina) (Fan et al. 2003) bead assay. SNP7 was genotyped in the entire population of 420 trees with the primer extension method and GoldenGate assay. SNP7 and SNP13 from the 3′-UTR were genotyped in the grandparents, in the parents, and across 290 individuals from the full-sib family, using the primer extension method.
Phylogenetic analysis:
The EgrCOBL4A and EgrCOBL4B genes were identified in a E. grandis xylem cDNA library (Qiu et al. 2008). We used the EST sequence from Egr-COBL4A to isolate the full-length gene in E. nitens and 5′-UTR and promoter regions of EniCOBL4A were obtained using Genome Walker (Clontech). Protein sequences were aligned using ClustalX (Thompson et al. 1994) and the alignments used as input into MEGA 3.1 (Kumar et al. 2004) to generate an unrooted phylogenetic tree. All analyses were performed using the default parameters. Statistical confidence of the nodes of the tree is based on 1000 bootstrap replicates.
Allelic expression imbalance:
AEI was measured in heterozygous trees, using the primer extension method (Gábor Mátyás et al. 2002; Yan et al. 2002). RT–PCR was performed on DNAse-treated total RNA extracted from xylem tissue (Southerton et al. 1998), using the forward primer 5′-GTCGGCTGTCTGGTACTTC-3′ and the reverse primer 5′-CCCGTGTCATTTATGGATTC-3′ to amplify a portion of the gene containing SNP7. The reverse primer spanned exon 5 and exon 6 to minimize amplification from genomic DNA. Allele-specific primer extension products were separated by capillary electrophoresis and peak height was used to measure the relative ratio of each allele. Allelic ratios of the cDNA samples were standardized with mean allelic ratios obtained using genomic DNA (Zhang et al. 2005). Four technical replicates were performed for each sample. In the association population AEI estimation with SNP7 was done using two biological replicates. Xylem samples for RNA were collected in the mornings over several days at each trial site.
Electrophoretic mobility shift assay:
Nuclear proteins were extracted from xylem tissue of four unrelated trees, using a plant nuclear extraction kit (Sigma). Two biotin-labeled 25-mer oligonucleotides spanning SNP7 were synthesized and annealed to their complementary oligonucleotides, using a thermocycler. Probe–protein binding reactions were performed at room temperature, using a LightShift chemiluminescent electrophoretic mobility shift assay (EMSA) kit (Pierce Biotechnology). We incubated 2 μl (∼3 μg) of crude protein and 1 pmol biotin-labeled probe together with 2 μl of binding buffer, 2 μl of poly(dI/dC), 1 μl of glycerol, and 1 μl of MgCl2 at room temperature for 20 min. The binding reaction was loaded onto a 6% polyacrylamide gel in 0.5× TBE and electrophoresed for 20–30 min. Probe–protein complexes were transferred to a nylon membrane and developed using a LightShift biotin detection kit (Pierce Biotechnology).
Methylation analysis:
The methylation status of CpG dinucleotides in AA and GG homozygous trees from the full-sib family was examined by preparing bisulfite-treated DNA, using a Methyl Code kit (Invitrogen). Primers were designed using MethPrimer software (Li and Dahiya 2002) to amplify 250 bp surrounding SNP7. PCR amplification products were cloned and ∼15 clones were sequenced to reveal methylation status. Methylation-sensitive single-nucleotide primer extension (MS-SNuPE) (Gonzalgo and Jones 2002) was used to genotype sites that were found to be methylated and to interrogate other CpG sites for their methylation status.
Statistical analyses:
We used “SAS genetics” to test Hardy–Weinberg Equilibrium (HWE) of the SNPs and to estimate LD using genotypic data. Haplotypes from genotype data were estimated and assigned to each tree, using the “PHASE” program (Stephens et al. 2001). Statistical analysis of genotype classes showing AEI was done using “Graphpad Prism” software. We used single-marker as well as interval mapping for quantitative trait loci (QTL) analysis in the full-sib family. We used the GLM function of “TASSEL” (Bradbury et al. 2007) software and SAS to identify SNP–trait associations in the association population. Seven traits were tested for association with 11 SNPs. Significance parameters were based on 1000 permutation tests. Experimentwise P-values were calculated on the basis of the minimum P-value across all tests from permuted trait data compared to the original P-value for each marker. Adjusted P-values representing the percentage of times the permuted P-value was lower than the original P-value were used in testing for significant associations. Haplotype association tests were done on a three-marker sliding window, using haplotype trend regression software (Zaykin et al. 2002). Overall significance of the haplotype was based on 1000 permutation tests. SNP7 association with traits was further analyzed in additive, dominant, and recessive models, using the “SNPStats” program (Sole et al. 2006).
RESULTS
Eucalyptus has at least two genes homologous to AtCOBL4:
E. nitens homologs (EniCOBL4A and EniCOBL4B) of ESTs identified in earlier studies (Qiu et al. 2008) share strongest amino acid identity (81 and 84%, respectively) with AtCOBL4. Phylogenetic analysis revealed that the two eucalypt genes reside in a subclade that includes AtCOBL4 and its homologs from other plants (Figure 1).
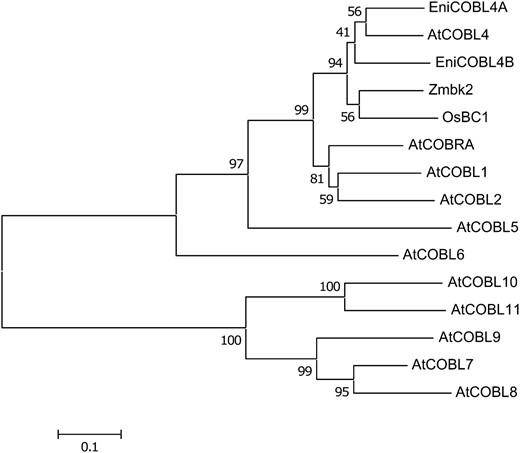
Phylogenetic tree of COBRA-like homologs. A phylogenetic tree is shown of the predicted COBRA-like (COBL) proteins from Arabidopsis, AtCOBRA (AT5G60920), AtCOBL1 (AT3G02210), AtCOBL2 (AT3G29810), AtCOBL4 (AT5G15630), AtCOBL5 (AT5G60950), AtCOBL6 (AT1G09790), AtCOBL7 (AT4G16120), AtCOBL9 (AT5G49270), AtCOBL8 (AT3G16860), AtCOBL10 (AT3G20580), and AtCOBL11 (AT4G27110); E. nitens, EniCOBL4A (FJ213604) and EniCOBL4B (EW688390); Zea mays, Zmbk2 (EF078702); and Oryza sativa, OsBC1 (AY328910). Scale bar represents genetic distance. Node numbers indicate bootstrap support values.
Nucleotide diversity and linkage disequilibrium in EniCOBL4A:
A 3.3-kb region containing the EniCOBL4A gene and 830 bp upstream of the predicted transcription start site was sequenced in 18 unrelated individuals. Eleven common SNPs (frequency >0.1) were detected, 5 from coding and 6 from noncoding regions (Figure 2). Of the coding-region SNPs, SNP2 in exon 1 and SNP4 in exon 3 were nonsynonymous. Within the predicted promoter region, we identified a SNP [promoter region (Pr)SNP] at −665 bp and a trinucleotide microsatellite (Pr simple sequence repeat (SSR)] at −365 bp.
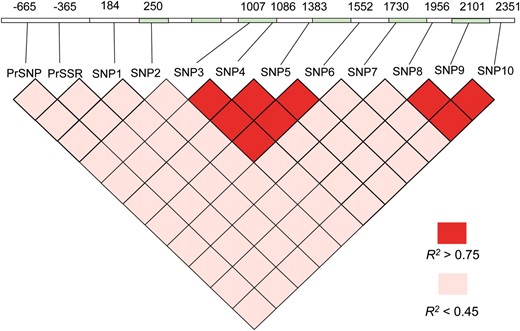
EniCOBL4A gene structure and pairwise linkage disequilibrium (R2). Numbers above the gene indicate the positions of SNPs in base pairs relative to the predicted transcription start site. Green indicates exons, and white indicates introns and untranslated regions.
Tests of neutrality with allele sequences from 18 trees revealed little evidence of selection at the EniCOBL4A locus. Analysis of the minimum number of recombination events using the four-gamete test (Hudson and Kaplan 1985) identified two potential regions of recombination: one between SNP1 and SNP3 and one between SNP7 and SNP8. LD analysis using genotype data from 300 trees in the association population (Figure 2) showed that PrSSR and SNP2 had no significant LD with any SNPs and revealed 2 distinct haplotype blocks from SNP3 to 6 (545 bp) and SNP8 to 10 (395 bp). Within each block, LD among the SNPs was high (r2 > 0.80), while between the 2 haplotype blocks LD was low (r2 < 0.30). SNP7 from exon 5, which occurred between the 2 haplotype blocks, had low LD with SNPs from the 2 blocks. Haplotype analysis with genotype data from all SNPs revealed 13 haplotypes that occurred in 95% of trees in the association population (Table 1).
Haplotype frequencies in the association population estimated using genotypic information from 11 SNPs
Index | Haplotype | Frequency |
|---|---|---|
| 1 | CAGTGTCGGTC | 0.217 |
| 2 | CAATGTCAGTC | 0.146 |
| 3 | CAGCAGGAGTC | 0.140 |
| 4 | TGGCAGGACGT | 0.096 |
| 5 | TGGTGTCGGTC | 0.090 |
| 6 | TGGCAGGAGTC | 0.085 |
| 7 | CAGCAGGACGT | 0.056 |
| 8 | CGGCAGGACGT | 0.033 |
| 9 | CAGTGTCAGTC | 0.031 |
| 10 | CAGCAGGACTC | 0.027 |
| 11 | CGGTAGGACGT | 0.010 |
| 12 | CAGCAGGAGTT | 0.009 |
| 13 | CGGCAGGAGTC | 0.006 |
Haplotypes shown in boldface type also occur in the full-sib family.
Haplotype structure in the full-sib family was determined by genotyping all the SNPs in the grandparents, parents, and progeny. This revealed that the progeny inherited three haplotypes from the parents (Figure 3). Haplotypes 1, 2, and 3 in the full-sib family correspond to haplotypes 12, 1, and 13, respectively, in the association population (Table 1). Haplotypes 1 and 3 in the full-sib family are very rare in the association population (frequency <0.01).
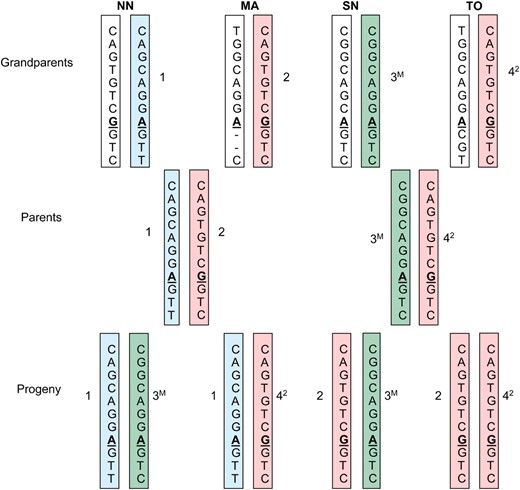
Chromosomal inheritance of EniCOBL4A haplotypes in a E. nitens full-sib family. Haplotypes determined from genotypes of PrSNP and SNP1–10 are shown. SNP7 is shown in boldface type and underlined. The letter M on haplotype 3 indicates methylated allele. Numbers beside the bars indicate grandparental haplotypes. Haplotype 2 and 4 are the same. Haplotype 4 is shown as 42. NN, northern New South Wales; MA, Macalister; SN, southern New South Wales; TO, Tooronga.
EniCOBL4A colocates to a QTL region for cellulose content:
We tested for association of EniCOBL4A with chemical (lignin content, cellulose content, pulp yield) and physical (cellulose microfibril angle and wood density) wood quality traits in the E. nitens full-sib family. Since SNP7 was heterozygous in both the parents of the full-sib family, we used this SNP to genotype the 275 progeny. Analysis of variance (ANOVA) revealed a significant association of EniCOBL4A with cellulose content and kraft pulp yield (Table 2). AA homozygotes were associated with higher trait values while GG homozygotes were associated with lower trait values. Further analysis of the data assuming additive, dominant, and recessive models revealed the strongest association between EniCOBL4A and cellulose and kraft pulp yield was observed under a dominant model (Table 2). Additional tests in the full-sib family with four genotype classes as determined by SNP10 (Figure 3) increased the significance of the EniCOBL4A–cellulose association compared to the codominant model (Figure 4A). Linkage analysis with several genetic markers revealed that EniCOBL4A colocates to a QTL region for cellulose content on linkage group 10 of an E. nitens linkage map (Byrne et al. 1995). Within the QTL region the significance of the EniCOBL4A association with cellulose content was higher than that of the other linked markers (Figure 4B).
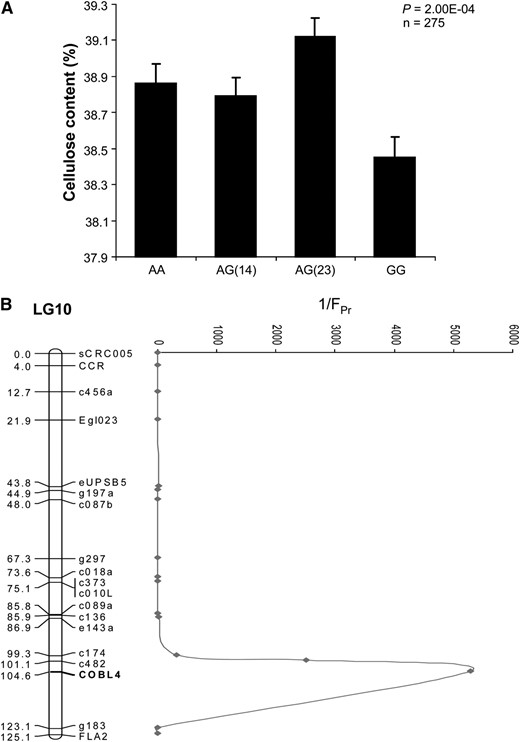
SNP7 genotype associations and position of cellulose QTL in a full-sib family. (A) SNP7 associations with cellulose using four genotype classes. Error bars are standard error of mean. (B) E. nitens linkage group (LG) 10 with QTL for cellulose. Reciprocals of P-values are shown on the right side of LG 10.
EniCOBL4A associations with cellulose and kraft pulp yield (KPY) in a full-sib family of E. nitens (n = 275)
Model | Genotype | n | Cellulose mean (SE) | P-value | KPY mean (SE) | P-value |
|---|---|---|---|---|---|---|
| Codominant | GG | 80 | 38.45 (0.11) | 0.0006 | 50.83 (0.13) | 0.01 |
| AG | 138 | 38.94 (0.07) | 51.32 (0.10) | |||
| AA | 57 | 38.84 (0.12) | 51.18 (0.14) | |||
| Dominant | GG | 80 | 38.45 (0.11) | 0.0002 | 50.83 (0.13) | 0.003 |
| AG-AA | 195 | 38.91 (0.06) | 51.28 (0.08) | |||
| Recessive | GG-AG | 218 | 38.76 (0.06) | 0.57 | 51.14 (0.08) | 0.81 |
| AA | 57 | 38.84 (0.12) | 51.18 (0.14) | |||
| Overdominant | AA-GG | 137 | 38.61 (0.08) | 0.0032 | 50.98 (0.10) | 0.014 |
| AG | 138 | 38.94 (0.07) | 51.32 (0.10) | |||
| Log additive | — | — | — | 0.0058 | — | 0.041 |
Significant P-values using ANOVA are highlighted in boldface type. The P-value of the marker under the codominant model is significant after correcting for chromosomewide multiple testing.
SNP7 of EniCOBL4A is associated with cellulose content and kraft pulp yield:
To fine map EniCOBL4A we initially genotyped all 11 SNPs in 300 trees from the E. nitens association population. Earlier studies have shown that there is no significant structure in the population used in the present study (Thumma et al. 2005). Single-marker analysis with seven wood traits revealed that SNP7 from exon 5 was significantly associated with cellulose content and kraft pulp yield (Table 3). Haplotype analysis did not improve the significance of the SNP7 association, suggesting that the effect is restricted to the SNP7 region (Table 3). A further 116 samples from the association population were genotyped for SNP7 alone and associations with cellulose and kraft pulp yield for the entire population are presented in Table 4. The frequency of AA homozygotes and AG heterozygotes for SNP7 was 0.45 and that of the GG homozygote was 0.1 in the association population. Mean cellulose values of the AA homozygotes were highest (40.85%) and those of GG homozygotes were lowest (40.44%), while mean cellulose values of AG heterozygotes were intermediate (40.58%). Similarly, mean kraft pulp yield values of AA homozygotes were higher (52.60%) than those of GG homozygotes (52.31%) and AG heterozygotes (52.29%). Further analysis of the effect of SNP7 under different genetic models identified strong evidence of association between SNP7 and cellulose under additive and/or dominant genetic models (Table 4). Similarly, a strong association was observed with kraft pulp yield under a dominant model (Table 4).
EniCOBL4A associations with cellulose and kraft pulp yield (KPY) in an association population of E. nitens based on single-marker analysis and haplotype analysis
Cellulose: | KPY: | Cellulose: | KPY: | ||
|---|---|---|---|---|---|
| SNP | Pa | P | Haplotype | Pb | P |
| PrSNP | 0.79 | 0.94 | PrSNP–SNP2 | 0.20 | 0.08 |
| SNP1 | 0.38 | 0.44 | SNP1–SNP3 | 0.38 | 0.14 |
| SNP2 | 0.83 | 1.00 | SNP2–SNP4 | 0.72 | 0.35 |
| SNP3 | 1.00 | 1.00 | SNP3–SNP5 | 0.59 | 0.81 |
| SNP4 | 1.00 | 0.99 | SNP4–SNP6 | 0.58 | 0.59 |
| SNP5 | 1.00 | 1.00 | SNP5–SNP7 | 0.24 | 0.22 |
| SNP6 | 1.00 | 0.98 | SNP6–SNP8 | 0.13 | 0.12 |
| SNP7 | 0.014 | 0.010 | SNP7–SNP9 | 0.035 | 0.046 |
| SNP8 | 0.98 | 0.78 | SNP8–SNP10 | 0.73 | 0.59 |
| SNP9 | 1.00 | 1.00 | |||
| SNP10 | 0.65 | 0.86 |
P-values using ANOVA are experimentwise values adjusted for multiple testing based on permutation tests.
P-values are based on permutation tests.
SNP7 associations with cellulose and kraft pulp yield (KPY) in an association population of E. nitens (n = 416)
Model | Genotype | n | Cellulose mean (SE) | P-value | KPY mean (SE) | P-value |
|---|---|---|---|---|---|---|
| Codominant | AA | 187 | 40.85 (0.08) | 0.023 | 52.60 (0.08) | 0.015 |
| AG | 188 | 40.58 (0.08) | 52.29 (0.07) | |||
| GG | 41 | 40.44 (0.19) | 52.31 (0.17) | |||
| Dominant | AA | 187 | 40.85 (0.08) | 0.0079 | 52.60 (0.08) | 0.0037 |
| AG-GG | 229 | 40.55 (0.07) | 52.29 (0.07) | |||
| Recessive | AA-AG | 375 | 40.71 (0.06) | 0.14 | 52.44 (0.05) | 0.45 |
| GG | 41 | 40.44 (0.19) | 52.31 (0.17) | |||
| Overdominant | AA-GG | 228 | 40.78 (0.08) | 0.076 | 52.54 (0.07) | 0.015 |
| AG | 188 | 40.58 (0.08) | 52.29 (0.07) | |||
| Log additive | — | — | — | 0.007 | — | 0.01 |
Significant P-values using ANOVA are highlighted in boldface type.
While the absolute values of cellulose content and kraft pulp yield differ between the association population and the full-sib population, the AA homozygotes were associated with higher trait values while GG homozygotes were associated with lower trait values in both the populations. Also, the trait differences between AA and GG homozygotes for cellulose content and kraft pulp yield were similar in the two populations, varying by 0.4 and 0.3%, respectively (Tables 2 and 4). However, while the mean trait values of the heterozygotes were lower compared to those of AA homozygotes in the association population, they were higher in the full-sib family. Similarly, allele G was dominant in the association population, in contrast to the full-sib family where allele A was generally dominant (Tables 2 and 4).
SNP7 alleles of EniCOBL4A are differentially expressed:
To test its functional significance we used SNP7 (exonic) to examine allele-specific expression, using xylem cDNA from 16 unrelated trees heterozygous at SNP7. Allelic expression ratio estimates had very low standard errors, suggesting that these estimates are robust and repeatable (Figure 5). In all trees expression of allele A was lower than that of allele G. Allele A is expressed at ∼85% of the level of allele G with the A/G expression ranging from 0.67 to 0.98 (Figure 5A). Three distinct genotype classes are predicted with high probability (100%) for 15 of the 16 trees when genotype information for SNP2–SNP10 is used in phase analysis. Population frequencies of genotype class 1 and genotype class 2 are 0.15 while that of genotype class 3 is 0.08. AEI appeared to be related to the haplotype structure of the trees (Figure 5A). AEI of genotype class 1 (GTGTCGGTC/GCAGGACGT) ranged from 0.67 to 0.82 (mean 0.74), that of genotype class 2 (GTGTCGGTC/GCAGGAGTC) ranged from 0.78 to 0.98 (mean 0.89), and genotype class 3 (ATGTCAGTC/GTGTCGGTC) had an AEI of ∼0.97. Allelic expression of genomic DNA (gDNA) controls ranged from 0.9 to 1.1 with a mean of 1.0. Consistent lower expression of allele A in all 16 SNP7 heterozygous trees suggests that SNP7 influences AEI.
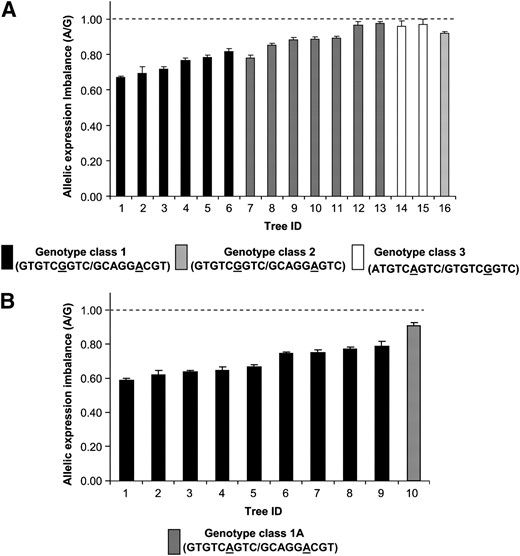
Allelic expression imbalance in E. nitens association population. (A) Allelic expression imbalance in 16 unrelated SNP7 heterozygous trees determined using SNP7. Haplotypes were estimated and assigned to each tree using PHASE software with genotype information from SNPs 2–10 and are shown in parentheses under each genotype class. Genotype of tree ID 16 could not be determined. (B) Allelic expression imbalance in 9 SNP7 heterozygous trees belonging to genotype class 1 (Figure 4A) and a single tree homozygous at SNP7 but otherwise the same genotype as genotype class 1. Allelic expression in all trees was measured using SNP4. Error bars are standard error of mean. Mean value is based on four replicates. Dashed line indicates average allelic expression of gDNA controls. Allelic expression of genotype class 1 is significantly lower (P < 0.001) than that of gDNA controls, using Kruskal–Wallis analysis with Dunn's post-test.
SNP7 contributes to the regulation of allelic expression imbalance:
We directly tested the impact of SNP7 on allelic expression by comparing AEI in trees of genotype class 1 with that in a tree of the same genotype except that it was homozygous at SNP7 (GTGTCAGTC/GCAGGACGT; Figure 5B), designated as genotype class 1A. We used SNP4 for measuring AEI in this tree after confirming SNP4 AEI measurements were similar to SNP7's (r2 = 0.95). We measured AEI in an additional five genotype class 1 trees using SNP4 and found it ranged from 0.62 to 0.77 with a mean of 0.69 while AEI of the tree with genotype class 1A was 0.91 (Figure 5B).
We tested if AEI in genotype class 1 is significantly different from that in gDNA controls and other genotype classes. Even though we had a single tree belonging to genotype class 1A, we were able to use the information from the two alleles in a statistical analysis similar to that in Zhang et al. (2005). Nonparametric (Kruskal–Wallis) analysis with Dunn's post-test showed that allelic expression in genotype class 1 was significantly different from that in the gDNA controls (P < 0.0001), implying unequal expression of the two alleles in this genotype class, whereas other genotype classes, including class 1A, were not significantly different from gDNA. Equal expression of the two alleles in a tree belonging to genotype class 1A provides further support that SNP7 plays a role in the regulation of AEI. However, equal expression of two alleles in genotype classes 2 and 3 indicates other variants interact with SNP7.
Nuclear proteins bind differentially to SNP7 alleles:
To test whether SNP7 is part of a cis-acting regulatory element within the EniCOBL4A gene we carried out EMSAs using two 25-bp biotin-labeled probes spanning the SNP7 region but differing by the presence of an A or a G nucleotide at SNP7 (Figure 6). While nuclear proteins were found to bind to both alleles, we observed greater binding of nuclear protein to allele A compared to allele G (Figure 6A). Two bands were observed in the lanes with mobility shifts, suggesting two different protein complexes were binding to the probes. These experiments were repeated several times and with different concentrations of probes and we observed consistent differences in the intensity of the shifted bands between the two probes (Figure 6B).
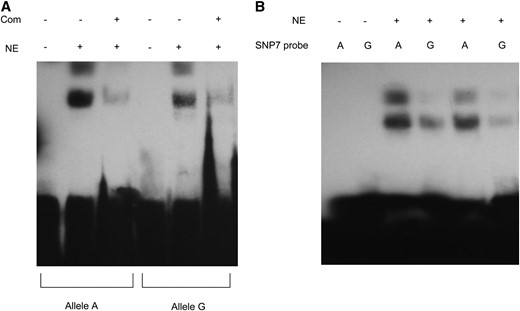
Electrophoretic mobility shift assay (EMSA) using probes specific to SNP7 alleles. (A) EMSA. Biotin-labeled probes are incubated with (+) and without (−) nuclear extracts (NE) and the specificity of the reaction was tested with 100-fold excessive molar concentration of the unlabeled competitive probe (Com). (B) EMSA with different probe concentrations. Differential binding of the nuclear extracts to the two alleles was repeated twice with different concentrations (750 fmol in lanes 3 and 4 and 500 fmol in lanes 5 and 6) of biotin-labeled probes.
Allelic expression imbalance in the full-sib family:
We examined AEI in 28 heterozygous trees in a full-sib family whose parents were both heterozygous at SNP7. Using SNP10 (Figure 3) we separated the two heterozygote classes as 1, 4 and 2, 3. Class 1, 4 heterozygotes had a mean expression ratio (A/G) of 0.97 while 2, 3 heterozygotes had a mean expression ratio of 1.29 (Figure 7). Allelic expression in class 1, 4 heterozygotes was not significantly different from that in gDNA controls (nonparametric analysis with Dunn's post-test, P > 0.05), while in class 2, 3 heterozygotes allelic expression was significantly different from that in gDNA controls (P < 0.0001), indicating differential expression of the two alleles in 2, 3 heterozygotes. In contrast to AEI in the association population, expression of allele A was higher than that of allele G in the 2, 3 heterozygote class of the full-sib family. Class 2, 3 heterozygotes that showed AEI have significantly higher cellulose content compared to 1, 4 heterozygotes (Figure 4A, P = 0.018), suggesting that cellulose content and the level of allelic expression of allele A are positively correlated. The association of allelic expression ratios with specific genotype classes in the association population (Figure 5) and full-sib family (Figure 7) indicates that AEI in both populations is heritable.
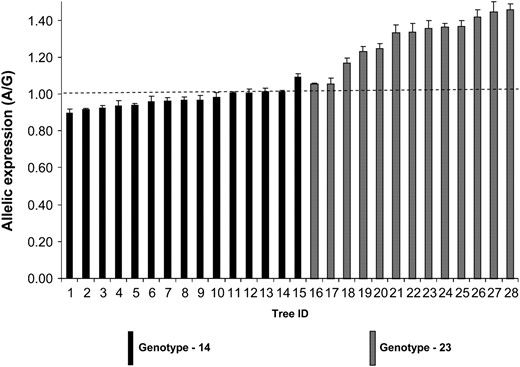
Allelic expression imbalance in the E. nitens full-sib family. Allelic expression was measured using cDNA from 28 trees heterozygous for SNP7. Heterozygous trees are made up of two different genotypic classes. Error bars are standard error of mean. Mean value is based on four replicates. Dashed line indicates average allelic expression of gDNA controls. Allelic expression of genotype class 2, 3 is significantly higher (P < 0.0001) than that of gDNA controls, using Kruskal–Wallis analysis with Dunn's post-test.
Allelic expression imbalance in the full-sib family is linked to allele-specific methylation:
Since allele G of SNP7 occurs in a CpG dinucleotide, we sequenced bisulfite-treated genomic DNA from an AA homozygous and a GG homozygous tree from the full-sib family to reveal methylated sites in a 250-bp region surrounding SNP7. We did not detect methylation of allele G at SNP7; however, we detected methylation specific to the AA homozygous tree at a single CpG dinucleotide in intron 4 ∼75 bp upstream of SNP7. Approximately half of the clones sequenced from the AA homozygous tree had a C nucleotide at the methylated site and the other half had a T nucleotide, suggesting that the tree is heterozygous for methylation. To study the heritability of the methylated site in the full-sib family, we analyzed the grandparents, the parents, and four progeny trees belonging to four different genotype classes, using MS-SNuPE (Gonzalgo and Jones 2002). This analysis revealed that the methylation of the CpG site is heritable and allele specific in the full-sib family (see inheritance of methylated allele in Figure 3). One of the grandparents of the paternal parent (SN) is heterozygous for methylation. The paternal parent inherited the methylated allele and passed it on to the progeny in an allele-specific manner. Allele A of the 2, 3 heterozygous class (Figure 3) in the progeny, which showed higher expression, was methylated; while in the 1, 4 heterozygous class allele A was unmethylated. Methylation, therefore, is associated with the allele that showed higher expression. We observed the same allele-specific methylation pattern in DNA from either xylem or leaf tissue, suggesting that methylation of this site is not tissue specific. Methylation of the intron 4 site is rare in the association population as analysis of the DNA of >200 trees using primer extension revealed only 2 trees that were methylated. In both populations, methylation at other CpG dinucleotides between SNP6 and SNP8 was absent.
DISCUSSION
In this study we exploited the low LD usually found in forest trees to fine map functional polymorphisms in EniCOBL4A. To identify cis-acting regulatory polymorphisms we analyzed AEI in an association population and a full-sib family and carried out EMSA analysis. Regulatory mechanisms are most often functionally characterized by in vitro methods such as transient transfection experiments. The main drawback of such approaches is that the experiments are performed away from the normal chromosomal environment and may not represent the in vivo condition (Pastinen et al. 2004). Analysis of AEI in vivo using SNP markers from transcribed regions is a powerful approach to detect regulatory polymorphisms (Knight 2005). In a recent report Cirulli and Goldstein (2007) tested the congruence between reporter gene assays and in vivo methods of allelic expression. They showed that in vitro assays fail to predict in vivo effects of regulatory polymorphisms, suggesting that the effects of polymorphisms on gene expression are more complex and context dependent.
Differential expression of alleles in a heterozygous individual where both alleles are exposed to the same environmental and trans-acting factors strongly suggests the presence of cis-regulating polymorphisms. Therefore AEI can reveal subtle cis-acting differences even when feedback mechanisms dilute the total expression differences (Pastinen et al. 2006). Using SNP7 in the association population we found that allele A is expressed consistently at a lower level than allele G in all the trees tested even though the expression of alleles A and G is not significantly different in genotypes 2 and 3. If expression imbalance consistently shifts in one direction, i.e., one allele is expressed more strongly than the other allele in all the samples, this suggests that the transcribed marker used for studying AEI itself could be the cis-regulating polymorphism or in high LD with such a polymorphism (Tao et al. 2006). As SNP7 occurs in low LD with other markers from this gene, this suggests that SNP7 itself may be the cis-regulating polymorphism controlling AEI. Allelic expression analysis in an individual tree containing the two differentially expressed haplotypes but homozygous at SNP7 revealed similar expression between the two haplotypes. Taken together these results strongly suggest that SNP7 is a regulatory polymorphism giving rise to the AEI. This is further supported by EMSA analysis that revealed preferential binding of nuclear proteins to allele A at SNP7. In many human genetic studies regulatory haplotypes controlling AEI were identified by LD mapping (Knight et al. 2003; Pastinen et al. 2005; Tao et al. 2006). However, further fine mapping of these haplotypes to identify cis-regulatory polymorphisms was not possible because of the extent of LD in humans. We were able to fine map the control of AEI to a region surrounding SNP7 because of the low LD observed in the gene. Searching through the plant cis-acting regulatory DNA elements (PLACE) database (Higo et al. 1999), we found two “CAAT” box elements near SNP7. One was 2 bp upstream of SNP7 and the other was 9 bp downstream of SNP7. CAAT box elements are responsible for tissue-specific promoter activity of the pea legumin gene in tobacco (Shirsat et al. 1989).
Our discovery of a synonymous exonic SNP (SNP7) lying in a cis-acting regulatory element is somewhat surprising. Regulatory elements such as transcriptional enhancers and silencers are generally found in noncoding sequences such as promoters, introns, and untranslated regions. However, there are a few reports of the occurrence of transcriptional regulatory elements in coding regions (Neznanov et al. 1997; Lang et al. 2005; Pierce et al. 2006). Barthel and Liu (2008) used computational approaches to identify a transcriptional regulatory element in exon 2 of ADAMTS5, a human myogenesis gene. Using different approaches such as chromatin immunoprecipitation and reporter gene assays, they confirmed that the regulatory element in exon 2 acts as a transcriptional enhancer. Tao et al. (2006) used allele-specific expression, EMSA, and reporter gene assays to identify several polymorphisms in the human KRT gene that are involved in transcriptional regulation, including a coding region polymorphism. High-resolution mapping of expression QTL (eQTL) in humans by Veyrieras et al. (2008) revealed that SNPs in exons are twofold more likely to be expression quantitative trait nucleotides than SNPs in introns.
In the full-sib family we detected heritable, allele-specific methylation of allele A 75 bp upstream of SNP7 that is associated with differential allelic expression of 2, 3 heterozygotes. There are few reports in plants where allele-specific methylation (ASM) was associated with AEI of nonimprinted genes. In a survey of genomewide methylation patterns in humans, Kerkel et al. (2008) identified sequence-dependent ASM at several nonimprinted genes. At two loci they found association of AEI with sequence-dependent ASM. They suggested that the presence of ASM is an indicator of nearby regulatory polymorphisms and identification of ASM could be used for fine mapping functional variants (Kerkel et al. 2008). However, the association between allelic expression and methylation observed in the full-sib family requires further functional analyses to understand the role of methylation in allelic expression. Methylation is unlikely to be involved in the AEI observed in the association population as methylation at the intron 4 CpG site is rare.
In all the trees measured for AEI in the association population, expression of allele A is either lower than or equal to that of allele G. In contrast, in the full-sib family expression of allele A is either equal to or higher than that of allele G. In the association population, where expression of allele A is low, methylation at the intron 4 CpG site is very rare. Higher expression of allele A in the full-sib family, therefore, may be linked to its methylation. Methylation of CpG islands in promoter regions is usually associated with lower expression; however, the relationship between gene expression and transcribed region methylation is not clear. Genomewide methylation analysis of Arabidopsis revealed that >30% of genes are methylated in transcribed regions and the methylated genes tended to be more highly expressed (Zhang et al. 2006). Further evidence for higher expression of methylated genes comes from genetic studies of human diseases (Unoki and Nakamura 2003; Polesskaya et al. 2006). Recent studies suggest that cyclic methylation and demethylation of CpG sites in promoter regions can play a role in transcriptional regulation of genes (Kangaspeska et al. 2008; Metivier et al. 2008). Such transient demethylation may underlie the higher expression of methylated genes observed in these studies.
Quantitative trait locus mapping revealed that EniCOBL4A maps to the region of a QTL for cellulose in LG 10 of an E. nitens linkage map (Figure 4B). Association mapping with a number of SNPs within EniCOBL4A revealed that SNP7 is significantly associated with cellulose content and kraft pulp yield (Tables 3 and 4). This observation is consistent with data from Arabidopsis and other plant species where COBL4 has been shown to be involved in cellulose deposition and cell wall formation. This study demonstrates the potential for high-resolution mapping of candidate genes in a species with low LD. We observed several rare SNPs and 11 common SNPs in EniCOBL4A in 18 unrelated trees. In contrast, we did not detect any SNPs in the AtCOBL4 gene in 18 Arabidopsis ecotypes in a published SNP database (http://natural.salk.edu/cgi-bin/snp.cgi?). This difference likely reflects fundamental differences in the life histories of the two species, with Arabidopsis being highly inbred compared to eucalypts that are mostly outcrossing. While the capacity for fine mapping of candidate genes as described here may be limited in Arabidopsis, genomewide association studies should result in high-resolution mapping of genomic regions containing a few candidate genes.
Allele A was found to be dominant in the full-sib family while allele G was dominant in the association population. This may be due to epistatic effects or it may be due to the differences in the genetic background of the two populations with the full-sib family carrying much less diversity than the association population. It may also be related to the contrasting patterns of allelic expression observed in the two populations. In the full-sib family mean allelic expression of allele A is higher than that of allele G (AEI = 1.12; Figure 7); however, in the association population mean allelic expression of allele A is lower than that of allele G (AEI = 0.84; Figure 5). Similarly there appears to be a correlation between allelic expression and performance of the heterozygotes in the two populations. In the full-sib family, AG heterozygotes are associated with high trait values whereas in the association population they are associated with low trait values (Tables 2 and 4). Moreover, within the full-sib family where the two heterozygote classes showed different allelic expression patterns, there was a significant difference in the cellulose content with 2, 3 heterozygotes having higher trait values compared to 1, 4 heterozygotes (Figure 4A). It is tempting to speculate that higher expression of allele A in the full-sib family may give rise to the higher trait values of 2, 3 heterozygotes. Equal expression of both alleles in 1, 4 heterozygotes may lead to high trait values similar to those of AA homozygotes, while lower expression of allele A may explain the lower trait values of AG heterozygotes in the association population. This hypothesis is supported by studies in maize, which showed that genes with differential allelic expression tended to be correlated with yield heterosis but not genes with high expression (Guo et al. 2006).
Recently Serre et al. (2008) used an Illumina BeadArray to analyze AEI in >1000 genes. Development of high-throughput methods for assessing AEI will be helpful in selection of candidate genes for association studies. While cis-acting effects may be revealed by AEI, important trans-acting effects may not be identified by studying AEI alone. Kirst et al. (2004, 2005) using eQTL analysis in Eucalyptus found that genes involved in the lignin biosynthetic pathway are predominantly regulated through cis-acting effects; however, a number of genes in differentiating xylem tissue are also regulated through trans-acting effects. A combination of AEI studies with eQTL studies should therefore be helpful in identification of both cis- and trans-acting regulatory effects. In conclusion this study demonstrates the opportunities for identifying functional polymorphisms in populations with low LD. The observation that an epigenetic polymorphism is likely to influence AEI and subsequently phenotypic variation in cellulose content suggests epigenetic variation may be a relatively common mechanism underlying quantitative trait variation.
Footnotes
Sequence data from this article have been deposited with the EMBL/GenBank Data Libraries under accession no. FJ213604 (EniCOBL4A).
Supporting information is available online at http://www.genetics.org/cgi/content/full/genetics.109.106591/DC1.
Present address: Key Laboratory for Genetics and Breeding in Forest Trees and Ornamental Plants, Beijing Forestry University, Beijing 100083, People's Republic of China.
Footnotes
Communicating editor: M. Kirst
Acknowledgements
We thank Forestry Tasmania and Gunns Ltd. for access to the E. nitens association and full-sib mapping populations, respectively. We acknowledge financial support from Forest and Wood Products Australia (grant no. PNO7.3024).
References
Brown, G. R., G. P. Gill, R. J. Kuntz, C. H. Langley and D. B. Neale,
Byrne, M., J. C. Murrell, B. Allen and G. F. Moran,
Ching, A., K. Dhugga, L. Appenzeller, R. Meeley, T. Bourett et al.,
Evans, R., and J. Ilic,
Fan, J. B., A. Oliphant, R. Shen, B. G. Kermani, F. Garcia et al.,
Knight, J. C.,
Salvi, S., G. Sponza, M. Morgante, D. Tomes, X. Niu et al.,
Schimleck, L. R., P. S. Kube and C. A. Raymond,
