


Abstract
Vertebrate vision is mediated by five groups of visual pigments, each absorbing a specific wavelength of light between ultraviolet and red. Despite extensive mutagenesis analyses, the mechanisms by which contemporary pigments absorb variable wavelengths of light are poorly understood. We show that the molecular basis of the spectral tuning of contemporary visual pigments can be illuminated only by mutagenesis analyses using ancestral pigments. Following this new principle, we derive the “five-sites” rule that explains the absorption spectra of red and green (M/LWS) pigments that range from 510 to 560 nm. Our findings demonstrate that the evolutionary method should be used in elucidating the mechanisms of spectral tuning of four other pigment groups and, for that matter, functional differentiations of any other proteins.
DIM-LIGHT and color vision in vertebrates are mediated by five groups of visual pigments (RH1, RH2, SWS1, SWS2, and M/LWS pigments), each consisting of a protein moiety (opsin) and a covalently bound 11-cis-retinal (or 11-cis-3, 4-dehydroretinal) (Yokoyama 2000a; Ebrey and Koutalos 2001; Palczewski 2006). The fundamental characteristic that distinguishes these visual pigments from each other is the wavelength of maximal absorption (λmax). Interacting with different opsins, the identical 11-cis-retinals in different visual pigments detect a wide range of λmax's from 360 nm (UV) to 560 nm (red). The molecular bases of the spectral tuning in visual pigments have been studied using two fundamentally different types of mutagenesis experiments. The first approach is based usually on physico-chemical differences of amino acids, while the second approach reflects amino acid polymorphisms among different visual pigments. Although they are not mutually exclusive, the goal of the first approach is to deduce how visual pigments work in general, while that of the second approach is to recapitulate how the variable absorption spectra of contemporary pigments have been generated. For example, by introducing an amino acid change from glutamic acid to glutamine at residue 113 (E113Q) into bovine rhodopsin, the first approach has established that E113 not only serves as the retinylidene Schiff base counterion (Sakmar et al. 1989; Zhukovsky and Oprian 1989; Nathans 1990a,b) but also has a critical role in activating G protein effectively (Terakita et al. 2004).
Most mutations considered in the first approach, including E113Q, did not occur in nature and the significance of these results in elucidating the mechanisms that generated the variable λmax's (360–560 nm) of visual pigments in nature is not immediately clear. If we want to understand the molecular genetic bases of dim-light and color vision, we need to study amino acid changes that actually occurred in nature (Yokoyama 1995). Despite extensive mutagenesis analyses of the second approach (reviewed in Yokoyama 2000a, 2002; Ebrey and Takahashi 2002; Takahashi and Ebrey 2003; Yokoyama et al. 2007), the molecular mechanisms that modulate the variable λmax's observed in nature are still not well understood. To avoid the status quo, the accumulated mutagenesis data must be examined carefully and, if necessary, appropriate new approaches must be taken. Indeed, the accumulated mutagenesis results reveal that the interactions among different amino acids in visual pigments are much stronger than we currently think. This observation calls for a dramatic change in the way we conduct mutagenesis experiments; namely, the traditional approach of using contemporary pigments must be replaced by the new approach of introducing mutations into ancestral pigments.
MATERIALS AND METHODS
Background information:
Traditionally, mutagenesis experiments have been conducted using contemporary visual pigments and the mutagenesis results based on polymorphic amino acids are interpreted under two implicit assumptions: (1) the identical amino acid changes in different pigments shift the λmax by the same magnitude and in the same direction and (2) the effects of mutations in the opposite directions shift the λmax to the opposite directions by the same magnitudes. Much to our surprise, however, the accumulated mutagenesis results (Table 1) do not support these assumptions. In fact, when identical amino acid changes are introduced into different pigments, they can shift the λmax by different amounts and in different directions (compare E113D in RH1 pigments with λmax shifts of +5 to +7 nm to the same mutation in a SWS1 pigment with a λmax shift of −4 nm). Similarly, the λmax shifts caused by A269T in RH1, SWS2, and M/LWS pigments vary from +6 to +15 nm and those caused by S292A in RH1, SWS1, and M/LWS pigments range from 0 to +28 nm. These shifts are in the same direction but differ in magnitude. Comparisons of forward and reverse mutations illustrate violations of the second assumption. For example, both S90G and G90S in SWS1 pigments decrease the λmax (−7 and −11 nm, respectively) as do E113D and D113E in SWS1 pigments (−4 and −12 nm, respectively). Even when forward and reverse mutations shift the λmax in the opposite direction, they can differ in magnitude (D83N, F86Y, S90C, T118A, E122Q, S164A, Y261F, W265Y, A269S, and A292S and their corresponding reverse changes).
The effects of amino acid changes on the λmax shift
Forward mutationa | λmax shift (nm) | Reverse mutation | λmax shift(nm) |
|---|---|---|---|
| D83NRH1b | −6–0 | N83DRH1cd | 2–8 |
| F86YSWS1b | 60–66 | Y86FSWS1b | −75– −71 |
| S90CSWS1b | −46– −7 | C90SSWS1b | 35–38 |
| S90GSWS1b | −7 | G90SRH1b | −13 |
| G90SSWS1b | −11 | ||
| E113DRH1ef | 5–7 | D113ESWS1g | −12 |
| E113DSWS1h | −4 | ||
| T118ARH1b | −18– −16 | A118TSWS1b | 3 |
| E122QRH1b | −21– −15 | Q122ERH1b | 10 |
| Q122ERH2b | 13 | ||
| S164AM/LWSb | −7 | A164SRH1b | 2 |
| A164SM/LWSb | 2–6 | ||
| Y261FRH1b | −8 | F261YRH1b | 10 |
| Y261FM/LWSb | −10– −7 | F261YMLWSb | 6–9 |
| W265YRH1b | −17– −15 | Y265WSWS1b | 10 |
| T269AM/LWSb | −16– −15 | A269TRH1b | 14 |
| A269TSWS2b | 6 | ||
| A269TM/LWSb | 15 | ||
| A269SSWS2h | 5 | S269ASWS2h | 0 |
| A292SRH1b | −10– −19 | S292ARH1b | 8 |
| S292ASWS1b | 0 | ||
| S292A/LWSb | 18–28 |
Amino acid residue numbers are those of bovine RH1 pigment. Residues 164, 261, and 269 correspond to 180, 277, and 285 in the human M/LWS pigments, respectively.
Forward amino acid replacements have been defined previously (Yokoyama 2000a,b; Shi et al. 2001; Yokoyama and Tada 2003; Takahashi and Yokoyama 2005).
Yokoyama and Tada (2003, references therein).
A thorough mutagenesis analysis of human red and green pigments in the M/LWS pigment group (Asenjo et al. 1994) illustrates the problem. Three amino acid changes (S180A/Y277F/T285A) in the red pigment together shift the λmax from 563 to 530 nm, explaining fully the λmax of the green pigment (531 nm). However, the three reverse changes in the green pigment increase the λmax by only 23 nm and do not explain the λmax of the red pigment, where four additional amino acid changes are needed to fully explain the observed value. Clearly, depending on which pigment that we choose to mutate, our conclusions on the molecular basis of spectral tuning in the human M/LWS pigments can be very different!
These seemingly contradictory results occur because of different levels of amino acid interactions in various visual pigments. An extreme example of such interactions can be seen in the spectral tuning for the mouse UV pigment of the SWS1 group: none of seven changes (F46T, F49L, T52F, F86L, T93P, A114G, and S118T) cause any λmax shift individually, but together they increase the λmax by 52 nm (Shi et al. 2001). This example and those in Table 1 cover a total of 16 amino acid residues. So far, certain amino acid changes at a total of 26 residues are known to have modified the λmax's of visual pigments (Yokoyama et al. 2007). Hence, ∼60% of the 26 critical residues do not support the two assumptions of the traditional mutagenesis approach. If the two assumptions at the other residues are tested in the future, the chance of dismissing the two assumptions is likely to increase significantly. Therefore, amino acid interactions in visual pigments are much more widely spread than we currently think.
The mammalian ancestral M/LWS pigment:
The ancestral pigment of mammalian M/LWS pigments has been engineered by introducing a total of 16 amino acid changes into human L (P560) (Yokoyama and Radlwimmer 2001). The full-length LWS opsin cDNA has been cloned into the EcoRI and SalI restriction sites of the expression vector pMT5. Mutant opsins were generated by using the QuickChange site-directed mutagenesis kit (Stratagene, La Jolla, CA). To rule out spurious mutations, these DNA fragments were sequenced by cycle sequencing reactions using the Sequitherm Excel II long-read kits (Epicentre Technologies, Madison, WI) with dye-labeled M13 forward and reverse primers. Reactions were run on a LI-COR (Lincoln, NE) 4300LD automated DNA sequencer.
The in vitro assay:
These clones were expressed in COS1 cells by transient transfection (Yokoyama 2000b). The pigments were regenerated by incubating the opsins with 11-cis-retinal (a gift from Rosalie K. Crouch at Storm Eye Institute, Medical University of South Carolina) and were purified using immobilized 1D4 (The Culture Center, Minneapolis) in buffer W1 [50 mm N-(2-hydroxyethyl) piperazine-N′-2-ethanesulfonic acid (HEPES) (pH 6.6), 140 mm NaCl, 3 mm MgCl2, 20% (w/v) glycerol, and 0.1% dodecyl maltoside]. UV visible spectra were recorded at 20° using a Hitachi U-3000 dual beam spectrophotometer. Visual pigments were bleached for 3 min using a 60 W standard light bulb equipped with a Kodak Wratten 3 filter at a distance of 20 cm. Data were analyzed using Sigmaplot software (Jandel Scientific, San Rafael, CA).
Statistical analyses:
The means (Oi) and their variances (Vi) of λmax's of all 15 M/LWS pigment types were estimated using a least-squares approach in a one-way ANOVA. These 15 means and their variances were then used to estimate the parameters representing individual and synergistic effects (changes in λmax) caused by the amino acid replacements. Parameter estimates and their standard errors were obtained by using experimental design models (Graybill 1961). The parameters estimates for each model were used to calculate the expected λmax's of all 15 M/LWS pigment types for that model. The objective was to evaluate the significance of each parameter and the overall goodness of fit or adequacy of each model. Goodness of fit was evaluated with a
RESULTS
Mutagenesis experiments that recapitulate evolutionary processes:
So far, the characteristics of mutagenesis results (Background information, materials and methods) have received little attention in studying the molecular basis of spectral tuning of various visual pigments. Considering the evolutionary changes of human red and green pigments, we shall illustrate the inevitable implication of the characteristics of mutagenesis results (Figure 1). The ancestral pigment of human red and green pigments contained S180, Y277, and T285 and had a λmax of ∼560 nm; furthermore, the green pigment decreased its λmax by S180A/Y277F/T285A and the seven reverse amino acid replacements did not occur in the green pigment lineage (Yokoyama and Radlwimmer 2001). The effects of the specific amino acid changes on the λmax shift have been evaluated by introducing either S180A/Y277F/T285A into the red pigment and/or the reverse mutations (and, in this specific case, additional four mutations) into the green pigment (Asenjo et al. 1994). However, as stressed in the materials and methods, these results do not necessarily reflect the true effect of S180A/Y277F/T285A on the λmax shift that actually occurred in nature. Instead, the actual effect can be found only by introducing the three amino acid changes into the ancestral pigment. But this requires knowledge of the ancestral pigment. Fortunately, from the amino acid sequences of contemporary pigments, we can infer those of ancestral pigments (Yang et al. 1995; Yang 1997) and engineer them with high precision (Yokoyama and Radlwimmer 2001; Shi and Yokoyama 2003). This evolutionary consideration simplifies the interpretation of the classical mutagenesis results (Asenjo et al. 1994) on the spectral tuning of human red and green pigments.
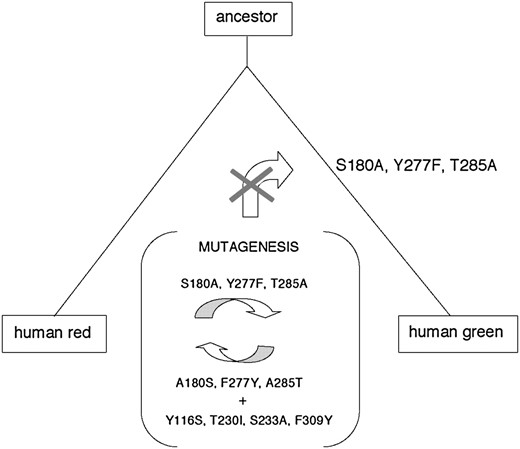
Amino acid replacements (S180A/Y277F/T285A) during the evolution of human red and green pigments from their ancestral pigment. The mutagenesis analyses have been conducted by Asenjo et al. (1994).
The “five-sites” rule for the M/LWS pigments:
Among the five groups of visual pigments, the molecular basis of spectral tuning is best understood for the M/LWS pigments, and five amino acid changes (S180A, H197Y, Y277F, T285A, and A308S) have been proposed to explain the entire range of λmax's (510–560 nm) of M/LWS pigments (Yokoyama and Yokoyama 1990; Neitz et al. 1991; Chan et al. 1992; Asenjo et al. 1994; Sun et al. 1997; Yokoyama and Radlwimmer 2001). The effects of some single and synergistic effects of different amino acid changes on the λmax shift have been studied considering the amino acid compositions of contemporary M/LWS pigments (Yokoyama and Radlwimmer 2001). To evaluate the effects of these amino acid replacements in the spectral tuning, we have to take an entirely different approach and introduce mutations into an ancestral M/LWS pigment.
When we consider amino acid differences at the five critical residues, currently known M/LWS pigments can be grouped into 15 types (Table 2), and we need to evaluate the effects of 14 sets of amino acid replacements on the λmax shift: five single (S180A, H197Y, Y277F, T285A, and A308S), seven double (S180A/H197Y, S180A/Y277F, S180A/T285A, S180A/A308S, H197Y/T285A, H197Y/A308S, and Y277F/T285A), and two triple (S180A/H197Y/A308S and S180A/Y277F/T285A) amino acid changes. Hence, we introduced all of these changes into the ancestral mammalian pigment (pigment d in Yokoyama and Radlwimmer 2001) and determined their λmax's. Here, the ancestral mammalian pigment was used because the amino acid changes at all five residues occurred only in mammalian M/LWS pigments and pigment d is the closest ancestor to them. The results show that the λmax of the ancestral pigment is ∼560 nm, and those of the 14 mutant pigments vary from 512 nm of type 14 to 555 nm of type 2 (Figure 2A).
The λmax's of M/LWS pigments measured using the in vitro assay
Amino acid composition | Expected λmax (nm) | Pigment | |||
|---|---|---|---|---|---|
| SHYTA | 560 | Ancestor a (P563)a | Ancestor b (P563)a | Ancestor c (P561)a | Ancestor d (P558)a |
| Ancestor e (P558)a | Ancestor g (P561)a | Ancestor i (P564)a | Ancestor d (P560) | ||
| Cavefish L (P558)a | Goldfish L (P559)a | Medaka L-A (P561)h | Medaka L-B (P562)b | ||
| Clawed frog L (P557)a | Pigeon L (P559)a | Zebra finch L (P560)a | Chicken L (P561)a | ||
| Human L (P560)a | Marmoset L (P562)a | Capuchin L (P560)h | Sq. monkey L (P558)a | ||
| Ancestor a (P564)a | Ancestor b (P563)a | Ancestor c (P561)a | Ancestor d (P558)a | ||
| Ancestor e (P558)a | Ancestor g (P561)a | Ancestor i (P565)a | Ancestor d (P559) | ||
| Tilapia L (P561)b | Chameleon L (P560)a | Human L (P557)g | Human L (P563)e | ||
| AHYTA | 555 | Ancestor d (P555) | Zebrafish L-1 (P558)b | Marmoset L (P553)a | Cat L (P553)a |
| Elephant L (P552)c | Goat L (P553)a | Ancestor d (P555) | Human L (P552)a | ||
| Human L (P554)d | Human L (P556)e | Platypus L (P550)i | |||
| SYYTA | 536 | Ancestor f (P536)a | Ancestor d (P536) | Squirrel M (P532)a | Ancestor d (P536) |
| Ancestor f (P537)a | |||||
| SHFTA | 550 | Ancestor d (P550) | Ancestor d (P551) | Human L (P553)e | |
| SHYAA | 543 | Ancestor d (P543) | Ancestor d (P543) | Human L (P547)e | |
| SHYTS | 527 | Ancestor d (P527) | Ancestor d (P528) | ||
| AYYTA | 533 | Ancestor d (P533) | Mole rat M (P534)a | Ancestor d (P533) | Human L (P526)d |
| AHFTA | 545 | Ancestor d (P545) | Zebrafish L-2 (P548)b | Capuchin M (P545)h | Sq. monkey L (P545)a |
| Horse M (P545)a | Ancestor d (P547) | Human L (P546)f | Human L (P547)e | ||
| AHYAA | 536 | Ancestor d (P536) | Marmoset M (P539)a | Owl monkey M (P539)j | Galago M (P539)j |
| Ancestor d (P538) | Human L (P539)f | Human L (P540)e | |||
| AHYTS | 525 | Ancestor d (P525) | Ancestor d (P525) | Dolphin M (P524)a | |
| SYYAA | 522 | Ancestor d (P522) | Guinea pig M (P517)a | Ancestor d (P523) | Guinea pig M (P519)a |
| SYYTS | 516 | Ancestor d (P516) | Ancestor d (P517) | ||
| SHFAA | 534 | Ancestor d (P534) | Ancestor d (P536) | Human L (P536)e | |
| AYYTS | 512 | Ancestor d (P512) | Rabbit M (P509)a | Rat M (P509)a | Ancestor d (P513) |
| Human L (P508)d | Mouse M (P508)a | ||||
| AHFAA | 532 | Ancestor d (P532) | Cavefish M (P530)a | Human M (P530)a | Capuchin M (P530)h |
| Deer M (P531)a | Wallaby M (P528)c | Sq. monkey M (P532)a | Ancestor d (P533) | ||
| Gecko M (P527)a | Human M (P530)g | Human M (P532)e | |||
The λmax's that are underlined were measured by subtracting a spectrum measured after photobleaching from a spectrum measured before light exposure (difference spectra), and the λmax's that are not underlined were measured before light exposure (dark spectra). The “Ancestor d” pigments in group 1 have identical amino acid sequences, but their λmax's, evaluated by different investigators, differed by 2 nm, while those in the other groups have different amino acids at 180, 197, 277, 285, and 308 (see column 1). Sq. monkey, squirrel monkey.
Hiramatsu et al. (2004, references therein).
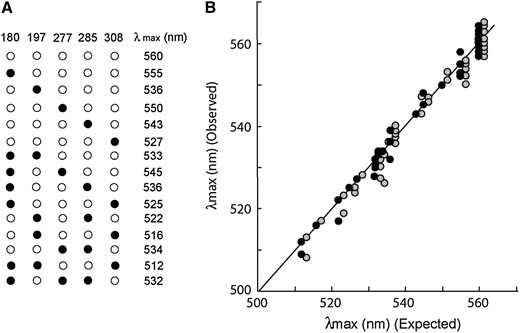
The λmax's of M/LWS pigments. (A) The effects of the single amino acid changes S180A, H197Y, Y277F, T285A, and A308S and multiple changes in pigment d, where open and solid circles indicate the ancestral and derived amino acids, respectively. The numbers above indicate the amino acid residues, corresponding to those of human M/LWS pigments, while those on the right show the average λmax's of the ancestral and mutant pigments. (B) The relationship of expected and observed λmax's. Solid and shaded circles indicate the λmax's for dark and difference spectra, respectively.
Knowing the λmax's of all 15 M/LWS pigment types allows us to evaluate directly the actual individual and synergistic effects of amino acid replacements on the λmax shift. By applying a one-way ANOVA to the λmax's of 15 pigments, each having five observations, we first obtained least-squares estimates of the means and their standard errors for λmax of each pigment type. Then, these means were used in an experimental design model to estimate the parameters for each λmax shift caused by individual changes S180A (θ180), H197Y (θ197), Y277F (θ277), T285A (θ285), A308S (θ308), two-way interactions (θ180×197, θ180×277, θ180×285, θ180×308, θ197×285, θ197×308, and θ277×285), and three-way interactions (θ180×277×285 and θ180×197×308) (Table 3).
The effects of amino acid replacements on the λmax shift obtained by Yokoyama and Radlwimmer (2001) and by our mutagenesis method
λmax shift (nm) | ||
|---|---|---|
| Parameter | Yokoyama and Radlwimmer (2001) | Mutagenesis |
| θ180 | −7 ± 1 | −5 ± 0.3 |
| θ197 | −28 ± 1 | −24 ± 0.3 |
| θ277 | −8 ± 1 | −10 ± 0.3 |
| θ285 | −15 ± 1 | −17 ± 0.3 |
| θ308 | −27 ± 1 | −33 ± 0.3 |
| θ180×197 | 11 ± 2 | 2 ± 0.4 |
| θ180×277 | — | 0 ± 0.4 |
| θ180×285 | — | −2 ± 0.4 |
| θ180×308 | ? | 3 ± 0.4 |
| θ197×285 | ? | 3 ± 0.4 |
| θ197×308 | — | 13 ± 0.4 |
| θ277×285 | — | 1 ± 0.4 |
| θ180×277×285 | — | 4 ± 0.6 |
| θ180×197×308 | ? | −4 ± 0.6 |
Some θ's in Yokoyama and Radlwimmer (2001) were close to zero (—) or could not be determined (?).
The estimates of the parameters showed that θ180×277 was essentially zero (−0.2 ± 0.4) and that, by eliminating this interaction from the model, an adequate goodness of fit (
Experimental error for obtaining λmax is often on the order of 1.0 nm. Using this error as the variance of the mean in the estimation procedure, we find that a model without four two-way interactions (θ180×197, θ180×277, θ180×285 and θ277×285, Table 3), which shift the λmax by ≤2.0 nm, describes the data adequately (
Application of the “five-sites” rule:
How well does this “five-sites” rule explain the variable λmax's of currently known M/LWS pigments in Table 2? Using the in vitro assay, the λmax's have been evaluated from two types of absorption spectra: (1) dark spectra, which are measured in the dark, and (2) difference spectra, which are measured by subtracting a spectrum measured after photobleaching from a spectrum evaluated before light exposure (Yokoyama 2000b). We tested the validity of the “five-sites” rule considering dark and difference spectra separately (Table 2). Since the mean λmax evaluated from the dark spectra of the ancestral pigment is 560 nm, the expected λmax's of dark spectra of the 15 pigment types are given by the λmax of the ancestral pigment and appropriate combinations of θ's (column 2, Table 2). The mean λmax of difference spectra of the ancestral pigment is 561 nm, and the expected values of the 14 other pigment types are 1 nm higher than those of the corresponding dark spectra. The expected and observed values are scattered near the central line that shows what would be expected if the model was perfect (Figure 2B). The slopes for the dark and difference spectra do not differ from one another (t = 0.16, P = 0.88) nor do either differ from the expected slope of 1.0 (P = 0.10 and 0.16 for dark and difference spectra, respectively). A goodness-of-fit test for the λmax's of the 15 pigment types resulted in
The statistical rejection of the “five-sites” rule hypothesis in explaining the various λmax's of difference spectra is most likely due to a technical reason. Since difference spectra are based on both dark and light spectra of wavelength absorption, the λmax's measured from them tend to be more error prone than the corresponding values measured from dark spectra alone. In addition, the difference spectra can be evaluated even when we cannot obtain reliable dark spectra (Kawamura and Yokoyama 1998). Indeed, if we exclude two outliers such as human L (P526) and platypus L (P550), the
DISCUSSION
We have seen that the variable λmax's between 510 and 560 nm of currently known M/LWS pigments in vertebrates can be explained fully by the amino acid replacements S180A, H197Y, Y277F, T285A, and A308S and their interactions such as H197Y/A308S, S180A/Y277F/T285A, S180A/A308S, H197Y/T285A, and S180A/H197Y/A308S. In the future, more M/LWS pigments will be characterized and new combinations of amino acid replacements at the five residues may be found. In such cases, the synergistic effects of new amino acid interactions must be evaluated. Hence, the present results on the effects of amino acid interactions in Table 3 are by no means final; in particular, some synergistic effects on the λmax shift may need to be refined. However, we presently understand the molecular basis of spectral tuning in the M/LWS pigments much better than those in the other groups of visual pigments.
At present, not all critical amino acid replacements for RH1, RH2, SWS1, and SWS2 pigments have been identified. For these pigments, it is necessary not only to discover the critical amino acid replacements but also to evaluate their individual and synergistic effects on the λmax shift. For some strongly interacting amino acid changes, currently unknown critical amino acid replacements and their interactions may have to be studied together (Shi et al. 2001). Then again, these analyses have to be performed by using engineered ancestral pigments and their descendants. For the reasons explained here, the molecular bases of spectral tuning in RH1, RH2, SWS1, and SWS2 pigments will be elucidated much more effectively by using the evolutionary approaches than by relying on traditional methods of comparing contemporary pigments. In this respect, whenever amino acid interactions are suspected, mutagenesis analyses of functional differentiations for any proteins should also be performed using ancestral molecules.
Footnotes
Communicating editor: N. Takahata
Acknowledgement
We thank F. B. Radlwimmer, Y. Tao, and R. Yokoyama for comments on the earlier draft and R. Crouch for the 11-cis-retinal. This work was supported by a grant from the National Institutes of Health and Emory University.
References
Davies, N. S., I. J. Sansom, G. L. Albanesi and R. Cespedes,
Ebrey, T. G., and Y. Takahashi,
Sakmar, T. P., R. R. Franke and H. G. Khorana,
Shi, Y., and S. Yokoyama,
Shi, Y., F. B. Radlwimmer and S. Yokoyama,
Sugawara, T., Y. Terai, H. Imai, G. F. Turner, S. Koblmuller et al.,
Sun, H., J. P. Macke and J. Nathans,
Yang, Z.,
Yokoyama, R., and S. Yokoyama,
