


Abstract
The origins of the Asian cultivated rice Oryza sativa from its wild ancestor O. rufipogon have been debated for decades. The question mainly concerns whether it originated monophyletically or polyphyletically. To shed light on the origins and demographic history of rice domestication, we genotyped a total of 92 individual plants from the two O. sativa subspecies and O. rufipogon for 60 microsatellites. An approximate Bayesian method was applied to estimate demographic parameters for O. rufipogon vs. O. sativa ssp. indica and O. rufipogon vs. O. sativa ssp. japonica. We showed that the japonica subspecies suffered a more severe bottleneck than the indica subspecies and thus a greater loss of genetic variation during its domestication. Across microsatellite loci there is a significant positive correlation in the reduction of genetic diversity between the two subspecies. The results suggest that completely independent domestication of indica and japonica subspecies may not explain our data and that there is at least partial sharing of their ancestral populations and/or recent gene flow between them.
AMONG many domesticated crop species, Asian cultivated rice (Oryza sativa L.) is an important staple crop necessary to feed more than half of the world's population. As a model species with completely sequenced genomes of two subspecies, indica and japonica, rice holds a unique position to study questions regarding domestication and the history of genetic diversity in crops. O. sativa was domesticated from the commonly recognized progenitor, common wild rice (CWR) O. rufipogon Griff. (Chang 1976; Oka 1988; Khush 1997; Cheng et al. 2003; Yamanaka et al. 2004). In contrast to the better-known domestication and evolution of modern maize (Doebley 2004), the origin of O. sativa has been an unsolved problem for decades. The long-standing debate concerns whether the Asian cultivated rice originated monophyletically or polyphyletically. The hypothesis of monophyletic origin suggests that wild populations of O. rufipogon could have evolved into the indica subspecies in South and/or Southeast Asia, from which the japonica subspecies evolved through adaptation during spreading to the higher latitudes and elevations (Chang 1976; Oka and Morishima 1982; Oka 1988; Lu et al. 2002). By contrast, the polyphyletic hypothesis postulates that the indica subspecies and the japonica subspecies each originated from different CWR ancestral populations (Kato et al. 1928; Second 1982; Wang et al. 1992; Mochizuki et al. 1993; Doi et al. 2002; Cheng et al. 2003; Yamanaka et al. 2003, 2004; Vitte et al. 2004; Garris et al. 2005; Zhu and Ge 2005; Londo et al. 2006). The different CWR lineages supposed that the indica and japonica diversification had already occurred before their separate domestication and subsequently developed into these two major subspecies (Second 1982; Wang and Sun 1996).
It has long been believed that most domesticated plants have reduced genetic variation in comparison with their wild progenitor species due to bottleneck events (Doebley et al. 2006). Domesticated species usually come from relatively small founder populations, i.e., from a subsample of the wild progenitor population (Eyre-Walker et al. 1998). Such bottleneck events cause a genomewide loss of genetic variation. Another major factor decreasing genetic diversity is artificial selection. This occurs when a trait is favored under selection during the domestication process. Such selection could reduce the amount of polymorphisms in the surrounding regions of the selected target loci. The contributions of these two factors to the patterns of polymorphisms in cultivated species have been well documented in maize (Tenaillon et al. 2004; Wright et al. 2005), but less data are available for rice. Early genetic data showed an apparent loss of genetic diversity in rice during the process of domestication (Sun et al. 2001; Gao et al. 2006; Londo et al. 2006), but a number of questions regarding how selection and bottlenecks shaped the standing patterns of polymorphisms in the two rice subspecies are intriguing but largely unanswered.
In this article, we first inferred the domestication process of the two rice subspecies by using polymorphism data at multiple microsatellites. We then examined the two hypotheses on origins of Asian cultivated rice, focusing on the reduction of genetic diversity in the two rice subspecies at microsatellite loci. If the two subspecies originated from completely different ancient CWR populations, there should be no correlation between loci in the reduction of genetic variation. On the other hand, a strong correlation should be observed if the two subspecies were domesticated from the same founder populations. To test these hypotheses, we genotyped representative samples of two subspecies of cultivated rice and CWR and found a strong positive correlation in the degree of reduction of genetic diversity between the two subspecies.
MATERIALS AND METHODS
Plant materials:
A total of 92 accessions of Asian cultivated rice O. sativa and wild progenitor O. rufipogon were sampled and genotyped. They included 22 accessions of O. sativa ssp. indica, 35 accessions of O. sativa ssp. japonica, and 35 accessions of O. rufipogon. For each accession, one to five individuals were assayed to detect the polymorphisms. The details of the studied accessions (accession name, accession number, and geographical origins) are described elsewhere (Gao et al. 2005).
Genomic DNA extraction and microsatellite genotyping:
Five loci for each chromosome were selected, totaling 60 primer pairs that are randomly distributed throughout the rice genome (Akagi et al. 1996; Panaud et al. 1996; Chen et al. 1997). These are also displayed on the Cornell University Rice Genes web site (http://www.gramene.org/microsat/). Microsatellite polymorphisms were assayed by specific PCR conditions (Panaud et al. 1996). PCR products were run on 6% polyacrylamide denaturing gels. Marker bands were detected using the silver staining methods (Panaud et al. 1996). The null alleles were confirmed after several repetitions with different amplification conditions to ensure that no reaction failure existed. To determine the allele size, the samples were directly compared with band sizes from an allelic ladder prepared by the amplification of an artificial mixture of DNA from all the assayed samples.
Diversity analysis:
In a total of 60 assayed microsatellites, the 46 dinucleotide microsatellites were used in data analysis; the other 14 microsatellites were excluded because they are microsatellites with either more than two repeats or other motif-complicated repeats. The level of microsatellite variation was measured as the expected average heterozygosity (H) (Table 1). For the typical selfers, H was defined as the probability that randomly chosen alleles from different individuals are not identical. Wright's F-statistics were also estimated from the excess of homozygous individuals conditional on the estimates of H (Wright 1965). The average H's for O. rufipogon, O. sativa ssp. indica, and O. sativa ssp. japonica are denoted by HW,obs, HI,obs, and HJ,obs, respectively.
Genetic relationship tree:
We used data from all 60 microsatellite loci to construct a tree representing genetic relationships (Figure 1A). Cavalli-Sforza and Edwards (C.S.) genetic distances were estimated by using chord distance (Cavalli-Sforza and Edwards 1967), which was shown to generate correct tree topologies regardless of the microsatellite mutation model (Takezaki and Nei 1996). Phylogenetic reconstruction was based on the neighbor-joining method implemented in PowerMarker version 2.7 (Liu and Muse 2004). Using NEIGHBOR in the PHYLIP computer package (version 3.5c) (Felsenstein 1995), we constructed an unrooted neighbor-joining (NJ) tree (Figure 1A). The robustness was assessed by creating 999 bootstrap replicates of the data set with the SEQBOOT algorithm in PHYLIP and then generating a majority-rule consensus tree in the CONSENSE program. These distance trees were viewed by the program TREEVIEW (Page 1996).
Population structure:
Population structure among O. sativa and O. rufipogon accessions was evaluated with the model-based program STRUCTURE 2.1 (Pritchard et al. 2000). The analysis had a burn-in length of 50,000 iterations and a run length of 100,000 iterations. The correlated allele-frequency model was used with asymmetric admixture allowed. The highest log-likelihood scores were obtained when the number of populations was set at three. Five independent runs yielded consistent results. The result is presented in Figure 1B.
Demographic model:
The population model of domestication used here (Figure 2) is similar to those in previous studies (Innan and Kim 2004; Wright et al. 2005). The model approximates the demography of a domestication event of a single cultivated species from its wild progenitor. In this study, the model was used for analyzing jointly CWR and O. sativa ssp. indica and for analyzing jointly CWR and O. sativa ssp. japonica, respectively. It is assumed that the wild progenitor species has a constant-size population with size N0. The domestication begins at time Td in a small founder population of the cultivated species, which is merely a subset of the members in the wild progenitor. The domestication is assumed to have occurred in this constant-size founder population with size N1. Usually, N1 could be much smaller than N0. When the domestication is complete at time Te, it is assumed that the population size changes to N2, which is generally much larger than N1, representing a rapid population expansion of the domesticated species. Let T1 be the length of time when the population size is N1; therefore T1 = Td – Te (Figure 2). Thus, this simple domestication model includes five demographic parameters. Although O. rufipogon is a perennial species, we assume that the generation time is 1 year for this wild progenitor like the annual cultivated rice, because it is able to reproduce one generation each year.
Simulating microsatellite polymorphisms:
Under the population model described above, patterns of microsatellite variation in the two species (one cultivar and its progenitor) were simulated. Since cultivated rice is highly selfing, we employed the coalescent simulation algorithm of Nordborg and Donnelly (1997) to construct a random genealogy with diploid sample size n. On a simulated genealogy from two subpopulations with the shared ancestral population (Figure 2), random mutations were placed and the changes of repeat numbers at microsatellites were simulated. To approximate the mutation process in microsatellites, we used a generalized stepwise model, under which the change of the number of microsatellite repeats follows a symmetric geometric distribution with a parameter q (Goldstein et al. 1995; Slatkin 1995; Pritchard et al. 1999). When q = 0, the model is essentially the same as the infinite-allele model (IAM) (Kimura and Crow 1964), while when q = 1, the model is identical to the strict stepwise mutation model (SMM) (Ohta and Kimura 1973). In this study, we considered five models with q = 1, 0.9, 0.8, 0.5, and 0, but we mainly show the results for q = 0.8 throughout this article because the results under the five models are very similar (the results for q = 1, 0.9, 0.5, and 0 are shown in supplemental Figure 1). Our choice of q = 0.8 is roughly in agreement with estimates from maize (Vigouroux et al. 2005) and humans (Pritchard et al. 1999).
Rejection-sampling algorithm for estimating demographic parameters:
We employed a rejection-sampling algorithm to obtain estimates of the demographic parameters in the above-described model. Since the initial work by Tavaré et al. (1997), rejection-sampling algorithms have been extensively used in population genetics (Weiss and Haeseler 1998; Pritchard et al. 1999; Beaumont et al. 2002). Recently, Wright et al. (2005) developed a rejection-sampling algorithm for a demographic model that is essentially the same as Figure 2 and applied it to nucleotide polymorphism data in maize and its wild progenitor. We basically followed their algorithm, but with modifications as below. Because evaluating the full likelihood of multiple microsatellites may be computationally infeasible at present to the best of our knowledge, we summarized the data by two statistics, the average heterozygosity in wild (HW) and the average heterozygosity in cultivated rice (HC), which could be either HI or HJ for the analysis of the indica and japonica subspecies, respectively.
The procedure of our rejection-sampling algorithm to obtain a sample from the joint posterior distribution of the five demographic parameters is described with example parameters. We will change those to check their robustness later.
Simulate the five demographic parameters (Td, Te, N0, N1, N2) and the mutation rate of microsatellites from the prior distributions. Since most domestication events occurred ∼5000–10,000 years ago (Smith 2001), a uniform distribution between 5000 and 10,000 is adopted for the prior distribution of Td. Once Td is determined, Te is assumed to be a random variable between 0 and Td. For N0, the level of nucleotide diversity in O. rufipogon is roughly one-third of that in teosintes (Clark et al. 2004; Miyashita 2005), so N0 of the wild progenitor of rice may be ∼300,000 given that N2 for wild teosinte may be ∼900,000–1,000,000 (Eyre-Walker et al. 1998). Therefore, we used a lognormal distribution with mean 3 × 10⁵ and SD 0.6 × 10⁵ for the prior distribution of N0 so that the 95% interval is approximately between 2 × 10⁵ and 4.4 × 10⁵. As it may be very difficult to estimate the current effective population size for cultivars, we used a rather diffuse prior distribution for N2, namely, a lognormal distribution with mean 3 × 10⁵ and SD 1.5 × 10⁵ (the 95% interval is approximately between 1 × 10⁵ and 7 × 10⁵). Since little prior information is known for N1, a uniform distribution between 0 and 30,000 is assumed for the prior distribution of N1. For the mutation rate (u), we used a uniform distribution from 0 to 2 × 10⁴ when q = 0.8.
Simulate 46 random independent genealogies with the algorithm for partial selfers (Nordborg and Donnelly 1997). The diploid sample sizes of the two species at 46 loci follow those in the observed data (Table 1). The effect of inbreeding is plugged in using estimates of Wright's F-statistic in our data (F = 0.95 and 0.65 for O. sativa and O. rufipogon, respectively).
Place random mutations and simulate patterns of microsatellite polymorphisms. To incorporate the variation in mutation rate across loci, the mutation rate at each locus is assumed to follow a Gamma distribution with mean u (determined at step 1) and SD 0.7 × u. With our prior simulations, it was found that this amount of SD roughly explains the variation in H across loci in the observed data of O. rufipogon (Table 1) for a wide range of u.
Calculate the average HW and HC for the simulated polymorphisms at 46 independent microsatellite loci.
Keep the parameters if
\(\left|H_{\mathrm{W}}{-}H_{\mathrm{W,obs}}\right|{<}\mathrm{{\varepsilon}}\sqrt{H_{\mathrm{W,obs}}(1{-}H_{\mathrm{W,obs}})}\)and\(\left|H_{\mathrm{C}}{-}H_{\mathrm{C,obs}}\right|{<}\mathrm{{\varepsilon}}\sqrt{H_{\mathrm{C,obs}}(1{-}H_{\mathrm{C,obs}})}\); otherwise discard the parameters and go to step 1.
This procedure produces a sample from the joint posterior distribution of the parameters conditional on HW and HC. We applied this procedure to the pairs of O. sativa ssp. indica vs. O. rufipogon and O. sativa ssp. japonica vs. O. rufipogon under the five microsatellite mutation models with q = 1, 0.9, 0.8, 0.5, and 0. For each case, at least 5000 accepted sets of parameters were collected. We set
Testing for selection:
RESULTS
The gene diversity of the two rice subspecies and O. rufipogon is summarized in Table 1. At 44 loci of the 46 dinucleotide microsatellite loci studies, the wild progenitor O. rufipogon possessed higher diversity (H) than either of the two rice subspecies. The indica and japonica rice subspecies have ∼70.8 and 62.1%, respectively, of the microsatellite diversity found in their wild progenitor, and the indica subspecies has higher diversity than the japonica subspecies at 37 of the loci. When the indica and japonica subspecies are pooled, the cultivars have 77.0% of diversity in comparison to the wild progenitor.
Genetic diversity estimates and sample size of O. sativa ssp. indica, O. sativa ssp. japonica, and O. rufipogon for each of the 46 dinucleotide microsatellite loci studied
O. sativa ssp. indica | O. sativa ssp. japonica | O. rufipogon | |||||||||
|---|---|---|---|---|---|---|---|---|---|---|---|
| Locus | na | Ab | Hc | Pd | na | Ab | Hc | Pd | na | Ab | Hc |
| RM212 | 16 | 3 | 0.575 | 0.074 | 28 | 3 | 0.203704 | 0.0229 | 25 | 16 | 0.933333 |
| OSR23 | 16 | 2 | 0.458333 | 0.0633 | 28 | 4 | 0.325397 | 0.1025 | 25 | 9 | 0.886667 |
| RM200 | 16 | 11 | 0.916667 | 0.9639 | 28 | 13 | 0.88955 | 0.9913 | 24 | 19 | 0.943841 |
| RM211 | 16 | 3 | 0.575 | 0.1627 | 28 | 2 | 0.137566 | 0.0388 | 25 | 11 | 0.878333 |
| OSR11 | 16 | 4 | 0.658333 | 0.1017 | 28 | 7 | 0.539683 | 0.1243 | 26 | 19 | 0.953077 |
| RM263 | 15 | 9 | 0.933333 | 0.9776 | 26 | 5 | 0.698462 | 0.4324 | 24 | 14 | 0.952899 |
| OSR8 | 16 | 5 | 0.75 | 0.3841 | 26 | 6 | 0.609231 | 0.3428 | 23 | 15 | 0.927866 |
| RM233A | 15 | 5 | 0.809524 | 0.6867 | 25 | 6 | 0.683333 | 0.5947 | 25 | 13 | 0.9125 |
| RM55 | 16 | 4 | 0.6 | 0.0961 | 28 | 4 | 0.558201 | 0.2406 | 25 | 19 | 0.930833 |
| RM232 | 14 | 5 | 0.769231 | 0.6029 | 25 | 6 | 0.81 | 0.9539 | 23 | 11 | 0.894269 |
| RM231 | 14 | 7 | 0.879121 | 0.8595 | 25 | 7 | 0.786667 | 0.8015 | 25 | 15 | 0.938333 |
| RM255 | 14 | 4 | 0.659341 | 0.2845 | 28 | 7 | 0.687831 | 0.7009 | 24 | 11 | 0.887681 |
| RM252 | 16 | 6 | 0.825 | 0.8417 | 27 | 5 | 0.578348 | 0.4165 | 24 | 10 | 0.882246 |
| RM261 | 16 | 7 | 0.75 | 0.3041 | 28 | 5 | 0.380952 | 0.0587 | 26 | 14 | 0.944615 |
| RM241 | 16 | 7 | 0.841667 | 0.4651 | 28 | 9 | 0.769841 | 0.5249 | 24 | 19 | 0.97192 |
| OSR15 | 16 | 2 | 0.458333 | 0.0657 | 28 | 5 | 0.383598 | 0.1439 | 26 | 13 | 0.885385 |
| RM233B | 16 | 4 | 0.775 | 0.6624 | 28 | 3 | 0.26455 | 0.0821 | 23 | 10 | 0.881423 |
| RM26 | 15 | 3 | 0.647619 | 0.2347 | 28 | 3 | 0.140212 | 0.0307 | 25 | 13 | 0.896667 |
| RM249 | 14 | 12 | 0.950549 | 0.9773 | 23 | 21 | 0.932806 | 0.997 | 26 | 21 | 0.967692 |
| RM164 | 14 | 7 | 0.89011 | 0.9559 | 28 | 8 | 0.722222 | 0.7285 | 23 | 11 | 0.907115 |
| RM225 | 16 | 8 | 0.891667 | 0.9047 | 27 | 11 | 0.891738 | 0.9957 | 24 | 13 | 0.941123 |
| OSR21 | 15 | 2 | 0.47619 | 0.0589 | 23 | 3 | 0.490119 | 0.2313 | 23 | 12 | 0.899209 |
| OSR19 | 16 | 4 | 0.691667 | 0.7322 | 26 | 6 | 0.670769 | 0.8859 | 25 | 5 | 0.723333 |
| OSR25 | 16 | 1 | 0 | 0.1178 | 28 | 1 | 0 | 0.2129 | 22 | 2 | 0.482684 |
| RM253 | 16 | 7 | 0.816667 | 0.6273 | 27 | 9 | 0.843305 | 0.9576 | 24 | 15 | 0.932971 |
| RM234 | 15 | 4 | 0.619048 | 0.0587 | 28 | 6 | 0.57672 | 0.1657 | 25 | 19 | 0.9575 |
| RM47 | 16 | 2 | 0.125 | 0.0042 | 28 | 4 | 0.140212 | 0.0301 | 25 | 11 | 0.891667 |
| RM248 | 14 | 8 | 0.895604 | 0.8361 | 27 | 6 | 0.692308 | 0.3545 | 24 | 20 | 0.961051 |
| OSR22 | 16 | 3 | 0.675 | 0.2073 | 28 | 6 | 0.615079 | 0.373 | 25 | 14 | 0.925 |
| OSR07 | 16 | 4 | 0.691667 | 0.2763 | 27 | 5 | 0.492877 | 0.1935 | 25 | 17 | 0.915833 |
| RM25 | 16 | 7 | 0.7875 | 0.6328 | 28 | 5 | 0.674603 | 0.6035 | 26 | 10 | 0.904615 |
| RM223 | 16 | 8 | 0.891667 | 0.9464 | 27 | 8 | 0.786325 | 0.8571 | 23 | 12 | 0.922925 |
| RM215 | 16 | 6 | 0.675 | 0.2811 | 28 | 7 | 0.809524 | 0.9535 | 26 | 11 | 0.897692 |
| RM245 | 14 | 5 | 0.752747 | 0.6522 | 27 | 3 | 0.145299 | 0.0585 | 26 | 8 | 0.855385 |
| RM242 | 15 | 4 | 0.761905 | 0.9561 | 28 | 5 | 0.637566 | 0.8937 | 26 | 7 | 0.621538 |
| RM244 | 16 | 4 | 0.591667 | 0.4223 | 27 | 4 | 0.430199 | 0.3579 | 20 | 7 | 0.743421 |
| RM222 | 15 | 5 | 0.790476 | 0.6811 | 26 | 13 | 0.910769 | 0.9998 | 26 | 10 | 0.894615 |
| RM258 | 16 | 6 | 0.833333 | 0.7131 | 28 | 4 | 0.267196 | 0.038 | 26 | 14 | 0.929231 |
| RM228 | 14 | 5 | 0.824176 | 0.6481 | 27 | 8 | 0.680912 | 0.4942 | 26 | 18 | 0.933846 |
| RM202 | 16 | 7 | 0.879167 | 0.8201 | 28 | 7 | 0.780423 | 0.7226 | 24 | 16 | 0.951087 |
| RM206 | 13 | 9 | 0.935897 | 0.9894 | 23 | 10 | 0.873518 | 0.9838 | 26 | 16 | 0.930769 |
| RM167 | 16 | 4 | 0.516667 | 0.0433 | 27 | 8 | 0.783476 | 0.8162 | 25 | 12 | 0.933333 |
| RM224 | 16 | 6 | 0.85 | 0.9904 | 23 | 4 | 0.644269 | 0.8075 | 24 | 8 | 0.752717 |
| RM235 | 16 | 10 | 0.9 | 0.9978 | 25 | 7 | 0.806667 | 0.9869 | 26 | 11 | 0.822308 |
| OSR20 | 16 | 6 | 0.816667 | 0.5943 | 26 | 8 | 0.874615 | 0.9829 | 25 | 14 | 0.938333 |
| RM247 | 16 | 4 | 0.575 | 0.0489 | 25 | 9 | 0.82 | 0.8591 | 25 | 18 | 0.948333 |
Sample size.
Observed numbers of alleles.
Heterozygosity.
Probability values for the test of neutrality.
A genetic relationship tree of 70 individuals was constructed using C.S. chord distances (Figure 1A). In addition to a clear separation of the CWR, most accessions were classified into either the indica or the japonica group with high bootstrap support. However, two japonica varieties fell within the indica cluster, while five indica varieties were included within the japonica cluster. To further determine genetic differentiation and population structure among rice groups, we applied the Bayesian clustering program STRUCTURE to analyze microsatellite data. The highest log-likelihood scores were obtained when the number of populations was set at three, and the result is shown in Figure 1B. Most CWR accessions were classified into one group, while the accessions of cultivated rice could not be clearly assigned to either the indica or the japonica population. The observation was consistent with the incomplete clustering pattern based on genetic distance (Figure 1A).
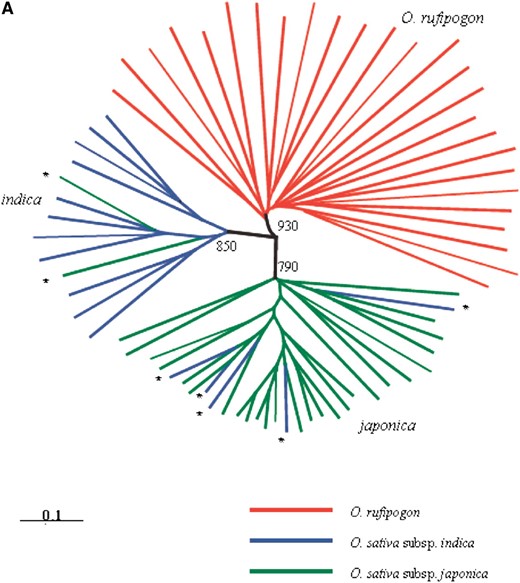
(A) Unrooted neighbor-joining tree based on C.S. chord distance using 46 nuclear microsatellites. The admixed varieties are indicated with an asterisk. Bootstrap support values are shown. (B) Estimated population structure for 70 accessions of O. sativa and O. rufipogon from 46 microsatellite loci. Horizontal bars along the vertical axis represent each accession. For all the analyzed accessions, the proportion of ancestry under K = 3 clusters that can be attributed to each cluster is given by the length of each colored segment in a bar.
Our result from the STRUCTURE analysis seems different from that of Caicedo et al.'s large-scale single-nucleotide polymorphism (SNP) data (Caicedo et al. 2007), where indica and japonica clearly cluster as distinct groups. One of the potential reasons would be that our sample includes some morphologically “intermediate” strains, for example, those whose characteristics are generally consistent with indica but some minor characteristics are similar to japonica. Another reason could be a lack of the power to classify the two subspecies in our data from microsatellites, at which independent mutations can occasionally create the same allele, thereby obscuring the population differentiation. More importantly, the number of loci used in our study is much smaller than that of Caicedo et al. (2007). Here, it is important to note that the clear clustering of indica and japonica in Caicedo et al.'s (2007) data does not necessarily mean that the domestication processes of the two subspecies were completely independent, as Caicedo et al. (2007) concluded (see also our analysis below).
To infer the bottleneck effect on cultivated rice, we used a two-subpopulation model, which approximates a domestication event of a cultivated species from its wild progenitor (Figure 2). We applied this model to O. rufipogon vs. O. sativa ssp. indica and O. rufipogon vs. O. sativa ssp. japonica for separately estimating the above-mentioned five demographic parameters (N2, N1, N0, Td, and Te) plus the mutation rate (μ), using the diversity data for the dinucleotide microsatellites. Figure 3 shows the obtained posterior distributions. Overall the distributions of N0, N2, and μ for the two analyses are very similar (Figure 3). This is because the estimation of these parameters depends largely on the observation in O. rufipogon and may not reflect that in the cultivated rice. The posterior distributions of N0 and N2 are very similar to the prior distributions, indicating that these parameters are inestimable. Rather, we can obtain the information on the product of the population size and the mutation rate, which is the most important factor to determine the amount of polymorphism. As shown in Figure 3, D and I, the joint distributions are around the line N2 ×
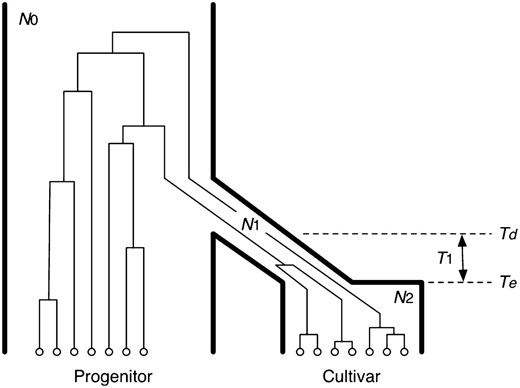
The demographic model and parameters used in this study. A typical genealogy of samples from the progenitor and cultivar populations (species) is also illustrated. The underlying model was used twice: CWR vs. O. sativa ssp. indica and CWR vs. O. sativa ssp. japonica. See text for details.
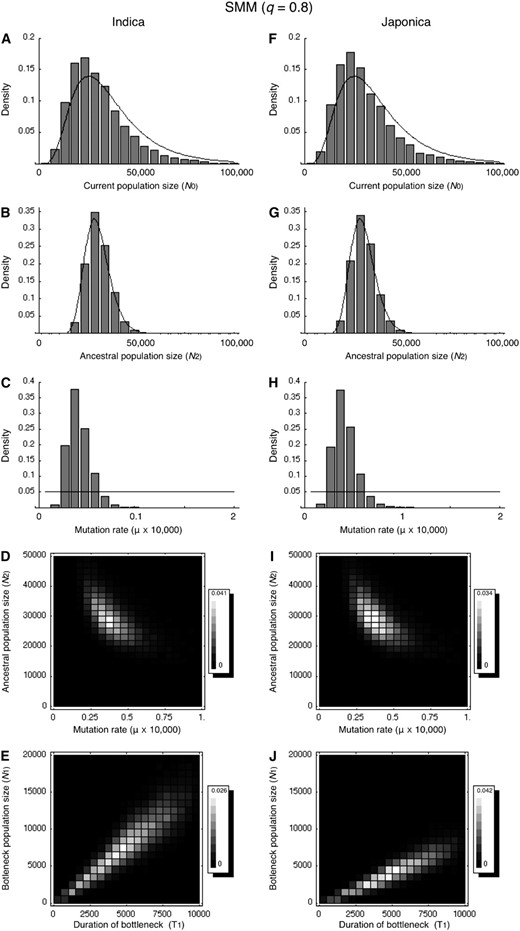
The posterior distributions of the demographic and mutation parameters when q = 0.8. The results for the CWR vs. indica analysis are shown in A–E and those for the CRW vs. japonica analysis are in F–J. (A–C and F–H) The posterior distributions are shown by bars, while the priors are shown by lines. The prior distributions are as described in materials and methods. (D, E, I, and J) Two-dimensional posterior distributions, in which the gray scale represents the density as indicated on the right. The results for the other four q values are shown in supplemental Figure 1.
Among these five parameters, we are primarily interested in the effective size of the founder population during the bottleneck (N1) as well as its duration (T1). Figure 3, D and I, shows the joint posterior distributions of pairs of N1 and T1. For O. rufipogon vs. O. sativa ssp. indica, N1 and T1 have a distribution along the line N1 = 1.5 × T1, while the O. rufipogon vs. O. sativa ssp. japonica analysis produced the posterior distribution of N1 and T1 along the line N1 = 0.9 × T1. The results indicate that the japonica subspecies experienced a more severe bottleneck than the indica subspecies, in agreement with the lower genetic diversity in the japonica subspecies. We further estimated the bottleneck severity (k), which is the ratio of the size of the founder population during the domestication (N1) to the duration of the bottleneck (T1). A smaller k was observed for the japonica subspecies (k = 0.9) than for the indica subspecies (k = 1.5), suggesting the japonica subspecies has suffered a severer bottleneck than the indica subspecies.
Artificial selection could create a local reduction in polymorphism. To evaluate this effect, we searched for outlier loci with lower genetic variation than the average in cultivated rice. We tested the neutrality for each locus focusing on Δ, the ratio of the diversity in the cultivar to that of the wild progenitor. Here, the estimated demographic models were used as null models for testing the neutral null hypothesis (see materials and methods). The P-value for each locus was obtained from coalescent simulations and the result is summarized in Table 1. There are several loci with P-values <0.05; that is, the null model cannot explain the observed reduction of H in the cultivated rice at the 5% level. In total, three (RM47, RM167, and RM247) microsatellites in the indica subspecies and five (RM212, RM211, RM26, RM47, and RM258) in the japonica subspecies have P < 0.05. RM47 is found to be an outlier in both subspecies, while the other microsatellites are outliers only in the indica or the japonica subspecies. The number of loci with P < 0.05 is slightly higher than the expected numbers (0.05 × 46 = 2.3), but not significant.
Although only the results for q = 0.8 are given here, almost identical results were obtained for the other four mutation models (q = 1, 0.9, 0.5, and 0). As shown in supplemental Figure 1, the posterior distributions of N0, N1, N2, and T1 for the five different values of q are very similar, although the mutation rate depends on the mutation model. As a consequence, it is not surprising that the results of the neutrality test (P-values for each locus) are in excellent agreement with one another as shown in supplemental Figure 2, A and B. The P-values for q = 1, 0.9, 0.5, and 0 (plotted on the vertical axis) in almost all loci are very similar to those for q = 0.8 (plotted on the vertical axis).
Furthermore, such robustness is also observed when the prior distributions are changed. We repeated the same rejection-sampling procedure with wider posterior distributions of N0 and N2. We assumed that both distributions follow a lognormal distribution with mean 3 × 10⁵ and SD 2 × 10⁵ (the 95% interval is approximately between 0.75 × 10⁵ and 8 × 10⁵). This analysis gave similar results for the estimates of the population mutation rates and the severity of bottleneck (data not shown) and also the results of the neutrality tests (supplemental Figure 2, C and D). At almost all loci, the P-values for the five values of q (plotted on the vertical axis) with the wider priors are very similar to those for q = 0.8 with the narrower priors in materials and methods (i.e., the P-values in Table 1, plotted on the vertical axis in supplemental Figure 2, C and D). It indicates that our analysis is quite robust to mutational models and to the choice of prior distributions of the parameters.
One drawback in our analysis incorporating the uncertainty in the inference of demography is that it might unnecessarily lose the power to detect selection because the real population experienced only one demographic history. To check this effect, we repeated the selection test in which demography was fixed to a single parameter set. The parameter set was chosen on the basis of the posterior distributions (Figure 3) such that it explains the genomewide reduction in genetic variation in the two subspecies. Namely, the ancestral population size is N0 = 300,000. At time Td = 7500, two independent founder populations were formed, and their sizes increased to 300,000 at time Te = 5000. We assumed that the sizes of the two founder populations are 3750 and 2250 for the indica and japonica subspecies, respectively. We found that this setting produced almost identical P-values for all loci (not shown). Similar results were also obtained with other possible sets of parameters.
A more interesting observation in our results is that there is a strong positive correlation between the P-values for the two subspecies with a correlation coefficient of 0.59 (Figure 4A). To test whether this observed correlation coefficient can be explained under a neutral model of two independent domestication events, additional coalescent simulations were performed. We used the fixed setting of the demographic parameters as described above. In each replication, microsatellite polymorphisms at 46 independent loci were simulated (see materials and methods) and the correlation coefficient for the simulated data was computed. The distribution of the correlation coefficient for the simulated data suggests that the observed correlation coefficient cannot be explained under this simple independent domestication model (P < 0.001, Figure 4B). Simulations with other parameter sets gave very similar results (not shown).
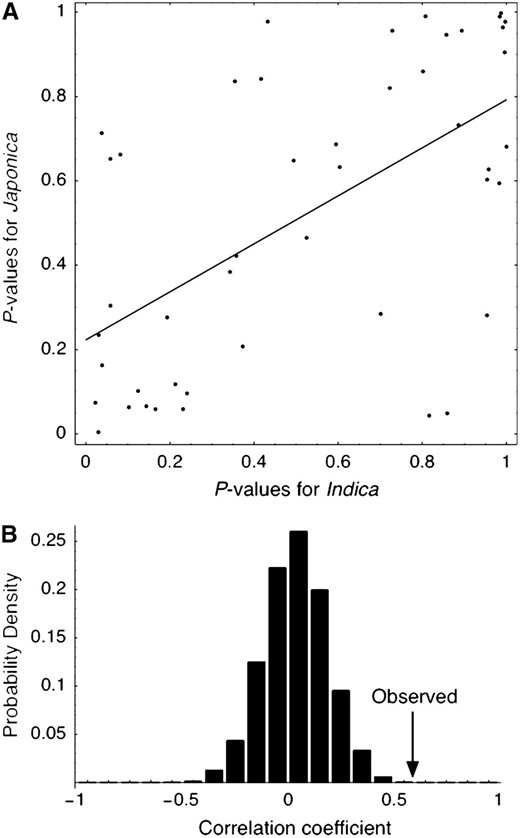
(A) Joint distribution of the P-values for the CWR vs. indica analysis and CWR vs. japonica analysis. The P-values are from Table 1 (i.e., q = 0.8 with the priors in materials and methods). The P-values from the two analyses are highly correlated (r = 0.59). (B) The null distribution of the correlation coefficient (r) under a neutral model of independent domestication. See text for details.
To demonstrate that a positive correlation of the P-values is indeed created when the bottleneck population is shared, sets of similar simulations were further performed using the model illustrated in Figure 5A. The model considers a single bottleneck population with size NDMC between time Td and TDMC. At time TDMC, the indica and japonica subspecies were split into the indica and japonica populations (subspecies) with sizes
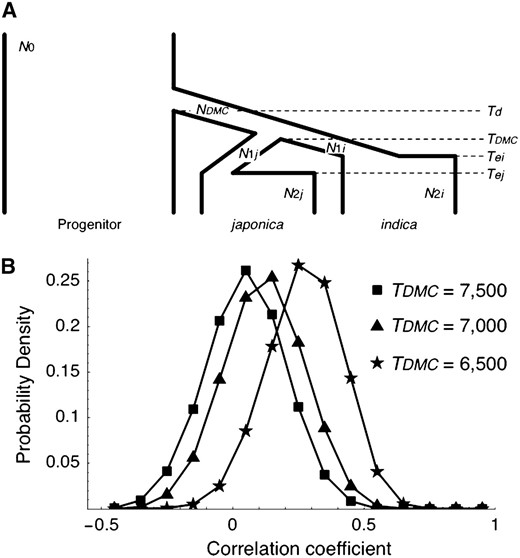
Effect of bottleneck sharing (nonindependent domestication) on the correlation coefficient (r) between the P-values for the CWR vs. indica analysis and CWR vs. japonica analysis. (A) Illustration of the model of bottleneck sharing used in our simulation. (B) Distribution of the correlation coefficient (r) when TDMC = 7500, 7000, and 6500. See text for the other parameters.
DISCUSSION
Maize has long been an excellent model for studying the domestication of cultivated plants (Doebley 2004; Tenaillon et al. 2004; Wright et al. 2005). It represents a simple domestication model of “one wild progenitor–one crop group”, but the situations for the majority of cultivated plants may be more complicated, including the rice domestication that resulted in two subspecies, indica and japonica, from the wild taxon, O. rufipogon. The finding that the japonica subspecies has experienced a more severe loss of genetic variation during domestication than the indica subspecies is in agreement with published empirical data, which demonstrated that the indica subspecies is more genetically diverse than the japonica subspecies (Second 1982; Lu et al. 2002; Garris et al. 2005). Our results suggest a smaller founder wild population of the japonica subspecies than that of the indica subspecies and/or a longer bottleneck (i.e., T1 in Figure 3), assuming that the effect of selection reducing polymorphisms is much smaller than the founder effect (Wright et al. 2005). In comparison, a larger estimated k in maize (k = 2.45) (Wright et al. 2005) than that in rice (k = 0.9 for the japonica subspecies and k = 1.5 for the indica subspecies) indicates that different crops might have experienced a variable severity of domestication bottleneck during their different population histories. The finding seems consistent with a less serious relative loss of genetic diversity in maize (Δ = 0.88) (Vigouroux et al. 2005) than that in rice (Δ = 0.77 when the indica and japonica subspecies are pooled) based on the estimate of dinucleotide microsatellite diversity.
The two mechanisms, demography and selection, that remove genetic variation during domestication differ in that the effects of selection should be limited to the surrounding region of the target genes of selection while demographic history affects genetic variation in a similar way throughout the whole genome. Therefore, it is predicted that microsatellites closely linked to loci that were subject to artificial selection will have low diversity in cultivated species (Wang et al. 1999; Innan and Kim 2004). The results of our neutrality test applied to each locus found three loci with P < 0.05 in the indica and five in the japonica subspecies. These numbers are not significantly higher than those expected under neutrality, suggesting probably only a weak effect of selection on the genome as a whole. This result seems in agreement with the findings in maize, in which only 2–4% of 774 genes suggest the effects of artificial selection (Wright et al. 2005). However, the power to detect signatures of artificial selection may be limited if selective sweeps are from standing variation (Innan and Kim 2004).
The variation in Δ across microsatellite loci also relates to the unsettled controversy about origins of Asian cultivated rice. The hypothesis of independent origins of Asian cultivated CWR that the indica and japonica subspecies originated from different wild populations of their progenitor is supported by insertion patterns of SINEs (Yamanaka et al. 2003, 2004), LTR retrotransposons (Vitte et al. 2004), and MITEs (Zhu and Ge 2005), as well as polymorphisms of intron sequences (Zhu and Ge 2005). These data indicated that the two subspecies shared more polymorphisms with different accessions of CWR than with each other, making this hypothesis become dominant. Recently, phylogeographic analysis of three distinct gene regions further supports that O. sativa was domesticated from CWR at least twice, in at least two different geographic regions in eastern Asia (Londo et al. 2006). This argument is not conclusive because these differences between the indica and the japonica subspecies may be explained by ancestral polymorphism in the CWR so that we cannot exclude a monophyletic origin and that subsequent development of the two subspecies occurred after domestication (Chang 1976; Oka and Morishima 1982; Oka 1988; Lu et al. 2002). As shown in Figure 4, the significant correlation between the two subspecies disagrees with the independent hypothesis (P < 0.001), suggesting that the model of completely independent domestication of the indica and japonica subspecies may be rejected and that they at least partially shared their ancestral populations. Our simulation results shown in Figure 5 demonstrated that there should be quite an amount of sharing of genetic information, which could be explained by the bottleneck sharing and/or gene flow between the indica and japonica subspecies.
Strictly speaking, however, the argument holds under neutrality. Artificial selection could potentially create a positive correlation. It is worth noting that some traits are frequently observed in cultivated crops, such as grain shattering, seed dormancy, synchronization of seed maturation, decrease in tiller number and branches, and increase in inflorescence and seed sizes (Harlan 1975; Hancock 2004; Li et al. 2006). These loci responsible for such phenotypes may be likely targets of artificial selection (Paterson et al. 1995). Sweeney et al. (2007) recently showed strong evidence that a selected allele has originated in the japonica subspecies and then spread to the japonica varieties. It is suggested that the domestication process is still underway and the two subspecies could share genetic variation and selection. Thus, if the two subspecies share selective pressure in the same direction, even under the independent domestication scenario, we could observe a positive correlation. To exclude this effect, we reanalyzed the correlation in the P-values by removing loci with P < 0.05 for both of the two subspecies. The correlation coefficient was 0.57, still highly significant (P < 0.001). Furthermore, to be very conservative, we removed loci with P < 0.2 for both and found the significance still remained even though the correlation coefficient was reduced (r = 0.43, P = 0.004). These results suggest that the effect of artificial selection on the observed positive correlation should be small especially when our data are from nongenic regions (i.e., microsatellites).
In addition, selection could work in only one of the two subspecies, which should have contributed to the differences between the indica and japonica subspecies. Asian cultivated rice is widely planted throughout the world under extremely diversified socioeconomic, cultural, and geographic conditions. The deep-seated human food preference under divergently cultural societies put cultivars of the two subspecies under extensively strong artificial selection (Gao 2003). This scenario might well explain one of the investigated loci. At RM258, for example, Δ is quite low in the japonica subspecies (P = 0.038) but high for the indica subspecies (P = 0.7131). This microsatellite is closely linked with Rf-1 (only ∼29 bp downstream) on chromosome 10, a gene controlling cytoplasmic male sterility in rice (Shinjyo 1975; Akagi et al. 1995; Yu et al. 1995; Wang et al. 2006). Most indica varieties have the dominant allele Rf-1, but the typical japonica subspecies carries the nonrestoring allele rf-1 (Shinjyo 1975; Zhu 2000). Therefore, our observation at RM258 may be well explained by the japonica-specific selection at Rf-1.
Thus, this article presents an analysis supporting the nonindependent domestication more than the popularly recognized independent hypothesis of Asian cultivated rice. Our analysis rejected a strict independent domestication model. These results can be understood with at least two factors: (i) the founder populations of indica and japonica were at least partly shared and (ii) there was substantial gene flow between indica and japonica after domestication. Our results are consistent with the recent analysis of SNP data. Caicedo et al. (2007) demonstrated that demographic models with recent gene flow explain their large-scale SNP data better than those without gene flow, and Sweeney et al. (2007) provided direct evidence for recent gene flow. At this moment, it may be difficult to distinguish these two factors or to elucidate their relative contributions. More SNP data from the rice genomes would provide further opportunities to better understand origins and domestication of Asian cultivated rice.
Footnotes
These authors contributed equally to this article.
Footnotes
Communicating editor: D. Charlesworth
Acknowledgement
We thank D. Charlesworth and two anonymous reviewers for valuable comments and suggestions, which improved this work substantially. We thank Dao-yuan Li of the Institute of Crop Germplasm Resources, Guangxi Academy of Agricultural Sciences; Da-jian Pan of Guangdong Rice Research Institute, Guangdong Academy of Agricultural Sciences; Zong-en Qiu and Han-hua Pang of the Institute of Crop Germplasm Resources, Chinese Academy of Agricultural Sciences; and Yi-ping Wang of the China Rice Research Institute for providing wild and cultivated rice materials. This research was funded by the International Foundation for Sciences (C/2738-1, 2), the 1999 Vavilov–Frankel Fellowship from the International Plant Genetic Resources Institute, the China National Science Foundation (39800013), the Hundreds of Talents Program of the Chinese Academy of Sciences, and a grant from the Chinese Department of Science and Technology (973 Program 2007CB815701) to L.-z.G. H.I. was supported by grants from the University of Texas (Houston), the Graduate University for Advanced Studies, Japan Society for the Promotion of Science, and the National Science Foundation.
References
Cavalli-Sforza, L. L., and A. W. F. Edwards,
Chang, T. T.,
Chen, X., S. Temnykh, Y. Xu, Y. G. Cho and S. R. Mccouch,
Clark, R. M., E. Linton, J. Messing and J. F. Doebley,
Doi, K., K. Sobrizal, K. Ikeda, P. L. Sanchez, T. Kurakazu et al.,
Eyre-Walker, A., R. L. Gaut, H. Hilton, D. L. Feldman and B. S. Gaut,
Felsenstein, J.,
Gao, L. Z.,
Gao, L. Z., C. H. Zhang, J. Z. Jia and Y. S. Dong,
Gao, L. Z., C. H. Zhang, D. Y. Li, D. J. Pan, J. Z. Jia et al.,
Hancock, J. F.,
Innan, H., and Y. Kim,
Kato, S., H. Kosaka and S. Hara,
Liu, K., and S. Muse,
Londo, J. P., Y. C. Chiang, K. H. Hung, K. H. Chiang and B. A. Schaal,
Oka, H. I., and H. Morishima,
Page, R. D. M.,
Panaud, O., X. Chen and S. R. Mccouch,
Second, G.,
Shinjyo, C.,
Smith, B. D.,
Sun, C. Q., X. K. Wang, Z. C. Li, A. Yoshimura and N. Iwata,
Vigouroux, Y., M. McMullen, C. T. Hittinger, K. Houchins, L. Schulz et al.,
Vitte, C., F. Lamy, T. Ishii, D. S. Brar and O. Panaud,
Wang, X. K., and C. Q. Sun,
Wright, S.,
Yamanaka, S., I. Nakamura, H. Nakai and Y. I. Sato,
