


Abstract
It has been hypothesized that polyploidy permits the proliferation of transposable elements, due to both the masking of deleterious recessive mutations and the breakdown of host silencing mechanisms. We investigated the patterns of insertion polymorphism of an Ac-like transposable element and nucleotide diversity at 18 gene fragments in the allotetraploid Arabidopsis suecica and the autotetraploid A. arenosa. All identified insertions were fixed in A. suecica, and many were clearly inherited from the parental species A. thaliana or A. arenosa. These results are inconsistent with a rapid increase in transposition associated with hybrid breakdown but support the evidence from nucleotide polymorphism patterns of a recent single origin of this species leading to genomewide fixations of transposable elements. In contrast, most insertions were segregating at very low frequencies in A. arenosa samples, showing a significant departure from neutrality in favor of purifying selection, even when we account for population subdivision inferred from sequence variation. Patterns of nucleotide variation at reference genes are consistent with the TE results, showing evidence for higher effective population sizes in A. arenosa than in related diploid taxa but a near complete population bottleneck associated with the origins of A. suecica.
IT has been suggested from insertion polymorphism data that many transposable elements (TEs) in natural populations are in a balance between the accumulation of copies as a result of transposition and their removal by purifying selection (Charlesworth and Charlesworth 1983; Biémont et al. 1997; Charlesworth et al. 1997). Evidence from population data for Drosophila (Charlesworth et al. 1992; Hoogland and Biémont 1996; Petrov et al. 2003), Arabidopsis lyrata (Wright et al. 2001), maize (Tenaillon et al. 2002), yeast (Fingerman et al. 2003), and even some human transposons (Boissinot et al. 2006) has shown that individual insertions tend to segregate at low frequencies. Analyses of these data generally support models of transposition–selection balance where natural selection acts as the main force opposing element spread (Charlesworth et al. 1994). These models suggest several possible explanations for high rates of TE accumulation in some taxa: reductions in effective population size, reduced selection coefficients, and/or higher transposition rates.
The evolutionary history of maize suggests that the two major events of polyploid formation and retrotransposon amplification happened on the same phylogenetic lineage (Tikhonov et al. 1999; Gaut et al. 2000). This proliferation may account for half or more of the fourfold difference in DNA content between sorghum and maize. However, a general correlation between polyploid formation and transposon proliferation remains to be established, and the hypothesized causes remain untested. Matzke and Matzke (1998) argued that allopolyploidy permits the proliferation of transposable elements because the presence of multiple copies of all genes leads to a buffering from the deleterious consequences of transposition. As a consequence, TEs may accumulate and fix in allopolyploid genomes, even in gene-rich genomic regions. A similar argument applies to autopolyploids; there may be relaxation of selection relative to diploids when an insertion is present in one of four copies, although we do not expect the increased fixation rates predicted in allopolyploids given the absence of a distinct homeologous locus. An alternative hypothesis is that host-silencing mechanisms such as methylation may break down in allopolyploid hybrids, allowing transposition rates to become elevated (Madlung et al. 2002, 2005). On the other hand, the larger number of genome copies per individual can reduce the extent of drift, potentially increasing the efficacy of purifying selection compared with a diploid population of the same size.
Experimental evidence for transposon activation in a polyploid is found from a study by Madlung et al. (2005), using Arabidopsis genomic microarrays to survey a heterochromatic region of chromosome 4. They found that an En-Spm transposon showed transcriptional activation in an experimentally generated allopolyploid hybrid compared to its autotetraploid parental lines. Similar results have been obtained for experimentally synthesized wheat (Kashkush et al. 2003). Experimental hybridization in Drosophila has also revealed an order of magnitude increase in transposition rate compared with parental controls (Labrador et al. 1999) and retrotransposon amplification combined with demethylation has also been observed in experimental mammalian hybrids (O'Neill et al. 1998). In a natural system, diploid hybrid sunflowers also exhibit a proliferation of TEs (Ungerer et al. 2006), consistent with hybridization breaking down host silencing mechanisms.
While these studies support the hypothesis of reduced TE silencing associated with hybridization, there is less evidence in the literature for a clear connection between gene duplication and a relaxation of selection on TEs. Two studies in particular have demonstrated that transposable elements are overrepresented in duplicated regions of individual genomes (A. thaliana, Hughes et al. 2003; rice blast fungus, Thon et al. 2006), although another study in yeast found the opposite pattern (Hughes and Friedman 2004). While the authors of these studies interpreted their results as evidence that TEs are important in causing duplication, the alternative explanation is that these duplicated regions experience relaxed selection against TEs due to redundancy in gene function. Brassica oleracea, an ancient hexaploid species (Ziolkowski et al. 2006), shows evidence for a strong accumulation of many classes of transposable elements relative to the related A. thaliana (Zhang and Wessler 2004), which is also consistent with polyploidy allowing for TE proliferation.
Shifts in mating system could also affect the dynamic of TEs in polyploids, especially because polyploidization is often associated with an increased potential for selfing (Barringer 2007). Because the transmissibility of TEs from genome to genome is lower in selfers, population genetic theory predicts that rates of element movement in a selfer should evolve to be lower relative to those in an outcrosser (Charlesworth and Langley 1989). Furthermore, under models of selection against insertions, the purging of deleterious recessive insertions in selfers may further reduce TE abundance (Wright and Schoen 1999; Morgan 2001). On the other hand, models of selection against ectopic recombination events between insertions (Montgomery et al. 1991) predict an accumulation of TEs in selfers if high homozygosity reduces ectopic pairing (Charlesworth and Charlesworth 1995; Wright and Schoen 1999; Morgan 2001).
A. suecica (2n = 4x = 26) is a model allopolyploid species, most likely formed by combining an unreduced diploid A. thaliana (2n = 10) ovule with diploid pollen from the autotetraploid A. arenosa (2n = 4x = 32) or a close relative (Jakobsson et al. 2006). Patterns of polymorphism at 52 microsatellite loci and four nuclear genes in A. suecica suggest very low levels of diversity, consistent with a recent single origin of this species (Jakobsson et al. 2006). In addition to contrasting origins (recent allopolyploid vs. older autopolyploid), A. suecica and A. arenosa differ in mating system, with A. suecica being self-compatible and highly selfing (Säll et al. 2004), while A. arenosa is self-incompatible. The self-incompatibility in A. arenosa is not well understood, and it is assumed to be close to the system found in its closely related species A. lyrata (Mable et al. 2003). The complete genome sequence of A. thaliana (Arabidopsis Genome Initiative 2000) and the near completion of the genome of A. lyrata (www.jgi.doe.org) make A. arenosa and A. suecica ideal models for studying genome evolution in polyploid species.
Here, we take a population genetic approach to study natural TE insertion and nucleotide variation in A. suecica and A. arenosa. The recent single origin of A. suecica (Jakobsson et al. 2006) makes this an excellent model for examining the early stages of genome evolution in an allotetraploid. Given the recent allopolyploid origin of this species via a severe population bottleneck, we predict that natural selection against TE activity in A. suecica should be less effective than in related diploids and A. arenosa. In contrast, the outcrossing autotetraploid A. arenosa may not experience such a strong relaxation of natural selection and little increased fixation, although the increased ploidy could lead to a greater level of TE polymorphism, particularly in gene-rich regions.
Ac-III is a class II transposable element that was identified in the ecotype A. thaliana (Columbia) in a survey of TE diversity (Le et al. 2000). The elements contain short inverted terminal repeats, flanked by eight-nucleotide host sequence duplications, which are characteristics of the hobo/Ac/Tam3 (hAT) transposon superfamily (Henk et al. 1999). Many members of the hAT superfamily have been shown to be responsible for phenotypic variation (Coen and Carpenter 1986) and spontaneous mutations (Shalev and Levy 1997; Zhang and Peterson 1999). Previous analysis of this element in natural populations has provided evidence that insertions of this element are subject to weak purifying selection in the outcrossing species A. lyrata, with increased population frequencies but no major shift in the number of sites polymorphic for TEs in the selfing A. thaliana (Wright et al. 2001).
In this study, we used a PCR-based transposon display (TD) approach (Korswagen et al. 1996; Waugh et al. 1997; Van Den Broeck et al. 1998; Wright et al. 2001), which is a modified amplified fragment length polymorphism (AFLP) procedure (Vos et al. 1995), to examine the frequency and insertion polymorphism of the Ac-III transposon family in natural populations of the allotetraploid A. suecica and the autotetraploid A. arenosa. We also conducted sequencing of the insertion sites for a large fraction of the identified insertions to examine the genomic locations of insertion sites segregating in nature. We compare our results to those previously found in the related diploid species to assess the role of ploidy, allopolyploidy, and population history in driving TE evolution.
In addition to the study of TE dynamics, we build on preliminary surveys of non-TE nucleotide variation in A. suecica at reference nuclear genes (Jakobsson et al. 2006) by surveying nucleotide sequence variation from 18 orthologous gene fragments in both species to obtain a better picture of the comparative effective population sizes and demographic history of these species and the related diploid taxa, A. lyrata and A. thaliana. This context allows us to better understand the interplay of genetic and historical factors in transposable-element evolution and the efficacy of natural selection.
MATERIALS AND METHODS
Plant material:
A. suecica and A. arenosa seeds were obtained from multiple geographic locations as shown in Table 1. Plants were grown and raised in a growth chamber under 10 hr daylight at 20°. Genomic DNA was extracted from leaf material using the Dellaporta et al. (1983) protocol.
Polyploid Arabidopsis species samples
Species | TE/SNPa | Ploidy | Origin | |
|---|---|---|---|---|
| A. suecica | S222 | TE | 2n = 26b | Olofsforsd |
| A. suecica | S460 | TE, SNP | 2n = 26 | Envikend |
| A. suecica | S260 | TE | 2n = 26 | Hammarstrandd |
| A. suecica | S457 | TE | 2n = 26 | Central Swedend |
| A. suecica | S60 | TE | 2n = 26 | Vännäsd |
| A. suecica | S61 | TE, SNP | 2n = 26 | Vännäsd |
| A. suecica | S71 | TE, SNP | 2n = 26 | Soder Nyakerd |
| A. suecica | S80 | TE, SNP | 2n = 26 | Nordmalingd |
| A. suecica | S182 | TE, SNP | 2n = 26 | Voxnand |
| A. suecica | S261 | TE, SNP | 2n = 26 | Hammarstrandd |
| A. suecica | S125 | TE, SNP | 2n = 26 | Friggesundd |
| A. suecica | S181 | TE | 2n = 26 | Voxnand |
| A. suecica | S171 | TE, SNP | 2n = 26 | Losd |
| A. suecica | S452 | SNP | 2n = 26 | Garpenberg |
| A. arenosa | JPL_020 | TE, SNP | 2n = 4x = 32c | Ulreichsberg, Slovakiae |
| A. arenosa | JPL_032 | TE, SNP | 2n = 4x = 32 | Ullrichsberg, Austriae |
| A. arenosa | JPL_048 | TE | 2n = 4x = 32 | Ulreichsberg, Slovakiae |
| A. arenosa | JPL_018 | TE | 2n = 4x = 32 | Ulreichsberg, Slovakiae |
| A. arenosa | JPL_019 | TE, SNP | 2n = 4x = 32 | Ulreichsberg, Slovakiae |
| A. arenosa | JPL_047 | TE, SNP | 2n = 4x = 32 | Czecke |
| A. arenosa | A9 | TE, SNP | 2n = 4x = 32 | Kvasia, Ukrainef |
| A. arenosa | A3 | TE, SNP | 2n = 4x = 32 | Slovensky, Slovakiaf |
| A. arenosa | A7 | SNP | 2n = 4x = 32 | Úplaziky, Slovakiaf |
| A. arenosa | Care-1 | TE, SNP | 2n = 4x = 32 | Unknowng |
The sample was used for TE insertion polymorphism (TE) and/or nucleotide variation (SNP) surveys.
Allopolyploid species.
Autotetraploid species.
Seeds were obtained from T. Säll, Lund University, Lund, Sweden. All samples are from Sweden.
Dry leaves were obtained from Ryan K. Oyama, laboratory of T. Mitchell-Olds, Jena, Germany.
Seeds were obtained from Karol Marhold and Martin Kolnik, Slovak Academy of Sciences, Bratislava, Slovakia.
Seeds were obtained from The Arabidopsis Biological Resource Center (ABRC) at Ohio State University.
Transposon display:
Transposon display was performed as described by Wright et al. (2001) with minor modifications. A total of 100 ng genomic DNA were digested with 2.5 units NlaIII (New England Biolabs, Beverly, MA) and ligated to 15-pmol adaptor cassettes (NlaIII 503 5′ CAAGGAGAGGACGCTGTCTGTCGAAGGTAAGGAACGGACGAGAGAAGGGAGA 3′ and NlaIII 504 5′ TCTCCCTTCTCGAATCGTAACCGTTCGTACGAGAATCGCTGTCCTCTCCTTGCATG 3′) with T4 DNA ligase (Invitrogen, Burlington, ON, Canada).
The ligation reaction was diluted 3-fold, and 3 μl of the ligation reaction were used as a template for preselective amplification with Ac-III-specific primer (5′ G(C/A)TTCGGTTCGGTTA(A/T)TCGGTTAG 3′) and adaptor-specific primer (5′ CGAATCGTAACCGTTCGTACGAGAATCGCT 3′), using the following PCR conditions: 10 min at 94° of initial denaturing, 20 cycles of 1 min at 94°, 1 min at 63°, 1 min at 72°, and a final extension of 10 min at 72°. PCR products were diluted 50-fold in MilliQ (Millipore, Billerica, MA) distilled water. A second round of selective amplification was performed using 2 μl of the diluted PCR products under the following PCR conditions: 10 min at 94° of initial denaturing, 20 cycles of 2 min at 94°, 2 min at 63°, 2 min at 72°, and a final extension of 60 min at 72° with nested adaptor-specific primer (5′ GTACGAGAATCGCTGTCCTC 3′) and D2-PA labeled (Beckman Coulter, Mississauga, ON, Canada) nested element-specific primer [5′ GGTTCGGTTA(A/T)TCGGTTAGC(G/T)G 3′]. A 2-pmol aliquot was run on a CEQ 8000 sequencer (Beckman Coulter) and bands were scored manually for presence or absence of insertions. Note that due to a size cutoff of ∼600 bp, our survey is not an absolute estimate of abundance for this element. A. thaliana (Col) provided a positive control for this study, based on band sizes predicted from the whole-genome sequence. To test the reproducibility of bands, the transposon display was repeated four times using the same samples, and high reproducibility was observed (∼80–85%). Only bands that were present in at least three of four replicates were included in the analysis.
Cloning and amplification of the polymorphic fragments:
In addition to labeled amplification, nested amplification was performed using unlabeled primer, and the amplicons were cleaned using a QIAquick PCR purification kit (QIAGEN, Mississauga, ON, Canada), ligated into the PCR.2.1 vector using the standard TA cloning kit (Invitrogen), and transformed into heat-shock-competent Escherichia coli strain TOPO10 F′ (Invitrogen) according to the manufacturer's instructions. Transformants were selected on medium containing ampicillin and X-gal. White colonies containing recombinant plasmids were transferred by pipette into PCR tubes containing 10 μl MilliQ water. Colony PCR was performed using 15 pmol of forward and reverse M13 primers. Colony PCR products from a wide range of sizes were sequenced by Lark Technologies (Houston). The sequences were first checked for the presence of the inverted repeat present at the 5′ end of the sequence and then submitted to a BLAST search (Altschul et al. 1997) to identify sequence homology for the direct flanking region. To be conservative with respect to describing insertions in genic regions, we classified insertions as intronic or exonic only when the sequence directly flanking the inverted repeat matched annotated introns and exons. Insertions into other transposable elements were treated as intergenic. Note that some of the cloned insertions may not correspond to insertions scored using transposon display, either because of the size limits of TD or because of low repeatability of amplification of the insertion. Sequence analysis identified only a single case where distinct fragment sizes corresponded to the same flanking sequence (see below), confirming the assumption that distinct band sizes generally correspond to distinct insertions. To increase the flanking sequence information from diploids for comparison, we also conducted TE-display PCR and cloning in A. lyrata and A. thaliana. We used four individuals from different geographic locations of A. thaliana and A. lyrata. A. thaliana samples were obtained from the Arabidopsis Stock Centre (ABRC) (Edi-0, Ws-0, LL-0, and Ei-2). The four A. lyrata samples were from Stubbsand, Sweden (from O. Savolainen), Singing Sands, Ontario (from B. Mable), Indiana Dunes, Indiana (from B. Mable), and Karhumäki, Russia (from O. Savolainen).
DNA sequencing of nuclear genes:
PCR primers from single large exons were designed and sequenced as previously described in a survey of nucleotide variation in A. lyrata (Wright et al. 2006; J. Ross-Ibarra, S. I. Wright, J. P. Foxe, L. DeRose Wilson, G. Gos, D. Charlesworth and B. S. Gaut, unpublished results). Briefly, PCR products were amplified in 96-well plates, and amplicons were sequenced directly on both strands by Cogenics (Houston). Chromatograms were carefully checked using Sequencher v. 4.5 (Gene Codes, Ann Arbor, MI), and secondary peaks were identified with the aid of the “call secondary peaks” option. Only double peaks found on both strands were incorporated in the analysis. In the case of A. suecica, “fixed heterozygosity” was commonly observed at the vast majority of variable sites, corresponding to the two duplicate copies of each locus, and most fixed heterozygosity was clearly identifiable as sequence differences between the two putative parental species included in the alignment, A. thaliana and A. arenosa. In a small number of cases where some individuals appeared to show only one copy of the two putative homeologous loci, “allelic dropout” of one copy was suspected and in all cases reamplification of the same or an adjacent region confirmed fixed heterozygous sites. These loci, along with loci with insertion/deletion events causing unreadable traces, were excluded from analysis of A. suecica variation. These fixed sites were not included as polymorphisms, and only sites showing variable polymorphism profiles were included in subsequent analyses. Given high levels of selfing in A. suecica (Säll et al. 2004), we presume that our sequence profiles reflected homozygous data at each individual homeolog.
For each locus, we calculated Watterson's (1975) estimator of the population mutation parameter θ = 4Neu, where Ne is the effective population size and u is the mutation rate, using a modification of Perl code (Polymorphurama) written by D. Bachtrog and P. Andolfatto (University of California, San Diego). For an equivalent comparison with related diploids, we estimated θ in A. arenosa by treating our observed data as a sample size of n × 4, where n is the number of individuals, and using the number of segregating sites to calculate Watterson's estimator. In A. suecica, because the data come from two homeologous loci in a highly selfing species, we estimated θ by taking the number of individuals as the sample size, and the total number of segregating sites to calculate Watterson's estimator, and then dividing this estimate by two. This effectively gives an average estimate of the population mutation parameter from the two homeologous loci. Diversity statistics were calculated separately for synonymous and nonsynonymous sites.
TE data analysis:
Population structure can, however, generate a departure from Hardy–Weinberg that elevates the frequency of homozygotes, causing
We calculated Tajima's (1989) D statistic using the number of polymorphic insertions and the average pairwise differences in insertion site profiles, inferring element frequencies assuming Hardy–Weinberg proportions and the two models of inbreeding described above. Significance of Tajima's D under the three scenarios was inferred assuming free recombination, which is reasonable given the genomewide distribution of insertions.
In addition, a maximum-likelihood method (Petrov et al. 2003) was used to estimate the strength of selection acting against transposable elements from the transposon insertion frequency data. This method assumes that each insertion is unique and uses a diffusion model to predict the frequency distribution of the insertion, F[x], over the period of time between when the insertion occurs and when it is eliminated from the population by selection. Petrov et al. then weighted this frequency distribution by the probability that the TE would be present in the one sequenced genome available, as that was their method of detecting TE sites. Using this conditional frequency distribution, the authors determined the likelihood of the observed TE frequencies given the effective population size, Ne, and the fitness effect of a transposable element, s, with either h = ½ (additive case) or h = 1 (complete dominance).
RESULTS
Copy number and insertion polymorphism:
TD profiles among A. suecica accessions showed identical banding patterns with bands present at all 6 insertion sites in all of the 13 sampled individuals, suggesting that these insertions were fixed or nearly so (Figure 1, Table 2) in at least one of the two homeologous regions. In contrast, TE display of A. arenosa showed a very distinct banding pattern, with high levels of insertion polymorphism seen among the 9 individuals sampled. Although the mean copy number per individual in A. arenosa of 5.9 was similar to the 6 observed in A. suecica (Figure 1, Table 2), most individual insertions were restricted to one or a few individuals in the sample. In total, 43 insertion sites were observed in 9 individuals of A. arenosa, and all were polymorphic, although subsequent cloning and sequencing revealed a single insertion shared with A. thaliana, which could be ancient and fixed (see below).
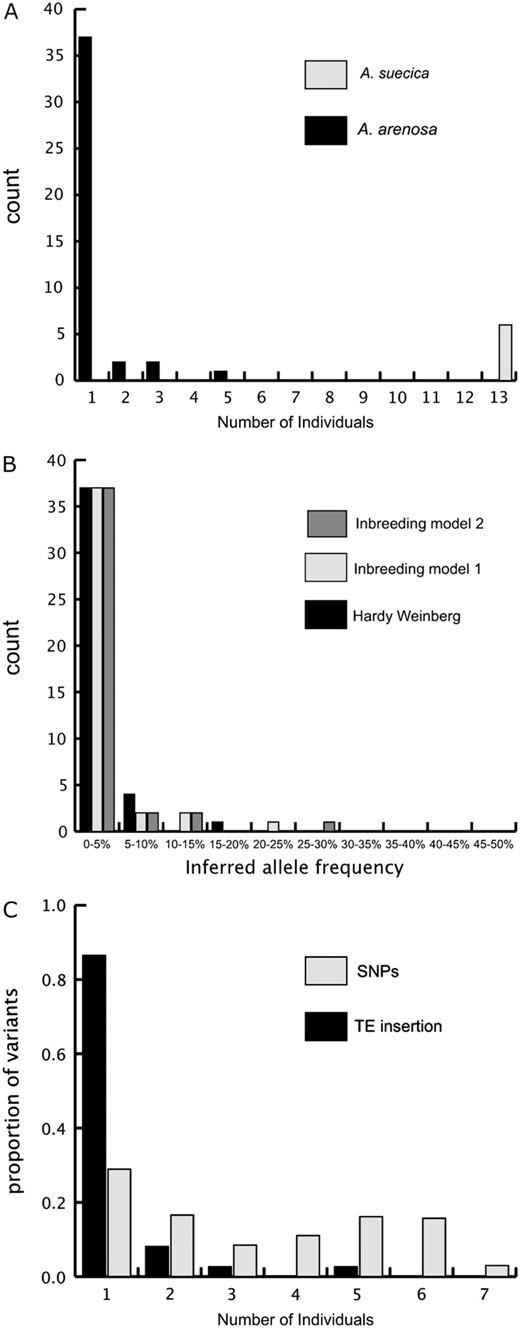
(A) Frequency distribution of Ac-III elements in A. arenosa and A. suecica. The x-axis shows the number of individuals and the y-axis shows the number of insertion sites present in x individuals. Total sample sizes were 9 individuals in A. arenosa and 13 in A. suecica. (B) Inferred allele-frequency distribution of Ac-III elements in A. arenosa. Both models of inbreeding give the same inferred frequency spectrum. (C) Comparison of the frequency distribution of single-nucleotide polymorphisms (SNPs) and TE insertions. The x-axis shows the number of individuals, and the y-axis is the proportion of minor-frequency SNP alleles and TE insertions found in x individuals.
Number of polymorphic sites and the average copy number in both species
Species | Total no. of insertion sites | No. of polymorphic sites | Average no. of insertion sites per individual |
|---|---|---|---|
| A. suecica | 6 | 0 | 6 |
| A. arenosa | 43 | 42 | 5.9 |
Species | Total no. of insertion sites | No. of polymorphic sites | Average no. of insertion sites per individual |
|---|---|---|---|
| A. suecica | 6 | 0 | 6 |
| A. arenosa | 43 | 42 | 5.9 |
Figure 1A shows the frequency distribution of the 43 TE insertions screened using transposon display in A. arenosa. Thirty-seven TE insertions (87%) were observed in only one individual of the nine sampled. The estimated insertion frequency distribution of polymorphic Ac-III-like element insertions in A. arenosa assuming random mating is highly skewed toward low frequencies (Figure 1B).
Inbreeding coefficient:
Using our nucleotide sequence polymorphism data, our composite-likelihood estimate of inbreeding coefficients is 0.4 using the inbreeding model 1 and 0.3 using the inbreeding model 2 (see supplemental material S1). With either model, the fit was significantly better than a model with Hardy–Weinberg proportions enforced (i.e., with f constrained to zero; P-value <0.001, maximum-likelihood-ratio test), although the significance level should be treated with caution due to violation of assumptions of linkage equilibrium. As expected, correcting the inferred TE frequency spectrum for these levels of inbreeding leads to a slight increase in inferred element frequencies (Figure 1B).
Sequence analysis of Ac-III-like insertion sites:
Information on all of the cloned flanking sequences of the Ac-III element is summarized in supplemental material S2. On the basis of sequence analysis of A. suecica bands, five of six insertions were cloned; only one insertion (380 bp) was confirmed as having the same flanking sequence as in A. thaliana, while two of them were shared with A. arenosa (A9, 309 bp; Care-1, 156 bp). Of the remaining two insertions, one is intronic, and one is inserted into a retrotransposon; these might represent new insertion events, but they might simply represent unsampled variants from one of the two parental species.
We cloned a total of 44 distinct insertion sites in A. arenosa, which is close to the 43 that were identifiable using transposon display. Note that this does not imply that we have successfully cloned all TD-visualized insertions, since some of our cloned insertions exceed or fall below the likely size limits of reproducible TD visualization. Sequence analysis of insertions in A. arenosa generally confirmed the patterns from transposon display, in that the vast majority of cloned insertion sites, 41/44 (93%), were found in only a single individual. Only one cloned insertion (124 bp) was shared among three different individuals of A. arenosa (JPL_32, JPL_19, and JPL_20). We also identified an insertion (139 bp) that is shared with A. thaliana and cloned in A. arenosa (Care-1 and A3), which makes it possibly an ancient fixed insertion. Upon further inspection of the transposon display output, we identified a faint signal in some accessions at this band size, suggesting the possibility of an ancient, shared insertion with diverged priming sites. A single case was also identified of a shared insertion site of different sizes (124 bp in JPL_32 and 111 bp in JPL_19), consistent with insertion/deletion events or sequence polymorphisms in the restriction site affecting band sizes. This insertion was considered shared in subsequent selection analyses.
In the analyses of flanking sequence location, we did not include two insertion sites in A. arenosa that showed similarity to exons but no match directly adjacent to the insertion, and we classified insertions into transposable elements, unknown flanking sites, and pseudogenes as “intergenic.” Consistent with patterns in the diploid species (Wright et al. 2001), the majority of the flanking sequences in both A. suecica and A. arenosa were in noncoding regions, including intergenic and intronic regions (Figure 2). That said, some of the sequences cloned in A. arenosa are unknown, with no significant match in the A. thaliana database, probably reflective of divergent intergenic regions between species, as well as the small size of the cloned flanking regions. Regions with no match to A. thaliana were also submitted to a BLAST search against the incomplete A. lyrata shotgun sequences and similar sequences were found, exclusively in intergenic regions (supplemental material S2).
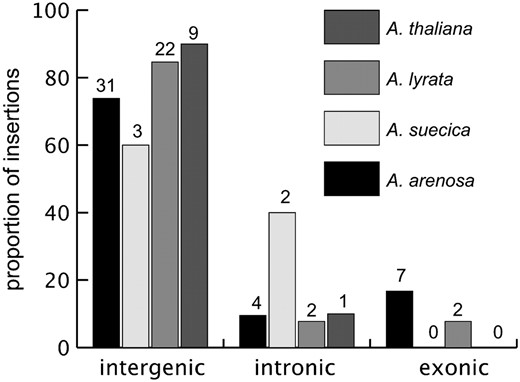
Proportion of insertions into different genomic locations. The x-axis shows the sample population (A. suecica, A. arenosa, A. lyrata, and A. thaliana). The y-axis shows the percentage of insertion sites in each genomic location. Numbers on the bars indicate the observed numbers of insertions.
Given the deleterious effect of insertions into coding regions, a very small fraction of insertions should be found in exonic regions. Surprisingly, however, 7 insertions of 42 cloned and annotated in A. arenosa (17%) were detected in coding regions. Those exons include characterized and expressed proteins and are not restricted to hypothetical genes (supplemental material S2).
The frequencies of intronic, intergenic, and exonic insertions in A. thaliana, A. lyrata, A. suecica, and A. arenosa are shown in Figure 2. As previously described (Wright et al. 2003), the insertions in A. thaliana and A. lyrata are predominantly intergenic, and our new results suggest an increasing trend toward a higher proportion of exonic and intronic insertions in A. arenosa. A 3 × 4 exact test was performed to test if there are significant differences across species in the relative proportion of insertions into each type of region (intergenic, intronic, and exonic). This test was not significant using an exact contingency test (P = 0.235). If we compare genic vs. intergenic proportions in tetraploids (13 vs. 34) and diploids (5 vs. 31) in a 2 × 2 contingency test, we again see a nonsignificant exact contingency test (P = 0.098).
Estimation of the intensity of selection:
Given the complete fixation of insertions in A. suecica, we focus our parameter estimation and tests of selection on A. arenosa. Tajima's (1983) D statistic shows a significant departure from neutrality in favor of an excess of low-frequency variants, assuming Hardy–Weinberg proportions (D = −2.5; P < 0.01). Tajima's D remains significantly negative when we account for inbreeding in our estimates of pairwise diversity (model 1, D = −2.12, P < 0.01; model 2, D = −2.43, P < 0.01). Significantly negative Tajima's D is consistent with purifying selection, but it can also be generated by demographic changes, in particular by growing population sizes.
To control for possible departures from demographic equilibrium, we also examined the site-frequency spectrum of single-nucleotide polymorphisms from our sequencing survey. We focus here on sequence polymorphism results from the 11 loci with a PCR success rate giving a sample of seven or eight individuals and subsample the latter for an equivalent sample size by randomly subsampling the data. For direct comparison, we examined an equivalent sample size of TE-insertion polymorphism data, excluding the two individuals that were not used in the resequencing survey. Figure 1C shows a direct comparison of frequency spectrum for TE insertions with the frequency spectrum for minor SNPs. Note that this comparison is conservative with respect to testing for a skew in the TE frequency spectrum, since we are assuming the minor SNP is the derived base, which will not always be the case. There is a highly significant difference between the SNP frequency distribution and the TE distribution (Mann–Whitney U-test, P < 0.0001), consistent with purifying selection controlling TE frequencies. Furthermore, Tajima's D values were never negative using the combined SNP data, in contrast to the analysis of TEs (D = 0.013 under Hardy–Weinberg; D = 0.93 under inbreeding model 1; D = 0.58 under inbreeding model 2). Given a common demographic history, the contrasting spectra observed for SNPs and TEs strongly support a role for negative selection acting to reduce the frequency of TEs.
We used a likelihood approach to infer the intensity of selection on data sets both including and excluding the putative fixed ancient insertion. Because this insertion appears to be shared between A. thaliana and A. arenosa, it likely reflects population dynamics prior to the evolution of tetraploidy and may not represent a polymorphic insertion segregating at high frequency. Nevertheless, we examine whether our inference changes with the presence of a high-frequency polymorphic TE. The likelihood plot is illustrated for our data with the additive model (Figure 3A), the partially recessive model (Figure 3B), and the dominant model (Figure 3C) under Hardy–Weinberg assumptions.
![Likelihood surface for the selection parameter $\batchmode \documentclass[fleqn,10pt,legalpaper]{article} \usepackage{amssymb} \usepackage{amsfonts} \usepackage{amsmath} \pagestyle{empty} \begin{document} \(N_{\mathrm{e}}s\) \end{document}$ in A. arenosa, where Ne is the effective population size and s is the selection coefficient. (A) Likelihood plot for the additive model including (shaded line) and excluding (solid line) the ancient insertion. (B) Likelihood plot for the dominant model including (shaded line) and excluding (solid line) the ancient insertion. (C) Likelihood plot for the partially recessive model including (shaded line) and excluding (solid line) the ancient insertion.](https://oup.silverchair-cdn.com/oup/backfile/Content_public/Journal/genetics/179/1/10.1534_genetics.107.085761/6/m_581fig3.jpeg?Expires=1717062434&Signature=S2y2CUL-o08tBC67VyB3-7XQAO2fqUFEB2wLMX3z3Bf0wjs~x7V7dnCQRH6zsJFfOoWicWsACnOPbbF7XJcGqPXl7bALsqqydHujXt-fiHZwFLFj92czIK1IuTWghTZJZzXrZQ5AcIXYEqnds0dvzaDbMG4oKYu6mPIhfv6GBgOYqDs6rwfG~hDeWQGQGvszDFJ97e3QGL0~RdBPBD5uvq~03WnSrmftf4WiWGexvS2oZBOCVnwugAKsIrg08UqzfKKkU7YXxSToijadzACTcEunsoNMRoFrJlKbR8hk9wPjR9ZKYlhvPibimrYvV9yFP-3RwWM1h2l-70oL39iJ-w__&Key-Pair-Id=APKAIE5G5CRDK6RD3PGA)
Likelihood surface for the selection parameter
The maximum-likelihood estimate of
Estimates of the population selection parameter in A. arenosa, under different selection and mating models
Mating model | Selection model | Nesa | χ2-test of Ns = 0b |
|---|---|---|---|
| Hardy–Weinberg | Additive | −30 | 77.4* |
| Partially recessive | −50 | 84* | |
| Dominant | −10 | 82* | |
| Inbreeding model 1 | Additive | −10 | 68* |
| Partially recessive | −20 | 88* | |
| Dominant | −10 | 92* | |
| Inbreeding model 2 | Additive | −20 | 87.1* |
| Partially recessive | −20 | 77.7* | |
| Dominant | −20 | 35* |
All P-values <0.001.
Maximum-likelihood estimates of Nes are provided to the nearest multiple of 10.
Likelihood-ratio test of selection model vs. neutral model, constraining Ns to be zero.
If the low frequency of transposable elements is due to negative deleterious consequences of these elements in general, we should see similar evidence of selection whether we look across the populations, as above, or focus on a single population. To investigate this possibility we inferred selection parameters on a subset of four individuals (16 chromosomes) from a single locality (Ulreichsberg, Slovakia). All models still show significant evidence of selection against TEs (additive model Nes = −55; partially recessive model Nes = −100; dominance model Nes = −15; departure from neutral model P < 0.001, assuming Hardy–Weinberg proportions).
Levels of nucleotide variation in A. arenosa and A. suecica:
Levels of diversity at 18 gene fragments are given in Table 4. Polymorphism levels are generally very high in A. arenosa; the weighted average estimate of θs = 4Neu at synonymous sites is 0.045. Interestingly, this is twofold higher variability than observed in the diploid A. lyrata (0.02; Wright et al. 2006), consistent with theoretical predictions that effective population size of an outcrossing autotetraploid should be double that of an outcrossing diploid, all else being equal. In contrast, A. suecica is almost completely devoid of nucleotide variation, consistent with previous reports (Jakobsson et al. 2006), although unlike previous work we do identify some nucleotide diversity in nuclear genes. Overall, 2 of 14 loci (14%) showed synonymous variation in A. suecica and 3 of 14 loci (21%) showed nonsynonymous variation. Interestingly, 2 of the 3 polymorphic loci, At3g10340 and At3g13290, are closely linked on the same chromosome (chromosome 3) in A. thaliana and, given high levels of synteny in the genus (Acarkan et al. 2000; Kuittinen et al. 2004; Hansson et al. 2006; Kawabe et al. 2006; Schranz et al. 2007), are also likely to be linked in A. arenosa. Furthermore, the 21 segregating sites in these 2 loci are in complete linkage disequilibrium in A. suecica (not shown), suggesting the maintenance of a large polymorphic haplotype block in this region of the genome. Of these polymorphic sites, 20 of the 21 are also segregating in our sample of A. arenosa, consistent with these haplotypes having been inherited from this parental genome. The single A. suecica nonsynonymous polymorphism found in At1g65450 is not found in A. arenosa, suggesting that this is a new mutation, a low-frequency polymorphism that has not been sampled, or a polymorphic site in A. thaliana. Overall, the majority of “fixed heterozygotes,” i.e., fixed nucleotide differences between homeologs in A. suecica, can easily be traced in our data set to nucleotide differences between the sequenced A. thaliana genome and our A. arenosa polymorphism data set; 227 of 243 (93%) fixed heterozygotes in A. suecica were evident as either fixed differences between A. arenosa and the reference A. thaliana (170, or 70%) or a segregating polymorphism in A. arenosa with a nucleotide difference in the A. thaliana sequence (57, or 25%) (see supplemental material S3 for illustration of site categories). These latter 25% of fixed heterozygotes likely reflect large-scale fixation of segregating variation following allotetraploid origins. If we take our nucleotide polymorphism data as representative of the genome as a whole, the majority of the genome appears to have experienced a bottleneck of a single genomic allele at each of the two homeologous loci, while in a small subset of the genome inherited variation has been maintained, at least at the A. arenosa parental copy. Our observation of complete fixation of TE insertions scattered across the genome is consistent with this model and points to a near-complete population bottleneck associated with the origins of A. suecica.
Levels of nucleotide variation at 18 gene fragments in A. arenosa and A. suecica
θs | θa | |||||||
|---|---|---|---|---|---|---|---|---|
| Locusa | No. arenosab | No. suecica | Lsc | A. arenosa | A. suecica | Lad | A. arenosa | A. suecica |
| At1g10900 | 7 (28) | — | 109.6 | 0.026 | — | 337.4 | 0.0038 | — |
| At1g11050 | 5 (20) | 7 | 106.9 | 0.047 | 0 | 358.1 | 0.009 | 0 |
| At1g15240 | 7 (28) | 6 | 81.8 | 0.041 | 0 | 305.2 | 0.0051 | 0 |
| At1g59720 | 6 (24) | — | 109.3 | 0.096 | — | 373.7 | 0.024 | — |
| At1g62390 | 7 (28) | 9 | 96.4 | 0.056 | 0 | 377.6 | 0.006 | 0 |
| At1g65450 | 5 (20) | 7 | 109.1 | 0.039 | 0 | 340.9 | 0.003 | 0.0005 |
| At1g68530 | 7 (28) | 8 | 85.6 | 0.045 | 0 | 277.4 | 0.0009 | 0 |
| At1g72390 | 5 (20) | 8 | 65.12 | 0.0087 | 0 | 243.87 | 0.0024 | 0 |
| At2g23590 | 7 (28) | 9 | 134.4 | 0.021 | 0 | 396.6 | 0.0069 | 0 |
| At2g26140 | 6 (24) | 8 | 100.1 | 0.046 | 0 | 334.9 | 0 | 0 |
| At2g26730 | 7 (28) | — | 85.7 | 0.039 | — | 262.3 | 0 | — |
| At2g28050 | 6 (24) | 9 | 94.6 | 0.057 | 0 | 349.4 | 0.019 | 0 |
| At2g43680 | 7 (28) | — | 115.5 | 0.031 | — | 379.5 | 0.0046 | — |
| At3g10340 | 7 (28) | 8 | 109.55 | 0.089 | 0.0245 | 337.4 | 0.004 | 0.001 |
| At3g13290 | 6 (24) | 8 | 118 | 0.0068 | 0.003125 | 365 | 0.0066 | 0.0005 |
| At3g44530 | 7 (28) | 7 | 121.9 | 0.017 | 0 | 388.1 | 0.009 | 0 |
| At3g48690 | 7 (28) | — | 102.5 | 0.075 | — | 386.5 | 0.0086 | — |
| At3g50740 | 7 (28) | 6 | 111.1 | 0.039 | 0 | 347.9 | 0.0037 | 0 |
| Total | 2071.7 | 0.043e | 0.00195f | 6161.8 | 0.0068e | 0.00015f | ||
Locus names from the Arabidopsis Genome Project (Arabidopsis Genome Initiative 2000).
Sample size in A. arenosa. The number of chromosomes is given in parentheses.
Number of synonymous sites.
Number of nonsynonymous sites.
Weighted average of estimates of Watterson's θ = 4Neu across loci.
A. suecica weighted averages not counting missing loci and accounting for the presence of two paralogous loci.
DISCUSSION
In an allopolyploid such as A. suecica, permanent “heterozygosity” tends to mask deleterious mutations, where they can persist for longer and even become fixed under weak selection. Fixation is particularly likely following a bottleneck, as was suggested for A. suecica by Jakobsson et al. (2006). A severe population bottleneck during the origin of the species is a plausible explanation for the complete fixation of TE insertions in our sample (13 individuals), particularly given the high levels of insertion polymorphism found in one parent, A. arenosa. Certainly, the lack of polymorphic insertions provides no evidence for an immediate “explosion” of transposition associated with a breakdown of TE silencing, and the lack of clear new mobility prevents us from directly testing for a strong relaxation of selection associated with allotetraploidy.
However, our results do not rule out a more quantitative level of increased activity or relaxed selection. The rate at which TE insertions will accumulate depends on the time at which the species formed and the amount of increased transposition or reduced selection. Given that the time of origin of A. suecica appears to be very recent (Jakobsson et al. 2006 and our results), the rate of transposition would need to be high to be detectable via increased copy number in this case. A. suecica origins have been estimated to be possibly as recent as 12,000 YBP (Jakobsson et al. 2006); the hybrid sunflower species Helianthus anomalus, which has shown evidence for TE proliferation (Ungerer et al. 2006), may perhaps be >10 times older (Schwarzbach and Rieseberg 2002). More detailed studies of TE activity in Arabidopsis and other allopolyploids of varying ages, including expression profiling, will be important to further test for shifts in TE activity.
In an autotetraploid such as A. arenosa, selection is expected to be more efficient at preventing the fixation of deleterious mutations than in an allotetraploid, because of stronger fitness effects when homozygous, which is consistent with our transposon display results. In addition, A. arenosa is widespread throughout Europe, and our observation of very high levels of nucleotide polymorphism is consistent with the autotetraploid species maintaining large effective population sizes.
Our TE frequency results for the outcrossing autotetraploid A. arenosa are in good agreement with what was previously reported for the outcrossing diploid A. lyrata (Wright et al. 2001). The predominantly low frequency of Ac-III like insertions suggests that strong purifying selection prevents the rise of TEs to high frequencies and/or that excision rates of TEs are high. Our estimates of
In contrast, the percentage of insertions into exonic and intronic regions follows an increasing trend when we compare A. thaliana (effectively haploid due to high homozygosity) to A. lyrata (diploid) to A. arenosa (tetraploid) (Figure 3), and the proportion of insertions into genic regions is elevated in the tetraploids compared with the diploids. Although nonsignificant, the trend is consistent with the masking hypothesis; even if selection acts strongly against a deleterious mutation when homozygous (large
Our results provide an interesting contrast in patterns, with TE fixation and a dearth of nucleotide polymorphism in the allotetraploid A. suecica but with high levels of TE variation and nucleotide polymorphism in the autotetraploid A. arenosa, with evidence for purifying selection against TEs in the latter case. It will be important to confirm these results using more element families, particularly other classes of element, which may experience distinct selective pressures and the potential for greater copy number accumulation.
Footnotes
Footnotes
Communicating editor: D. Charlesworth
Acknowledgement
We are very grateful to T. Säll, R. Oyama, T. Mitchell-Olds, M. Kolnick, K. Marhold, B. Mable, and O. Savolainen for their generous donation of seeds for this study. We also thank A. Cutter, D. Charlesworth, and an anonymous reviewer for helpful comments on the manuscript. This work was supported by a National Sciences and Engineering Research Council (NSERC) discovery grant and a Sloan Research Fellowship to S.I.W. and by an Ontario Graduate scholarship to K.H. S.P.O. was supported by an NSERC discovery grant and by the National Evolutionary Synthesis Center, National Science Foundation (no. EF0423641).
References
Bennett, J. H.,
Boissinot, S., J. Davis, A. Entezam, D. Petrov and A. V. Furano,
Charlesworth, B., and D. Charlesworth,
Coen, E. S., and R. Carpenter,
Dellaporta, S. L., J. Wood and J. B. Hicks,
Foxe, J. P., V. U. Dar, H. Zheng, M. Nordborg, B. S. Gaut et al.,
Gaut, B. S., M. Le Thierry d'Ennequin, A. S. Peek and M. C. Sawkins,
Korswagen, H. C., R. M. Durbin, M. T. Smits and R. H. A. Pasterk,
Le, Q. H., S. Wright, Z. Yu and T. Bureau,
Madlung, A., R. W. Masuelli, B. Watson, S. H. Reynolds, J. Davison et al.,
Morgan, M. T.,
Säll, T., C. Lind-Halldén, M. Jakobsson and C. Halldén,
Tikhonov, A. P., P. J. SanMiguel, Y. Nakajima, N. M. Gorenstein, J. L. Bennetzen et al.,
Van Den Broeck, D., T. Maes, M. Sauer, J. Zetho, P. De Keukeleire et al.,
Zhang, X., and S. Wessler,
