


Abstract
Mitochondrial DNA (mtDNA) is normally only inherited through the oocyte. However, nuclear transfer (NT), the fusion of a donor cell with an enucleated oocyte, can transmit both donor cell and recipient oocyte mtDNA. mtDNA replication is under the control of nuclear-encoded replication factors, such as polymerase gamma (POLG) and mitochondrial transcription factor A (TFAM). These are first expressed during late preimplantation embryo development. To account for the persistence of donor cell mtDNA, even when introduced at residual levels (mtDNAR), we hypothesized that POLG and TFAM would be upregulated in intra- and interspecific (ovine–ovine) and intergeneric (caprine–ovine) NT embryos when compared to in vitro fertilized (IVF) embryos. For the intra- and interspecific crosses, PolGA (catalytic subunit), PolGB (accessory subunit), and TFAM mRNA were expressed at the 2-cell stage in both nondepleted (mtDNA+) and mtDNAR embryos with protein being expressed up to the 16-cell stage for POLGA and TFAM. However, at the 16-cell stage, there was significantly more PolGA expression in the mtDNAR embryos compared to their mtDNA+ counterparts. Expression for all three genes first matched IVF embryos at the blastocyst stage. In the intergeneric model, POLG was upregulated during preimplantation development. Although these embryos did not persist further than the 16+-cell stage, significantly more mtDNAR embryos reached this stage. However, the vast majority of these embryos were homoplasmic for recipient oocyte mtDNA. The upreglation in mtDNA replication factors was most likely due to the donor cells still expressing these factors prior to NT.
NUCLEAR transfer (NT) involves the transfer of a donor cell, or a donor cell nucleus, into an enucleated oocyte. Subsequent fusion and activation of the reconstructed oocyte results in an embryo that can give rise to offspring and embryonic stem cells possessing nuclear genetic material identical to that of the donor cell (Campbell et al. 1996; Wakayama et al. 2001). Poor developmental success rates and the abnormalities observed in NT embryos, fetuses, and offspring have been associated with a number of factors. These include epigenetic abnormalities and irregular patterns of gene expression (Ohgane et al. 2001; Humpherys et al. 2002; Li et al. 2005, 2006). Failure of the recipient oocyte to completely reprogram the donor nucleus also results in incomplete reactivation of genes associated with pluripotency, such as Oct4 (Bortvin et al. 2003).
The donor cell also contributes mitochondria to the reconstructed oocyte. Mitochondria, which reside in the cytoplasm of all eukaryotic cells, contain one or more copies of the double-stranded circular mitochondrial genome (mtDNA). mtDNA encodes 13 of the >70 subunits of the electron transfer chain (ETC), the intracellular apparatus that generates the vast majority of a cell's ATP through the process of oxidative phosphorylation (OXPHOS). The remainder of the subunits are encoded by chromosomal DNA (Anderson et al. 1981). During normal sexual reproduction, mtDNA is almost exclusively transmitted from the mtDNA present in the unfertilized oocyte and is therefore maternally inherited (Giles et al. 1980; Birky 1995). These mtDNA genomes originate from a few mitochondria segregated to each primordial germ cell shortly after the onset of gastrulation (Jansen and de Boer 1998). The mtDNA in these precursor germ cells are then clonally amplified during the later stages of oogenesis (Hauswirth and Laipis 1982; Poulton et al. 1998). In the vast majority of cases, this process leads to the transmission of only a single type of mtDNA, a state known as homoplasmy. However, due to the donor cell contributing mtDNA to the reconstructed oocyte, mtDNA can be inherited either from the recipient oocyte only or from both the donor cell and recipient oocyte (heteroplasmy). Such transmission has been observed in both NT embryos (Steinborn et al. 1998; Lloyd et al. 2006) and their offspring (Evans et al. 1999; Hiendleder et al. 1999; Meirelles et al. 2001; Steinborn et al. 2002; St. John and Schatten 2004).
As NT has been used to generate intraspecific (Meng et al. 1997; Wilmut et al. 1997; Cibelli et al. 1998; Baguisi et al. 1999; Polejaeva et al. 2000), interspecific (Loi et al. 2001; Meirelles et al. 2001; Steinborn et al. 2002; Gomez et al. 2004; Jiang et al. 2004), and intergeneric (Chen et al. 2002; Chang et al. 2003; Yang et al. 2003, 2004; Liu et al. 2004) embryos, the mixing of diverse nuclear and mtDNA fusion partners could compromise ETC function and be disadvantageous for preimplantation or fetal development and survival of the offspring. This is first reflected in mtDNA genomes from different breeds, which possess sequence variants in coding genes (Hiendleder et al. 1998). Heteroplasmy would lead to variable amino acid composition, as demonstrated in bovine (Steinborn et al. 2002) and porcine (St. John et al. 2005) interspecific NT offspring, and thus potentially alter protein conformation of the components of the ETC. Furthermore, as both mitochondrial and chromosomal genes contribute proteins to the ETC, the genetic divergence between the gene products of these genomes could also affect ATP output. Such outcomes have been reported for more evolutionary divergent somatic cell cybrids generated by the fusion of an enucleated somatic cell with another somatic cell (McKenzie et al. 2003).
The chromosomal genome also encodes the mtDNA-specific transcription and replication factors. Two key factors are mitochondrial transcription factor A (TFAM) and the mitochondrial specific DNA polymerase, polymerase gamma (POLG). Initiation of mtDNA replication requires the transcription of an RNA primer precursor from a start site within the D-loop of mtDNA, enhanced by TFAM (Fisher and Clayton 1985, 1988). POLG then begins replication from the RNA primer and extends along the template (Lee and Clayton 1996; Xu and Clayton 1996). For high fidelity polymerization, both the catalytic subunit (POLGA; Gray and Wong 1992) and the accessory subunit (POLGB; Gray and Wong 1992) are required.
In the fertilized mouse embryo, mtDNA replication is initiated at the late blastocyst stage (Piko and Matsumoto 1976; Piko and Taylor 1987). This marks the final stage of preimplantation development and is characterized by the blastomeres having differentiated into either the trophectoderm or the pluripotent inner cell mass cells (Nagy et al. 2003). This is morphologically distinct to the preceding stage, the morula. More recently, an early round of mtDNA replication was reported at the two-cell stage (McConnell and Petrie 2004), which coincides with activation of the murine embryonic genome (Bolton et al. 1984). However, a subsequent report contended that mtDNA replication factors were not upregulated until the morula/blastocyst stages of in vitro fertilized (IVF) murine embryos and that there was no mtDNA replication during preimplantation development (Thundathil et al. 2005). In bovine IVF embryos, TFAM activity is upregulated at the morula stage in readiness for the increased numbers of mtDNA copies observed at the blastocyst stage (May-Panloup et al. 2005). In contrast, initial observations have indicated premature expression of POLGA and TFAM in preimplantation ovine NT embryos when compared with IVF counterparts (Lloyd et al. 2006). In similar NT embryos, donor cell mtDNA persisted in blastocysts generated with donor cells containing both their full complement of mtDNA (mtDNA+) and those depleted to residual levels (mtDNAR) prior to reconstruction (Lloyd et al. 2006) suggesting that the donor cell was still expressing POLG and TFAM in the preimplantation embryo and thus preferentially replicating its own mtDNA population.
We hypothesize that mtDNA replication factors encoded by the donor cell are upregulated during preimplantation development of NT embryos. This is likely to be more so in embryos generated by mtDNAR cells where the donor nucleus would be attempting to restore its own mtDNA population. In a more diverse genetic model, this would result in either the premature replication of donor cell mtDNA in the preimplantation embryo due to the closer nucleo-mitochondrial genetic compatibility between the donor cell and its own mtDNA population or embryonic arrest due to the lack of compatibility between the donor cell and the recipient oocyte. We have therefore generated a series of IVF and NT (mtDNA+ and mtDNAR) ovine embryos, investigated their patterns of expression for PolG and TFAM, and also analyzed the donor cell prior to NT for expression of these genes. By performing intergeneric NT, we were able to compare the developmental competence between intra- and interspecific and intergeneric NT crosses and assess whether the genetic divergence between the donor cell and recipient oocyte mtDNA populations affects preimplantation development. Finally, we have determined whether upregulation of mtDNA replication factors during early preimplantation development mediated the preferential replication of donor cell mtDNA.
MATERIALS AND METHODS
All reagents were acquired from Sigma (Dorset, UK) unless otherwise stated.
Production of cells depleted of mtDNA from primary culture:
Ovis aries (PDFF2 and SFF1) and Capra hircus (SFF2) fetal fibroblast primary cultures were depleted of mtDNA according to the protocol of King and Attardi (1996). They were cultured in Dulbecco's modified Eagle's medium containing 4500 mg/liter glucose and 1 mm pyruvate, supplemented with 10% v/v fetal calf serum (FCS), 1 mm l-glutamine, 1% v/v penicillin–streptomycin solution, and 50 μg/ml uridine. Cells were cultured in the presence (depletion) or absence (Untr) of 50 ng/ml ethidium bromide (EtBr) to generate mtDNAR and mtDNA+ donor cells for NT, respectively.
Oocyte recovery and in vitro maturation (IVM):
Ovine ovaries were collected from a local slaughterhouse and transported to the laboratory in PBS at 25°. Cumulus–oocyte complexes (COCs) were obtained by aspiration of 3–8 mm follicles. COCs with dark evenly granulated cytoplasm and surrounded by 3–4 layers of cumulus cells were selected for in vitro maturation in culture medium TCM 199 (Gibco, Bristol, UK) supplemented with l-glutamine (100 mg/liter; Sigma Chemical, St. Louis), NaHCO3 (3 g/liter), Hepes (1400 mg/liter), pyruvate (250 mg/liter), l-lactic-Ca-salt (600 mg/liter), and gentamycin (55 mg/liter; Gibco). Groups of 35–40 oocytes were transferred to 4-well plates (Nunc, Roskilde, Denmark) with 400 μl culture medium containing 0.01 units b-FSH and b-LH supplemented with 10% FCS. After 17 hr maturation at 39° in 5% CO2 and maximum humidity, oocytes were stripped of their cumulus cells by incubation in hyaluronidase and vortexed for 4 min. Oocytes showing a dense cytoplasm and a well-extruded polar body were selected for NT.
The NT procedure was performed essentially as previously described by Lee and Campbell (2006) with minor modifications. Briefly, oocytes were exposed for 15 min to 5 μg/ml cytochalasin B and 5 μg/ml Hoechst 33342. The metaphase chromosomes were removed within 1 hr in mPBS containing 5 μg/ml cytochalasin B and visualized under an epifluorescence microscope to confirm successful enucleation. Enucleated oocytes were maintained in maturation medium until transfer of the donor cell. For each experiment involving mtDNAR cells, the mtDNA+ cells were cultured to the same time point prior to use. Single serum starved donor cells were transferred into the perivitelline space of enucleated oocytes at 19–21 hr after maturation and the karyoplast–cytoplast complexes (KCCs) were exposed to a double electric pulse of 1.5 kV/cm for 25 μsec to initiate their fusion. KCCs were placed in the incubator in mSOF medium supplemented with 0.4% bovine serum albumin (BSA). Fusion rates were determined 30–60 min after the fusion pulse under a binocular microscope (Leica Microsystems, Buckinghamshire, UK).
Activation and embryo culture:
At 23–24 hr after in vitro maturation (2 hr postfusion), the fused KCCs were activated by a 5 min incubation in 7% ethanol followed by 5 hr culture in 10 μg/ml cycloheximide and 5 μg/ml cytochalasin B. Activated embryos were washed three times in culture medium before transfer into 100-μl drops of synthetic oviductal fluid (SOF) medium supplemented with 2% BME amino acids, 1% MEM nonessential amino acids, and 0.4% BSA, covered by paraffin oil, and cultured at 39° in a humidified atmosphere of 5% CO2, 5% O2, and 90% N2. At day 2, cleaved embryos were transferred to SOF medium supplemented with 10% FCS until day 7. For DNA analysis, if an embryo had not developed further after 24 hr it was then collected and stored for analysis. Those embryos used for the mRNA and protein analysis were collected as soon as they had reached the specific day of development required for analysis.
PCR amplification and DNA sequencing:
Total DNA was extracted from donor cells using the Puregene DNA isolation kit (Gentra Systems, Minneapolis) according to the manufacturer's cultured cells protocol. DNA was isolated from embryos by adding sterile ddH2O to a total of 4 μl followed by repeated freeze-thawing (Lloyd et al. 2006). PCR was performed in 20-μl reactions containing 2 μl oocyte DNA product or 200 ng whole cell DNA, 1× PCR buffer (Bioline, London), 1.5 mm MgCl2 (Bioline), 200 μm dNTPs (Bioline), 0.5 μm for each of the forward and reverse primers, and 2.5 units BioTaq DNA polymerase (Bioline). The ovine mtDNA D-loop was amplified with primers D1F (CTTCCCACTCCACAAGCC) and D4R (CCTCATGCATATAAGCACGTAC) to produce 543 bp; the ND1 gene was amplified with ND1F (CTCAACACTAGCAGAAACAA) and ND1R (TTAGTTGGTCGTAACGGAAT) to produce 295 bp; TFAM was amplified with ovTFAMF (GGCAGACTGGCAGGTATA) and ovTFAMR (CGAGGTCTTTTTGGTTTTCCA) to produce 164 bp; PolGA was amplified with ovPOLGAF (ACTGGCTGGACATCAGCAGT) and ovPOLGAR (GACAGTACTGCATCAGGTCC) to produce 194 bp; and PolGB with ovPOLGBF (GCCTTGGAGCACTATGTT) and ovPOLGBR (GAAGCTTCAGTCTTTTCACCG) to produce 148 bp; and inserts were ligated into the pCR4-TOPO cloning vector using primers M13F (TGTAAAACGACGGCCAGT) and M13R (CAGGAAACAGCTATGACC). Reactions were run on an MJ Research PTC-200 machine (GRI, Braintree, UK) at 95° for 5 min; followed by 35 cycles of 94° for 30 sec; annealing at 55° (D-loop), 51° (ND1), 54° (TFAM), 57° (PolGA), 53° (PolGB), and 55° (M13) for 30 sec; 72° for 30–90 sec; and a final 3 min at 72°. PCR products were resolved on 2% agarose gels (Gibco) at 100 V for 1 hr. Excised PCR product was purified using a QIAquick gel extraction kit (QIAGEN, London) according to the manufacturer's protocol. Purified PCR products were then sequenced according to the automated direct sequencing protocol (Sullivan et al. 1991) using a GeneAmp 9700 and the ABI PRISM BigDye terminator cycle sequencing ready reaction kit (Applied Biosystems, Foster City, CA) with the appropriate forward and reverse primers. Electrophoresis of cycle sequencing products was performed on an ABI PRISM 377 sequencer (Applied Biosystems).
Determination of evolutionary distance from sequence data:
Sequences were aligned using ClustalW (Thompson et al. 1994) following removal of singletons, i.e., those single nucleotide polymorphisms (SNPs) that arose in only one sequence. Aligned sequences were processed by the DNADIST program of the PHYLIP software version 3.6 (Felsenstein 2004). Pairwise evolutionary distances based on sequence differences were calculated using the F84 model which accounts for differences in empirical base frequencies and transition/transversion ratios (Felsenstein and Churchill 1996).
Real-time PCR to determine mtDNA depletion and copy number:
mtDNA copy number was determined for each total DNA sample using a Rotorgene-3000 real-time PCR machine (Corbett Research, Mortlake, Australia) and the intercalator Sybr Green. Donor cell DNA was diluted to 10 ng/μl prior to amplification. β-Actin (nuclear housekeeping gene) was amplified with β-actinF (CATGTATGTGGCCATCCAGGCTG), β-actinR (GACGCCGCAGTGGCCATCTC), and ND1 (mtDNA encoded) with NDF1 and NDR1 primers. Purified PCR product of the target gene of known concentration was used to produce standards consisting of 10-fold serial dilutions of the first standard. Each reaction contained 7.5 μl Sybr Green Absolute QPCR master mix (Abgene; Epsom, UK), 0.33 μm of each forward and reverse primer, and 2 μl DNA template at 10 ng/μl. Reaction conditions were 95° for 15 min followed by 50 cycles of 95° for 10 sec, annealing at 63° (β-actin) or 51° (ND1) for 10 sec, and 72° for 20 sec. Fluorescence data were acquired in the FAM/Sybr channel during the extension phase. To eliminate the effects of primer dimerization, a further extension of 10 sec was included, just above the melting temperature, and fluorescence data were acquired. These values were subtracted from the first acquisition phase. Melt curve analysis was performed by ramping from 72 to 99° holding for 5 sec at each step and acquiring from the FAM/Sybr channel. The number of ND1 copies in a sample was divided by the number of cells present in the sample, as calculated from β-actin, to give a value for mtDNA copy number per cell, as described by Ponchel et al. (2003). For mtDNA analysis of embryos, half of the DNA content was used for allele-specific PCR and the remaining half used to determine the number of ND1 copies or to sequence the mtDNA D-loop.
Preparation of plasmids for standards:
To generate standards for real-time PCR, purified PCR product was ligated into a pCR4-TOPO cloning vector (Invitrogen, Paisley, UK) and then replicated in Escherichia coli according to the manufacturer's protocol. TOP10 E. coli (Invitrogen) were transformed, plated, and cultured at 37° before selection of a single colony and further amplification and extraction. The bacterial plasmids were extracted from E. coli using a QIAprep miniprep kit (QIAGEN) as per the manufacturer's protocol. Plasmids were amplified with M13F and -R primers as these bind to sites either side of the insert site in the cloning vector. This allowed amplification and sequencing of the entire insert.
Allele-specific (AS) real-time PCR analysis of NT embryos:
Following DNA sequencing of the mitochondrial ND1 gene from both C. hircus (donor) and O. aries (recipient), SNPs were identified and species-specific primers were designed for each allele. Two microliters of DNA extracted from a single embryo was amplified by conventional PCR using the primers ND1F and ND1R and purified to provide the template for AS real-time PCR analysis. Purified ND1 PCR product (2 ng/μl) was used in each 20-μl reaction, which also contained 1× buffer (Bioline); 1.5 mm MgCl2 (Bioline); 800 μm dNTPs (Chemicon International, Temecula, CA); 0.5 μm of each AS primer tagged with a sequence specific to either Amplifluor SNP FAM (donor cell, capasND1: GAAGGTGACCAAGTTCATGCTATAGGGCAAATGGCCCTGCG) or JOE (recipient oocyte, ovasND1: GAAGGTCGGAGTCAACGGATTATAGGGCGAATGGTCCGGCA) and 5 μm common reverse primer (ND1F2: GCAGAAACAAACCGAGCACC); 0.5 μl of each of the 20× Amplifluor SNP FAM and JOE primers (Chemicon International) and 1 unit Thermostart DNA polymerase (Abgene). Reactions were pipetted using a CAS1200 liquid handling system (Corbett Research). Real-time PCR was performed using the Rotorgene-3000 real-time PCR machine and software (Corbett Research). Reaction conditions were 8 cycles of 95° for 120 sec, 60° for 15 sec, and 72° for 15 sec; followed by 50 cycles of 95° for 20 sec, 60° for 15 sec, and 72° for 15 sec. Fluorescence was detected in the FAM and JOE channels during the annealing phase. Samples were run alongside two sets of 10-fold dilution standards, one for each allele. Reaction sensitivity was determined by preparing a number of reactions using different proportions (100:0; 50:50; 95:5; 99:1; 99.9:0.1; and 99.99:0.01%) of SFF1 and SFF2 ND1 purified PCR product inserted into plasmids. Each sample was quantified in both the FAM and JOE channels to allow the percentage of donor mtDNA present to be calculated.
RT–PCR analysis of donor cells and embryos:
The DNA-free RNA isolation kit for RT–PCR (Ambion, TX) was used to extract RNA from the collected donor cells. Extraction was performed according to the manufacturer's protocol using the instructions for mammalian cells with a microcentrifuge. RNA was extracted from embryos in pools of five using an RNAqueous-Micro Scale RNA isolation kit (Ambion) as per the manufacturer's protocol. RNA was incubated with DNaseI to ensure removal of contaminating DNA. Extracted RNA from cells was reverse transcribed to produce copy DNA (cDNA) using the reverse transcription system (Promega, Southampton, UK). Each reaction contained 800 ng RNA, 5 mm MgCl2, 1× RT buffer, 1 mm dNTPs, 12.5 μg/ml of each primer, 1 unit/μl RNAsin, and 0.75 unit/μl AMV reverse transcriptase. This was made up to a total volume of 20 μl sterile ddH2O. In addition, a set of reaction tubes contained all other reagents but no enzyme (no enzyme control), to control for contaminating DNA, or no RNA (no template control). The reaction was carried out at 42° for 2 hr using a MJ Research PTC-200 PCR machine. The cDNA was diluted to 10 ng/μl for use in PCR. RNA extracted from embryos was reverse transcribed using the Absolute 2-step QRT–PCR SYBR Green kit (Abgene) according to the manufacturer's protocol. The resulting cDNA was then diluted 1 in 10 in sterile ddH2O before analysis. Real-time PCR was performed using the same Sybr Green method described above for TFAM using primers ovTFAMF and ovTFAMR, PolGA with ovPOLGAF and ovPOLGAR, PolGB with ovPOLGBF and ovPOLGBR, and β-actin with β-actinF and β-actinR. For each reaction, activation was at 95° for 15 min followed by 50 cycles of 95° for 10 sec, annealing at 63° (β-actin), 54° (TFAM), 57° (PolGA), and 53° (PolGB) for 10–15 sec and an extension of 72° for 10–15 sec. A further extension for 10 sec, just above the melting temperature, acquired fluorescence data for primer dimers. This allowed fluorescence derived from primer dimers to be excluded from the mRNA values. Comparative quantitative analysis was conducted on cDNA from cells at various time points throughout EtBr depletion. For each sample, TFAM, PolGA, PolGB, and β-actin were quantified and values for PolGA, PolGB, and TFAM were normalized to β-actin to control for variations in cDNA concentration. This was achieved by incorporating the reaction efficiencies into an equation with the experimental Ct values from real-time PCR for each target gene (PolGA, PolGB, or TFAM) and the control gene (β-actin), as described by Pfaffl (2001). This therefore gave a value for relative change in a target gene concentration between each sample and the initial untreated sample.
Immunocytochemistry:
Donor cells and embryos were analyzed using specific antibodies for expression of a mitochondrial-encoded subunit of cytochrome oxidase (COX) I (Molecular Probes, Invitrogen, Paisley, UK), and the nuclear-encoded POLG (Abcam, Cambridge, UK) and TFAM (Santa Cruz Biotechnologies, Santa Cruz, CA), factors involved in mtDNA replication and transcription. Cells and embryos were fixed in 2% formaldehyde for 1 hr, permeabilized with 1% (v/v) Triton X-100 for 30 min, and blocked in PBS containing 200 mm glycine and 2 mg/ml BSA for 30 min. For donor cells, primary antibody was added and incubated for 1 hr at 37°. Primary incubation was increased to 2 hr for embryos. Cells were then washed for 30 min in 0.1% Triton X-100 and labeled with the appropriate Alexa Fluor 488 anti-mouse (COXI), 488 anti-rabbit (POLG), or 594 anti-goat (TFAM) secondary antibody (Molecular Probes). Cells and embryos were washed and then counterstained with DAPI (Vectorshield, Vector Laboratories, Burlingame, CA). Slides were viewed using an Axioplan 2 imaging system, HBO100 (Zeiss, Hertfordshire, UK), and images were captured using an AxioCam HR digital camera (Zeiss) and the Axiovision LE Rel 4.2 program (Zeiss). In addition, embryos were viewed using a Leica DM IRE2 confocal microscope with Leica TCS SP2 scanner (Leica Microsystems) and data were collected by the Leica confocal software (Leica Microsystems). For fluorescence microscopy, DAPI was excited at 395 nm and detected at 420 nm; FITC was excited at 488 nm and detected between 515 and 565 nm; and rhodamine was excited at 450 nm and detected between 580 and 590 nm. To allow comparative analysis, images of samples and negative (secondary antibody only, −2° only) controls were captured using the same gain settings, as described previously in Lloyd et al. (2006). Images of samples were then compared against the respective 2° only control. For confocal microscopy, FITC was excited at 488 nm and detected between 500 and 535 nm, and rhodamine was excited at 594 nm and detected between 600 and 700 nm. Comparative analysis of protein expression in embryos through confocal microscopy was performed as described in Lloyd et al. (2006). Briefly, the auto gain function was switched off and the same gain and photomultiplier settings were used for each embryo analyzed so that the fluorescence intensity reflected true protein levels. Furthermore, channels were adjusted to remove any bleed before the images were taken. FITC and rhodamine images were acquired at the same time so each pair of images corresponded to the same section.
Statistical analysis:
Embryo RT–PCR analysis:
A one-way ANOVA with Bonferroni's post hoc tests was performed to test for significance in levels of mRNA expression between IVF embryos of different developmental stages for each gene. A two-way ANOVA with Bonferroni's post hoc tests was performed for each gene to determine whether differences in levels of mRNA expression were significant for embryos generated by IVF or NT using either mtDNA+ or mtDNAR donor cells at each developmental stage. Both tests were performed using GraphPad Prism version 4.0. Corrected values are presented where a value of P < 0.05 was deemed to be significant.
Donor cell RT–PCR analysis:
For each donor cell line, a one-way ANOVA test with Bonferroni's post hoc test was performed using GraphPad Prism version 4.0 to test for significance in levels of mRNA expression between samples. Corrected values of P < 0.05 were deemed significant.
Embryo development:
Differences in the frequencies of embryos undergoing cleavage or developing to each developmental stage between the mtDNA+- and mtDNAR-generated embryos were determined using a Fisher's exact test. A Bonferroni correction was applied and consequently P < 0.0125 was deemed to be significant. The difference between the ability of ovine and intergeneric embryos to reach blastocyst was determined using a chi-square test, where P < 0.05 was deemed significant.
Analysis of evolutionary distance:
The relationship between evolutionary distance and the ability of embryos to reach the blastocyst stage was analyzed using logistic regression using the statistical package R. P < 0.05 was deemed significant.
RESULTS
The expression of mtDNA replication factors in IVF-derived embryos:
As IVF embryos are generated through the fusion of a sperm with an oocyte, the newly formed embryonic genome when activated will generate a series of early regulatory proteins to replace those that persisted from the unfertilized oocyte. Although the ovine embryonic genome is first activated at the 8–16-cell stage (Calarco and McLaren 1976), it is thought that mtDNA replication is first initiated at the blastocyst stage in mouse (Piko and Taylor 1987). Consequently, we hypothesized that, during ovine preimplantation embryonic development, expression of the mtDNA replication factors PolGA, PolGB, and TFAM would be tightly regulated. To this extent, we generated a series of ovine IVF embryos and analyzed them for levels of expression of mRNA (PolGA, PolGB, and TFAM) and protein (POLGA and TFAM) at different stages of preimplantation development. For comparative purposes, mRNA levels at each developmental stage were calculated relative to those levels present in the IVF blastocysts for that gene. All three genes, individually, displayed significant changes in mRNA expression throughout preimplantation development (P < 0.0001). For PolGA, mRNA levels were extremely low from the 2-cell to the 16-cell stages but significantly increased from the 16-cell to the morula stage (P < 0.001), with levels being similar at blastocyst (Figure 1A). Immunocytochemistry (ICC) for POLGA demonstrated the presence of decreasing levels of protein from the 2-cell to 16-cell stages with increased levels at blastocyst (Figure 1B).
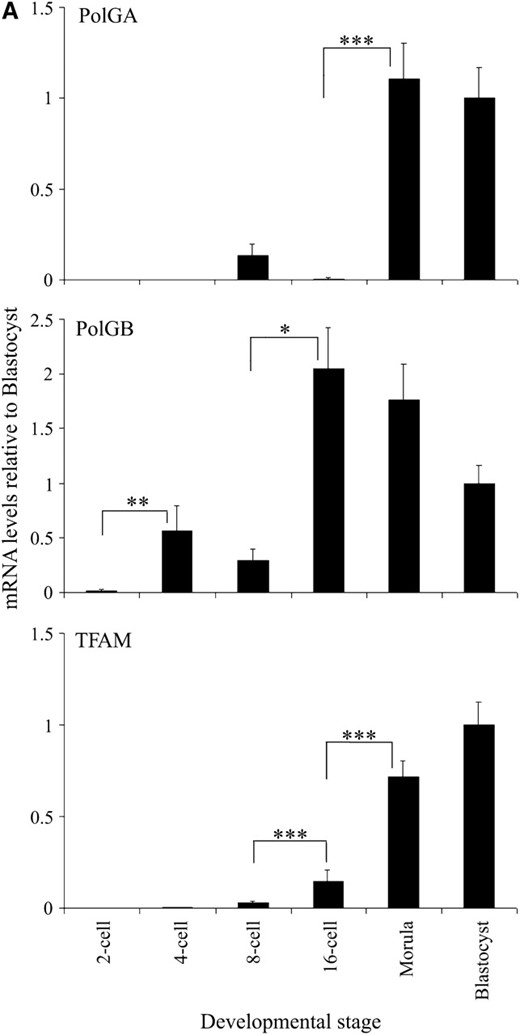
Expression of mtDNA replication factors in IVF-generated preimplantation embryos. (A) mRNA levels for PolGA, PolGB, and TFAM. For each stage of embryo development, embryos were analyzed in pools of five, where absolute mRNA levels were determined by real-time RT–PCR and then expressed relative to levels present in IVF blastocysts (mean ± SEM). Overall variation and differences between consecutive stages were analyzed for significance using a one-way ANOVA test with Bonferroni post hoc tests for each gene. Significance between individual stages of development for each gene is indicated by a bar denoted by *P < 0.05, **P < 0.01, and ***P < 0.001. (B) ICC analysis of POLGA (FITC; green; top), and TFAM (rhodamine; red; bottom) expression in 2-, 8-, and 16-cell and blastocyst stage IVF-generated embryos. Individual whole embryos were imaged with a Leica DM IRE2 confocal microscope (×63 objective and ×3 digital zoom) using identical gain and photo multiplier settings (see materials and methods). POLGA was labeled with the Alexa Fluor 488 anti-rabbit IgG secondary antibody (Molecular Probes) and excited at 488 nm and detected between 500 and 535 nm. TFAM was labeled using the Alexa Fluor 594 anti-goat secondary antibody and was excited at 594 nm and detected between 600 and 700 nm. Controls using only the secondary antibodies (2° only) showed no staining.
For PolGB, there were significant increases in mRNA expression at the 4-cell stage compared to the 2-cell stage (P < 0.01; Figure 1A) and at the 16-cell stage compared to the 8-cell stage (P < 0.05). Expression then remained fairly constant up to and including the blastocyst stage (P > 0.05). TFAM mRNA expression increased significantly between the 8-cell and 16-cell stages (P < 0.001) just after embryonic genome activation (EGA) (Figure 1A), although no protein was expressed at this stage (Figure 1B). mRNA expression increased further between the 16-cell and morula stages (P < 0.001) with the highest levels detected at the blastocyst stage, in accordance with the increased protein expression observed by ICC at this stage (Figure 1B).
The expression of mtDNA replication factors in NT-derived embryos:
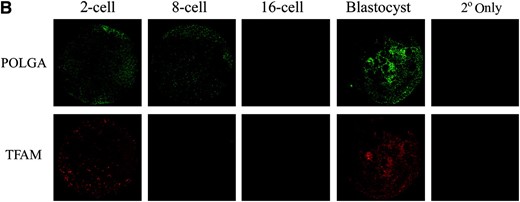
As donor cell mtDNA still persists throughout preimplantation development of mtDNA+ and mtDNAR embryos (Lloyd et al. 2006) and the donor cell is not fully reprogrammed prior to or following NT, we hypothesized that mtDNA replication factors would be upregulated in these preimplantation embryos. mRNA expression for PolGA for all IVF, mtDNA+, and mtDNAR-generated embryos was highly significantly different throughout preimplantation development (P < 0.0001). Furthermore, at the 2-cell stage, mRNA expression was significantly higher for the mtDNA+ (P < 0.001) and mtDNAR (P < 0.01) embryos when compared with the IVF embryos and was significantly lower at the morula stage (mtDNA+, P < 0.01; mtDNAR, P < 0.001; Figure 2A). The major difference between mtDNA+ and mtDNAR embryos was at the 16-cell stage. At this stage, PolGA mRNA expression was significantly higher in mtDNAR embryos compared to both mtDNA+ (P < 0.001) and IVF (P < 0.001) embryos. ICC analysis revealed that both sets of NT embryos expressed more POLGA protein between the 4-cell and 16-cell stages of preimplantation development (Figure 2B) than had been detected in IVF embryos (Figure 1B).
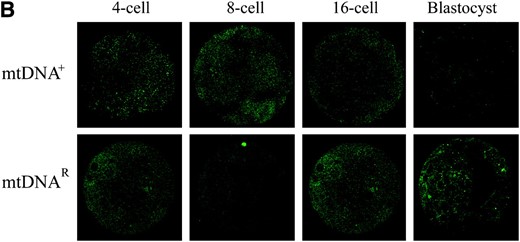
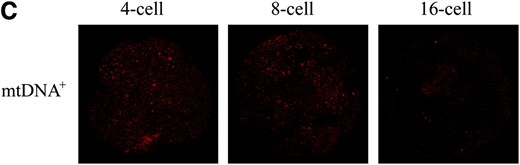
Expression of mtDNA replication factors in NT-generated preimplantation embryos. (A) mRNA levels for PolGA, PolGB, and TFAM in IVF- and NT-generated embryos. NT embryos were derived using mtDNA+ and mtDNAR donor cells. Embryos were analyzed in pools of five. mRNA levels were quantified using real-time RT–PCR and relative levels expressed as a ratio of those for IVF blastocysts (value = 1). Overall significance and significance between embryo groups at each developmental stage for each gene were determined using a two-way ANOVA test. Bonferroni post tests were then performed to determine the significance of differences between individual stages of development for each gene where *P < 0.05, **P < 0.01, and ***P < 0.001. (B) ICC analysis of 4-, 8-, and 16-cell and blastocyst stage mtDNA+ and mtDNAR preimplantation embryos for protein expression of POLGA (FITC; green). POLGA was detected with the Alexa Fluor 488 anti-rabbit IgG secondary antibody (Molecular Probes) and individual embryos were imaged using a Leica DM IRE2 confocal microscope (×63 objective and ×3 digital zoom). FITC was excited at 488 nm and emitted between 500 and 535 nm. (C) ICC analysis of TFAM (rhodamine; red) protein levels in 4-, 8-, and 16-cell stage mtDNA+ preimplantation embryos. TFAM was detected with the Alexa Fluor 594 anti-goat secondary antibody and was excited at 594 nm and emitted between 600 and 700 nm. Identical gain and photo multiplier settings were applied as described in materials and methods.
As recruitment of POLGB is necessary for high fidelity polymerization during mtDNA replication, we hypothesized that POLGB expression would also be differentially expressed to facilitate POLGA activity. PolGB mRNA expression was significantly different between each of the three embryo types throughout preimplantation development (P = 0.0063). At the 2-cell stage, mRNA levels were significantly higher for mtDNA+ (P < 0.001) and mtDNAR (P < 0.001) embryos than for their IVF counterparts. The only significant difference between the mtDNA+ and mtDNAR embryos was at the 4-cell stage where mRNA expression persisted in mtDNA+ embryos but not in mtDNAR embryos (P < 0.05). Expression at this stage was also significantly different between mtDNAR and IVF embryos (P < 0.05).
As TFAM has been proposed as a regulator of mtDNA copy number (Ekstrand et al. 2004), we hypothesized that variable mRNA expression for POLGA and POLGB would alter TFAM expression. TFAM mRNA expression was highly significantly different throughout preimplantation development between each of the three sets of embryos (P < 0.0001). TFAM was also significantly upregulated in the mtDNA+ embryos at the 2-, 4-, and 8-cell stages (P < 0.001) in comparison to their IVF counterparts. Between the IVF and the mtDNAR embryos, mRNA expression was significantly higher for the mtDNAR embryos at the 2-cell and 8-cell stages (P < 0.001). A large increase in TFAM mRNA expression was also observed at the 16-cell stage in mtDNAR embryos when compared with IVF embryos (P < 0.001), although this was not significantly different from mtDNA+ embryos (P > 0.05). This was followed by a significant reduction at the morula stage when compared with both IVF and mtDNA+ embryos (P < 0.001). The upregulation in mRNA expression is matched by the persistence of TFAM protein between the 4-cell and 16-cell stages in mtDNA+ (Figure 2C) and mtDNAR (data not shown) embryos, unlike their IVF counterparts (Figure 1B). PolGA, PolGB, and TFAM mRNA expression was similar at the blastocyst stage for each of the three embryo groups (P >0.05) as was protein expression for POLGA (Figure 2B).
Influence of mtDNA genetic divergence on development of NT embryos:
As mtDNA replication factors are upregulated in NT-derived preimplantation embryos, we hypothesized that the genetic divergence between the mtDNA haplotype of the donor cell and that of the recipient oocyte would affect development to blastocyst. Therefore, we randomly selected 58 previously generated ovine embryos consisting of 22 that arrested prior to the blastocyst stage and 36 blastocysts. These embryos were generated from two separate donor cell lines (PDFF2 and SFF1; see Lloyd et al. 2006), which had a genetic divergence of 0.0134% on the basis of mtDNA sequencing of their respective D-loops and pairwise analysis of aligned sequences in DNADIST. By measuring the mtDNA genetic distance between the donor cell and the recipient oocyte in each case, we were able to standardize the distance analyzed. Blastocysts were generated up to 0.0391% difference from the donor cell line, as determined by pairwise analysis of aligned sequences (range: 0.0022–0.0391%), while for those embryos arresting prior to the blastocyst stage the evolutionary distance ranged from 0.0112 to 0.0272%. However, logistic regression analysis determined that there was no significance difference in terms of the evolutionary distance between the donor cell line and recipient oocyte and development to blastocyst (Figure 3; embryos arresting prior to blastocyst: mean = 0.0186 ± SEM = 0.0010%; blastocyst: 0.0162 ± 0.0012%; χ2 = 1.02; P > 0.05). Consequently, failure to develop to blastocyst and the upregulation of PolGA, PolGB, and TFAM was not a result of a greater genetic divergence between some of the more distant fusion partners.
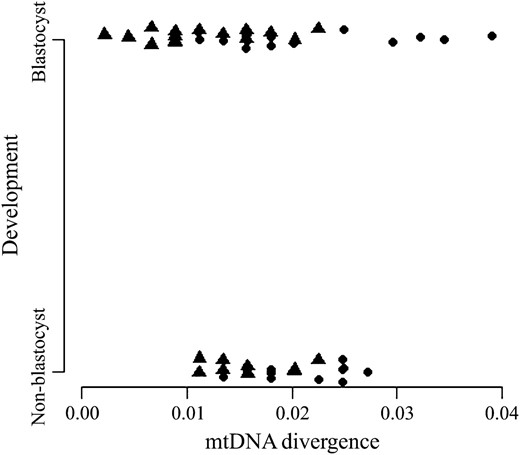
Logistic regression analysis of the relationship between evolutionary distance and development to the blastocyst stage. The evolutionary distance from the donor cell and each embryo was determined following ClustalW alignment of mtDNA sequences and pairwise analysis of sequence variations using DNADIST (see materials and methods). The embryos were divided into those that had developed to blastocyst and those that arrested prior to blastocyst (non-blastocyst). Their respective evolutionary distances were plotted and analyzed using the statistical package R. Individual embryos are represented by circles (mtDNA+) and triangles (mtDNAR).
Expression of mtDNA replication factors in ovine somatic donor cells:
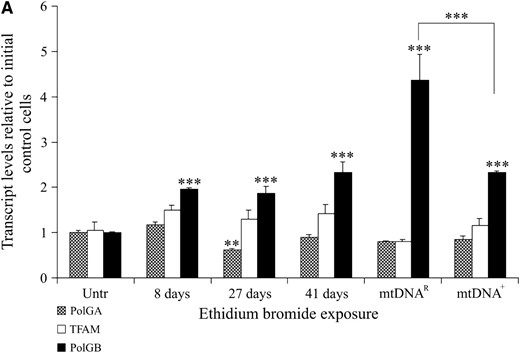
As the expression of PolGA, PolGB, and TFAM was significantly higher in NT-derived embryos compared to IVF embryos, we further hypothesized that the donor cells used for NT would still be expressing such replication factors. In this instance, we analyzed SFF1 donor cells at various stages of mitochondrial depletion, in addition to mtDNAR, mtDNA+-time matched equivalents, and initial untreated cells. In this instance, mRNA expression levels were normalized to β-actin and calculated relative to the levels present in initial untreated cells. Although there was a time-dependent significant difference between cells treated with EtBr and nondepleted controls for TFAM mRNA expression throughout the depletion process (P < 0.025; Figure 4A), the mtDNAR sample contained levels of expression very similar to that of the initial control samples (Figure 4A; P > 0.05). There was also no significant difference between the mtDNAR and the final untreated mtDNA+ cells cultured to the same time point (P > 0.05).
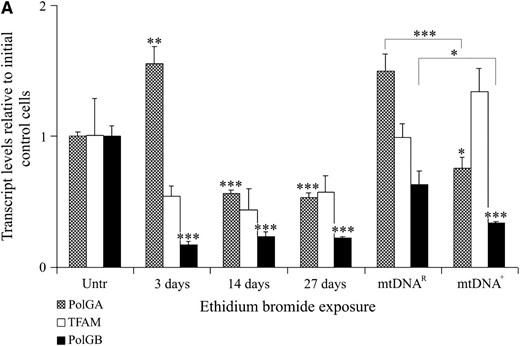
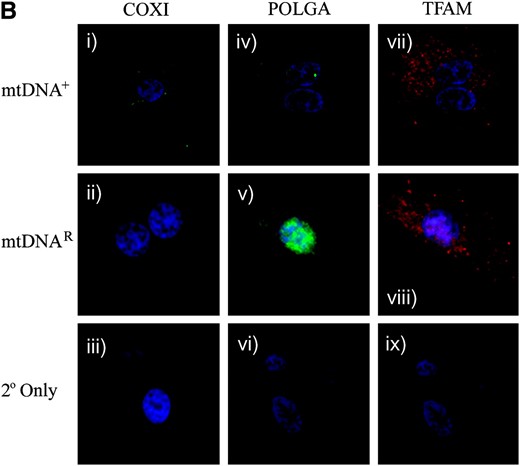
Expression of mtDNA replication factors in SFF1 (ovine) cells cultured with and without EtBr, as determined by real-time RT–PCR and ICC. (A) mRNA expression for TFAM, PolGA, and PolGB over the period of depletion was determined by real-time RT–PCR and normalized to β-actin. They were then expressed as a ratio of the initial untreated sample (Untr), which was assigned a value of 1. Mean values ± SEM are shown. Overall variation and differences between cells over time (Untr, 3, 14, and 27 days, and mtDNAR and mtDNA+) for each gene were analyzed for significance using a one-way ANOVA test. Individual post hoc tests between each stage of depletion and Untr were determined following adjustment with Bonferroni and significance was indicated above the respective stage of depletion and denoted by *P < 0.05, **P < 0.01, ***P < 0.001. The difference between the final treated (mtDNAR) and untreated (mtDNA+) samples was tested for significance in the same manner. (B) Detection of the mtDNA-encoded COXI protein by a FITC 488-conjugated secondary antibody (green; i–iii), excited at 488 nm, and detected at 515–565 nm; POLGA by a FITC 488-conjugated secondary (green; iv–vi), excited at 488 nm, and detected at 515–565 nm; and TFAM by rhodamine 594-conjugated secondary (Red; vii-ix), excited at 450 nm, and detected at 580–590 nm. Images were acquired by fluorescence microscopy (×100 objective) using an Axioplan 2 imaging system, HBO100 (Zeiss). Controls using only the secondary antibodies (2° only, iii, vi, and ix) showed no staining.
PolGA mRNA levels varied significantly throughout the depletion process (P < 0.0001). An initial increase in PolGA mRNA expression was observed after 3 days in EtBr (P < 0.01). However, following 14 and 27 days of EtBr treatment, there was significantly less mRNA expression for PolGA when compared to untreated controls (day 14, P < 0.001; day 27, P < 0.001). Although there was significantly more PolGA mRNA present in the initial untreated cells than in the mtDNA+ cells used for NT (P < 0.05), there was significantly more PolGA expression in mtDNAR cells than in mtDNA+ cells (P < 0.001). For PolGB, reduced mRNA expression was observed throughout the depletion process when compared to untreated controls (day 3, P < 0.001; day 14, P < 0.001; day 27, P < 0.001). mRNA expression for the mtDNAR population remained similar to the initial untreated cells although the expression in the mtDNA+ cells was significantly lower compared to both the initial untreated sample (P < 0.001) and the mtDNAR cells (P < 0.05). ICC staining demonstrated that POLGA (Figure 4B, iv–vi) and TFAM protein were present throughout depletion (Figure 4B, vii–ix) with more dense populations present in the mtDNAR cells (Figure 4B, v and viii). However, the mtDNA-encoded COXI was present in the mtDNA+ (Figure 4B, i) but not in the mtDNAR (Figure 4B, ii) population, further supporting the decrease in mtDNA copy number.
The effects of a more diverse donor nucleus on mtDNA replication:
As mtDNA replication factors are expressed during preimplantation development following NT, we hypothesized that they would be capable of mediating mtDNA replication. In this instance, we chose a more diverse genetic model where the mtDNA divergence between the donor cell and recipient oocyte would be outside the tested range (0.0391%) for successful development to blastocyst (Figure 3). In turn, we determined whether the donor cell would attempt to rescue its own mtDNA population, especially in mtDNAR embryos generated with low levels of donor mtDNA. To this extent, we chose a C. hircus fetal fibroblast cell line (SFF2), which we depleted with EtBr.
Unexpectedly, the untreated SFF2 cells increased mtDNA copy number throughout depletion from 1129 ± 173.5 copies at day 8 to 4276 ± 158.8 copies by day 112 (Table 1). This is in contrast to the untreated SSF1 cells where mtDNA copy number decreased from 4241 ± 411 copies per cell after 3 days to 896 ± 54.7 copies at day 95. While depletion of SFF2 cells was gradual with 361 ± 22.6 copies being present after 74 days and 152 ± 9.5 copies after 90 days, no detectable mtDNA was present after 112 days in EtBr. In contrast, mtDNA copy number decreased rapidly in SFF1 cells to 464 ± 41.6 copies after 3 days. This was further reduced to 40 ± 0.5 copies after 14 days followed by more gradual depletion (Table 1).
Real-time PCR quantification of mtDNA copy number in SFF1 and SFF2 cells undergoing treatment with EtBr
No. days in EtBr | ||||
|---|---|---|---|---|
| 3 | 14 | 56 | 95 | |
| SFF1 | ||||
| EtBr treated | 464 ± 41.6 | 40 ± 0.5 | 10 ± 1.6 | 6 ± 0.7 |
| Untreated control | 4241 ± 411.0 | 1168 ± 75.7 | 2146 ± 47.0 | 896 ± 54.7 |
No. days in EtBr | ||||
|---|---|---|---|---|
| 3 | 14 | 56 | 95 | |
| SFF1 | ||||
| EtBr treated | 464 ± 41.6 | 40 ± 0.5 | 10 ± 1.6 | 6 ± 0.7 |
| Untreated control | 4241 ± 411.0 | 1168 ± 75.7 | 2146 ± 47.0 | 896 ± 54.7 |
| No. days in EtBr | |||||
|---|---|---|---|---|---|
| 8 | 41 | 74 | 90 | 112 | |
| SFF2 | |||||
| EtBr treated | 1092 ± 43.7 | 1090 ± 64.9 | 361 ± 22.6 | 152 ± 9.5 | 0 ± 0 |
| Untreated control | 1129 ± 173.5 | 2888 ± 830.5 | 2178 ± 78.9 | 3393 ± 126.2 | 4276 ± 158.8 |
| No. days in EtBr | |||||
|---|---|---|---|---|---|
| 8 | 41 | 74 | 90 | 112 | |
| SFF2 | |||||
| EtBr treated | 1092 ± 43.7 | 1090 ± 64.9 | 361 ± 22.6 | 152 ± 9.5 | 0 ± 0 |
| Untreated control | 1129 ± 173.5 | 2888 ± 830.5 | 2178 ± 78.9 | 3393 ± 126.2 | 4276 ± 158.8 |
Numbers are mean mtDNA copies per cell.
To verify that the SSF2 donor cells continued to express mtDNA replication factors throughout the depletion process, these cells were analyzed at various stages, as were mtDNAR, mtDNA+, and the initial untreated cells, for mRNA (PolGA, PolGB, and TFAM; Figure 5A) and protein expression (POLGA and TFAM; Figure 5B). mRNA expression for PolGA differed significantly over time (P < 0.0001). Although during depletion PolGA mRNA expression was reduced after 27 days (P < 0.01) and then remained at similar levels, there were no significant differences between the initial untreated and the mtDNA+ and mtDNAR populations (P > 0.05). PolGB expression was significantly higher throughout EtBr treatment in comparison to initial control cells (P < 0.001). While mRNA expression was significantly higher than the initial untreated population for both mtDNA+ and mtDNAR populations (P < 0.001), the mtDNAR cells contained even greater levels than the mtDNA+ cells (P < 0.001). TFAM mRNA expression remained similar throughout exposure to EtBr and in untreated cells (P = 0.065). ICC analysis demonstrated the continued expression of POLGA and TFAM in mtDNAR donor cells (Figure 5B, v and viii, respectively), as in mtDNA+ cells (Figure 5B, iv and vii, respectively). Furthermore, COXI protein was detected in mtDNA+ cells (Figure 5B, i) throughout the culture period but was absent from mtDNAR cells (Figure 5B, ii), further demonstrating the lack of mtDNA for transcription and synthesis into protein.
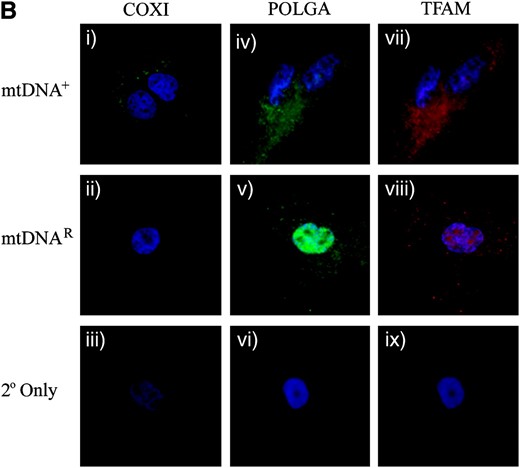
Expression of mtDNA replication factors in SFF2 (caprine) cells cultured with and without EtBr. (A) mRNA levels for TFAM, PolGA, and PolGB were determined by RT–PCR and real-time PCR throughout the period in culture (Untr, 8, 27, and 41 days, and mtDNAR and mtDNA+) and normalized to β-actin. mRNA levels are presented relative to Untr (value = 1). Bars represent mean ± SEM. Overall variation and differences between individual samples during the period in culture were analyzed for significance using a one-way ANOVA test with Bonferroni post hoc tests for each gene. Individual time points significantly different from Untr were denoted by **P < 0.01 and *** P < 0.001. The difference between the final treated (mtDNAR) and untreated (mtDNA+) samples was also tested by Bonferroni post hoc tests and significance is indicated by adjoining lines. (B) Detection of the mtDNA-encoded COXI protein using a FITC 488-conjugated secondary antibody with excitation at 488 nm and emission at 515–565 nm (green; i–iii). POLGA was detected using a FITC 488-conjugated secondary antibody (green; iv–vi) at 488 nm for excitation and emission at 515–565 nm while TFAM was detected with a rhodamine 594-conjugated secondary antibody with excitation at 450 nm and emission at 580–590 nm (red; vii–ix). Images were acquired at ×100 objective using an Axioplan 2 imaging system, HBO100 (Zeiss). Controls using only the secondary antibodies (2° only; iii, vi, and ix) showed no staining.
mtDNAR cells containing a mean (± SEM) of 152 ± 9.5 mtDNA copies per cell following 90 days exposure (Table 1) and time-matched equivalent mtDNA+ cells were introduced into enucleated ovine oocytes. In total, 119 mtDNAR embryos and 116 mtDNA+ time-matched equivalent embryos were generated (see Table 2). Significantly more mtDNAR embryos completed fusion (P = 0.01), and marginally more advanced to the 2-cell stage (P > 0.0125) but not to the 4–12-cell stage (P > 0.0125). Although significantly more mtDNAR embryos reached the post-16-cell stage (P < 0.002; Table 2), indicating that the mtDNAR cells had more readily completed EGA, no embryos continued development through to the blastocyst stage.
Developmental competence of intergeneric NT embryos reconstructed using ovine oocytes with mtDNA+ and mtDNAR SFF2 donor cells
Donor cells | Replicates | Fused couplets (%) | Cleavage2-cells (%) | >4–12 cells(%) | >16 cells(%) | Morula and blastocyst (%) |
|---|---|---|---|---|---|---|
| mtDNA+ | 3 | 95/116 (81.9) (a) | 52/95 (54.7) (a) | 28/41 (68.3) (a) | 6/41 (14.6) (a) | 0 |
| mtDNAR | 3 | 111/119 (93.3) (b) | 76/111 (68.4) (a) | 57/76 (74) (a) | 24/51 (47) (b) | 0 |
In each case, the numbers of embryos that reached a particular stage of development are expressed as a fraction of the total number of embryos available to develop to that stage with percentage values stated in parentheses. The variability in numbers for each stage of development is due to a proportion of embryos being harvested at each stage of development for analysis. mtDNA+ donor cells were cultured to the same time point as mtDNAR cells. Significance is denoted by letters (a and b) where the two letters for a particular developmental stage differ, as determined using a Fisher's exact test. Where both letters are “a”, significance was not found (P > 0.0125 after Bonferroni correction for multiple comparisons). The number of fused couplets was significantly different between the two embryo cohorts (P = 0.01). There were no significant differences between groups of embryos that cleaved or those at the 4–12-cell stages (P > 0.0125). A significantly greater number of embryos developed to the >16-cell stage for mtDNAR than for mtDNA+ (P < 0.002). No embryos reached the morula or blastocyst stage of development.
DNA sequencing and calculation of evolutionary distance by pairwise analysis of sequences showed that the mtDNA divergence between the donor cell line and the recipient oocytes ranged from 0.4047 to 0.4220% with a mean of 0.4114%. The mean distances between those embryos produced using mtDNAR donor cells were not significantly greater than those of the mtDNA+ embryos (0.4123 and 0.4086%, respectively). This again suggests that the mtDNA haplotype of the recipient oocytes did not bias this outcome. However, the increased genetic distance between the donor cell line and recipient oocyte resulted in no blastocyst formation, which was significantly different to the ovine–ovine NT blastocyst rate (χ2 = 50.8; P < 1 × 10⁻¹²).
To determine whether POLG persisted throughout early preimplantation development of these embryos, we analyzed mtDNAR and mtDNA+ embryos for protein expression (Figure 6). Both sets of embryos expressed POLGA from the 1- to 12-cell stages (Figure 6: mtDNA+, x–xii; mtDNAR, xxi–xxiii), although levels appeared to be slightly higher in the mtDNA+ embryos from the 5- to 12-cell stages (Figure 6, xi and xii) than in the mtDNAR embryos (Figure 6, xxii and xxiii). Similar outcomes were observed for COXI (Figure 6: mtDNA+, ii and iii; mtDNAR, xiv and xv), demonstrating that the mtDNA was being transcribed and synthesized into protein.
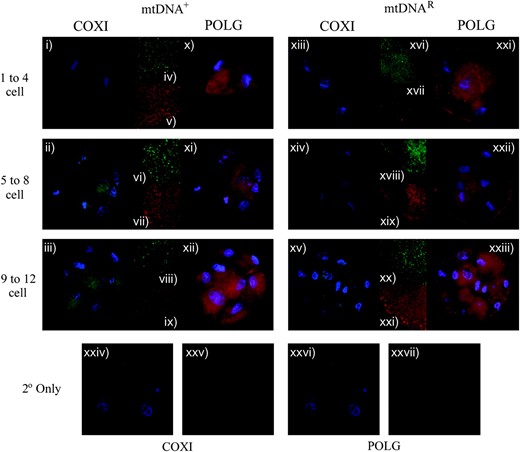
The expression of COXI and POLG in preimplantation NT embryos generated using O. aries oocytes and C. hircus donor cells containing either mtDNA+ (i–xii) or mtDNAR (xiii–xxiii) cells. The mtDNA-encoded COXI antibody was detected using a FITC 488-conjugated secondary antibody by excitation at 488 nm and emission at 515–565 nm (i–iii for mtDNA+ embryos and xiii–xv for mtDNAR embryos). POLG was detected using a rhodamine 594-conjugated secondary antibody following excitation at 450 nm and emission at 580–590 nm (x–xii for mtDNA+ embryos and xxi–xxiii for mtDNAR embryos). Embryos were also counterstained with DAPI, which was excited at 395 nm and detected at 420 nm. Whole embryos were imaged at ×100 on an Axioplan 2 imaging system (Zeiss). Additionally, confocal microscopy using a Leica DM IRE2 (×63 objective, ×2 digital zoom) allowed imaging at higher magnification to confirm the presence of the two proteins, COXI (iv, vi, and viii for mtDNA+ embryos; xvi, xviii, and xx for mtDNAR embryos) and POLG (v, vii, and ix for mtDNA+ embryos; xvii, xix, and xxi for mtDNAR embryos). For confocal, FITC (COXI) was excited at 488 nm and detected between 500 and 535 nm, and rhodamine (POLGA) was excited at 594 nm and detected between 600 and 700 nm. Controls using only the secondary antibodies (2° only and DAPI) for COXI (xxiv) and POLG (xxvi) showed no staining under fluorescence microscopy. Additionally, each 2° only was imaged under confocal microscopy (without DAPI staining) for COXI (xxv) and POLG (xxvii).
To determine whether donor cell mtDNA was being replicated due to the persistence of POLG, we first determined the rates of heteroplasmy for both sets of embryos. AS–PCR of the ND1 gene, which possessed species-specific polymorphic variants, detected donor cell mtDNA as low as 0.01% (Figure 7, A–C). Donor cell mtDNA was detected in only 4 of the 38 NT embryos analyzed (Table 3). The 4 heteroplasmic zygotes and embryos were then analyzed for total mtDNA copy number using real-time PCR. Assuming that the mtDNA+ donor cells possessed 3393 mtDNA copies while mtDNAR cells possessed 152 copies per cell (Table 1), the two 1-cell embryos (one mtDNA+ and one mtDNAR) did not increase their donor cell mtDNA copy number. However, the 12-cell mtDNA+ embryo possessed 78,800 copies of mtDNA (Table 3), representing a 23-fold increase. For the 20-cell mtDNAR embryo, the 3.42% donor mtDNA contribution represented a 125-fold increase.
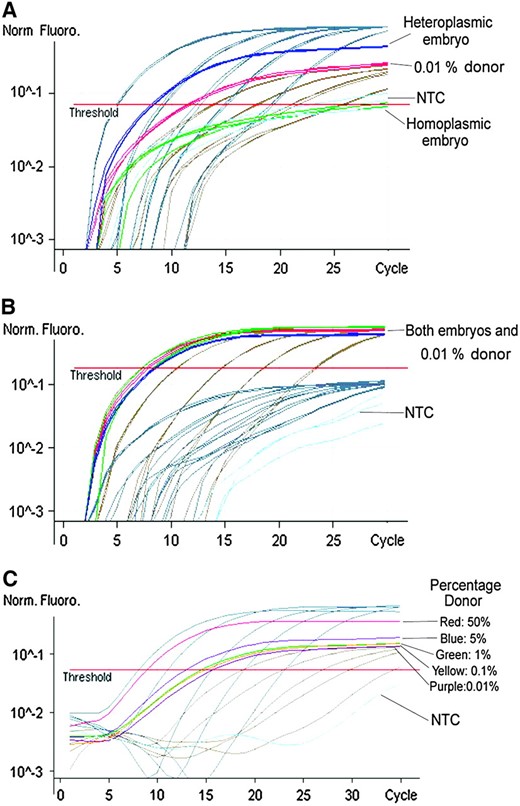
Determination of homoplasmy/heteroplasmy in caprine–ovine NT embryos by AS–PCR. Fluorescence was acquired in both the FAM (A) and the JOE (B) channels for the donor and recipient oocyte alleles, respectively. Each reaction was considered valid only if the 0.01% allele for donor mtDNA was detected in the FAM channel (A). Each sample was analyzed against a set of standards with known molecular concentrations for each allele and a sample containing 0.01% donor allele (A) and 99.99% recipient allele (B: 0.01% donor). In each of A, B, and C, both donor-specific (gray) and recipient-specific (beige) standards are shown. (C) The sensitivity of the reaction to 0.01% was determined by decreasing amounts of the donor-specific allele in relation to the recipient oocyte allele (100:0, 50:50, 5:95, 1:99, 0.1:99.9, 0.01:99.99, and 0:100%). In each channel, the 100% reaction was equivalent to the highest concentration standard for the respective allele. NTC, no template control.
Percentage of donor mtDNA persisting in intergeneric NT embryos
Donor cell | 1 cell | 2 cell | 3 cell | 4 cell | 8 cell | 12 cell | 16 cell | 20 cell |
|---|---|---|---|---|---|---|---|---|
| mtDNA+ | 0.00 (n = 4) | 0.00 (n = 1) | 0.00 (n = 1) | 0.00 (n = 3) | 0.00 (n = 1) | 0.00 (n = 3) | 0.00 (n = 1) | ND |
| 0.03 (n = 1) | 19.99 (n = 1) | |||||||
| mtDNAR | 0.00 (n = 9) | 0.00 (n = 3) | ND | 0.00 (n = 3) | ND | 0.00 (n = 3) | ND | 0.00 (n = 2) |
| 0.06 (n = 1) | 3.42 (n = 1) |
The percentage of donor mtDNA present in individual embryos was determined by AS real-time PCR. Each reaction was run in triplicate and performed at least twice with a minimum sensitivity of 0.01% for the donor allele (see Figure 7). Values of 0.00 are equivalent to homoplasmy; other values represent heteroplasmy. The number of embryos for each stage is given in parentheses (n). ND, not determined/no data.
DISCUSSION
Expression of mtDNA replication factors in IVF and NT embryos:
Following natural fertilization, mtDNA is normally inherited through the oocyte (Birky 1995) while NT-derived embryos and offspring inherit either recipient oocyte mtDNA only (Evans et al. 1999) or a combination of both donor cell and recipient oocyte mtDNA (Steinborn et al. 1998, 2002, Hiendleder et al. 1999; Lloyd et al. 2006). As there are currently no mechanisms to explain why variable levels of donor cell mtDNA are transmitted, we first determined whether NT embryos regulate mtDNA replication in a manner similar to IVF embryos. Our findings that fertilized ovine oocytes downregulate their expression of mtDNA replication factors so that little or no replication is possible during the early stages of preimplantation development are similar to observations in bovine embryos for TFAM (May-Panloup et al. 2005) and for TFAM, PolGA, and PolGB in murine (Thundathil et al. 2005) and porcine embryos (Spikings et al. 2007). This onset in mtDNA replication factor expression is a post-EGA event. However, as with porcine embryos (Spikings et al. 2007), we observed a transient increase in PolG expression in ovine embryos to coincide with the onset of ovine EGA at the 8-cell stage (Calarco and McLaren 1976). In murine embryos, turnover of mtDNA has been observed at the 2-cell stage (McConnell and Petrie 2004), again in accordance with the onset of EGA (Bolton et al. 1984).
Unlike IVF embryos, the NT embryos generated with both mtDNA+ and mtDNAR cells were unable to tightly regulate mtDNA replication factor expression. In NT embryos, TFAM, PolGA, and PolGB were all being transcribed at significantly higher levels at the 2-cell stage for both mtDNA+ and mtDNAR embryos and that protein synthesized for POLGA and TFAM at this stage persisted through to the 16-cell stage. This most likely accounts for the persistence of the donor mtDNA identified in blastocysts, which would otherwise be diluted out (Steinborn et al. 1998). This is especially so as the somatic donor cell would contribute up to ∼4000 mtDNA copies (see Table 1) compared with a minimum of 100,000 oocyte copies required to support fertilization and early preimplantation embryonic division (El Shourbagy et al. 2006). Furthermore, the significantly greater expression of TFAM and PolGA mRNA in mtDNAR embryos at the 16-cell stage most likely promotes the persistence of residual levels of donor cell mtDNA that was previously reported for mtDNAR-derived blastocysts (Lloyd et al. 2006). This early burst of mtDNA replication is not just limited to somatic cell nuclear transfer. Indeed, other oocyte reconstruction protocols, such as the transfer of murine zygotic karyoplasts into enucleated oocytes, have demonstrated increasing levels of donor mtDNA throughout preimplantation development (Meirelles and Smith 1998). Furthermore, sperm mtDNA, which contributed to the donor blastomere used to derive cloned non-human primates, was also detected in such offspring (St. John and Schatten 2004).
The role of donor cell mtDNA replication factors:
It is unlikely that the mRNA and protein expression for the mtDNA replication factors observed in NT embryos originated from the oocyte prior to NT. Several factors support this hypothesis. First, PolGA, PolGB, and TFAM are all downregulated during the final stages of oocyte maturation in those oocytes that are capable of fertilization, unlike those that fail to fertilize (Spikings et al. 2007). Second, mRNA for PolGA, PolGB, and TFAM were not present at the 2-cell stage in our ovine IVF embryos (Figure 1A), although some protein expression was present at the 2-cell stage (Figure 1B) but not at the 4-cell stage (Lloyd et al. 2006). Third, mtDNA copy number is considerably reduced throughout early preimplantation development and returns to prefertilization levels only at the morula and blastocyst stages (May-Panloup et al. 2005; Spikings et al. 2007). Consequently, the expression of the mtDNA replication factors observed in the donor cells prior to NT (Figures 4 and 5) most likely accounts for the continued expression during early preimplantation development.
Interestingly, though, the use of donor cells from varying time points during the culturing process may have induced other patterns of expression in the NT embryos. The SFF1 cell line showed marked changes in the expression of mtDNA replication factors, especially for PolGA and PolGB. However, long-term culture appeared to not have an effect on the expression of TFAM for either cell line while undergoing depletion (SFF1, Figure 4; SFF2, Figure 5) or for PolGA in SFF2 cells (Figure 5). While we have not observed significant changes in TFAM, others have, for example, observed compensatory mechanisms that either upregulated mRNA levels for TFAM in cells of patients with a mitochondrial disorder (Joseph et al. 2004) or reduced TFAM protein in mtDNA-depleted cells (Seidel-Rogol and Shadel 2002; Joseph et al. 2004). However, in accordance with our observations, PolG has been previously demonstrated to persist in cells completely depleted of their mtDNA copy (Davis et al. 1996).
The effects of genetic diversity on replication of donor cell mtDNA:
Although from our intergeneric model both mtDNA+ and mtDNAR embryos expressed mtDNA replication factors, it is evident that the vast majority of embryos failed to replicate their donor mtDNA population. Consequently, these embryos were homoplasmic for recipient oocyte mtDNA or exhibited levels of heteroplasmy below the limit of detection (0.01%). However, in a few embryos, some donor mtDNA was detected at considerably increased levels, clearly indicating the occurrence of premature mtDNA replication. While this could result from the close proximity of the somatic mtDNA to the nucleus (Davis and Clayton 1996), this is likely to have occurred only prior to the first cleavage stage, as the donor mtDNA will have dispersed to varying regions of the cytoplasm in the newly formed blastomeres (Fulka 2004). Consequently, in these exceptional cases, it is more likely that the nuclear-encoded replication factors interacted with their own mtDNA more efficiently and hence replicated it preferentially, especially as POLG was expressed throughout early development for both mtDNA+ and mtDNAR embryos (see Figure 6).
Development of intergeneric embryos:
The fusion of caprine donor cells with ovine recipient oocytes resulted in no embryos progressing through to blastocyst, which matched the outcomes for some intergeneric NT derivations (Chang et al. 2003; Jiang et al. 2004, 2005) but not for others (Chen et al. 2002; Yang et al. 2003; Liu et al. 2004). However, those embryos derived from mtDNAR donor cells persisted to the >16-cell stage to a significantly greater extent than the mtDNA+ embryos. The importance of this outcome is twofold. First, the mtDNAR embryos appeared to more readily complete EGA, unlike the mtDNA+ populations. Second, it has been demonstrated that somatic cell mtDNA can impair embryonic development while supplemented ooplasm containing mitochondria does not (Takeda et al. 2005). Consequently, the elimination of the vast majority of the donor mtDNA reduced the potential competition between the two populations of mtDNA, suggesting that the caprine mtDNA replication factors would need to transcribe and synthesize mainly ovine mtDNA to generate sufficient protein to contribute to the ETC. This is most likely to occur at the post-16-cell stage when transcription and protein synthesis of mtDNA replication factors normally take place in IVF embryos, i.e., post-EGA. As mtDNA replication and embryonic arrest coincide here, it suggests that nucleo-mitochondrial incompatibility between the mtDNA replication factors and the mtDNA genome could have accounted for subsequent failure to blastocyst.
The effects of evolutionary divergence on embryo development:
By analyzing three sets of embryos, two generated with one of two ovine donor cell lines with randomly selected ovine recipient oocytes and one with a caprine donor cell line and ovine oocytes, we were further able to determine that evolutionary distance influences embryonic development. The inability of the caprine–ovine embryos to reach blastocyst exemplified the incompatibility between the caprine nucleus and ovine oocyte mitochondria, which probably arose from the continuous decline in OXPHOS function as divergence increased (McKenzie et al. 2003). Indeed, it is evident that crosses within a certain genus are potentially within an acceptable evolutionary distance as evidenced by the live birth following the fusion of an O. musimon donor cell with an O. aries oocyte (Loi et al. 2001). In this instance, the evolutionary distance was <2 million years (Hiendleder et al. 1998). However, by increasing the evolutionary distance to 5–7 million years, as reported between Ovis and Capra (Randi et al. 1991), it was unlikely that this intergeneric combination would yield complete preimplantation development, especially as the interspecific fusion between C. ibex donor cells and C. hircus oocytes resulted in development to only the morula stage (Jiang et al. 2004).
The effects of evolutionary divergence on function:
Embryos derived from genetically divergent fusion partners are likely to be compromised by (i) the compatibility of the two mitochondrial populations, where sequence variants between subspecies can encode for different amino acids (Steinborn et al. 2002; St. John et al. 2005); and (ii) the potential incompatibility between the nuclear-encoded proteins of the ETC and the mtDNA-encoded genes that contribute proteins to each of the complexes except complex II. Indeed, the restrictions on nucleo-mitochondrial divergence are perhaps best exemplified by fusion of an enucleated somatic cell with another somatic cell to generate cybrids. The ability of nuclei from Homo sapiens to transcribe and replicate mtDNA from Gorilla gorilla, Pan troglodytes, and P. paniscus in cybrid cell lines verified a level of compatibility between these species (Kenyon and Moraes 1997). However, resultant lines demonstrated decreases in both oxygen consumption and complex I activity of the ETC (Barrientos et al. 1998). Similar outcomes have been observed for Mus musculus cybrids containing Rattus norvegicus mtDNA. These exhibited slower growth and respiratory rates than the parental cell lines or those cybrids containing M. spretus mtDNA (Dey et al. 2000). To this extent, complexes I and IV of the ETC had a 50% reduction in activity in these cell lines, clearly demonstrating OXPHOS disassembly and dysfunction. In the case of the more divergent mtDNA from Pongo pygmaeus under the control of a nucleus from H. sapiens, evolutionary distance was too great to support cybrid formation and mtDNA replication (Kenyon and Moraes 1997).
In conclusion, we have demonstrated the strict regulation of mtDNA replication factors during preimplantation development of IVF embryos. However, NT embryos abnormally express such replication factors due to the continued expression of mtDNA replication factors by the donor cell during preimplantation development. This would account for the premature replication of donor mtDNA prior to the blastocyst stage of development in intra- and interspecific crosses. It is evident that, while crosses between different species or haplotypes of the same species can be achieved in some but not all cases, nucleo-mitochondrial interactions become suboptimal once a certain evolutionary distance is exceeded. This affects development to blastocyst and, in the vast majority of cases, results in the elimination of donor cell mtDNA, although those embryos generated with mtDNAR cells are more likely to reach the 16+-cell stage.
Footnotes
Present address: Animal Development and Biotechnology Group, Division of Applied Life Science, College of Agriculture and Life Science, Gyeongsang National University, 900 Gajwadong, Jinju, 600-701, South Korea.
Present address: Institute of Zoology, Zoological Society of London, Regents Park, London NW1 4RY, UK.
Footnotes
Communicating editor: D. M. Rand
References
Birky, Jr., C. W.,
Bolton, V. N., P. J. Oades and M. H. Johnson,
Calarco, P. G., and A. McLaren,
Felsenstein, J.,
Fisher, R. P., and D. A. Clayton,
Giles, R. E., H. Blanc, H. M. Cann and D. C. Wallace,
Hauswirth, W. W., and P. J. Laipis,
Humpherys, D., K. Eggan, H. Akutsu, A. Friedman, K. Hochedlinger et al.,
Jiang, Y., S. Z. Liu, Y. L. Zhang, M. X. Jiang, Q. Y. Sun et al.,
Kenyon, L., and C. T. Moraes,
Nagy, A., M. Gertsenstein, K. Vintersten and R. Behringer,
Ponchel, F., C. Toomes, K. Bransfield, F. T. Leong, S. H. Douglas et al.,
