


Abstract
The inference of transmission pathways for medicinally important bacteria is important to our understanding of pathogens. Here we report analyses of transmission in Helicobacter pylori, a major carcinogen. Our study is novel in that the focal community comprises detailed family pedigrees and has a high prevalence of H. pylori. To infer transmission, we performed high-resolution analyses of nucleotide sequences for three genes and accounted for the occurrence of mutation and recombination through the use of simulation modeling. Our results demonstrate that transmission has a strong nonfamilial component potentially the result of a large proportion of infections derived from the community. These results are interesting from both a medical and an evolutionary standpoint. First, efficient control measures and beliefs about the sources of H. pylori infection should be reevaluated. Evolutionarily, our results contradict the hypothesis of strict vertical transmission, presented as an explanation for the strong correlation between human population history and H. pylori diversity. Thus the paradox of persistent phylogenetic structure, despite a permissive mode of transmission and high recombination rates, must be solved elsewhere. Here we consider the potential for recombination events to maintain genetic structure in light of horizontal transmission.
HELICOBACTER pylori is a gram-negative bacterium that colonizes the gastric mucosa (Goodman and Correa 1995). This infection is associated with chronic gastritis, peptic ulcer disease, mucosa-associated lymphoid tissue lymphoma, and gastric adenocarcinoma, has a major impact on public health (Alm et al. 2000), and has been classified as a group I carcinogen by the International Agency for Research on Cancer (NIH Consensus Development Panel 1994). Although much is known about the virulence of H. pylori (Covacci et al. 1999), the potential transmission pathways for the bacterium are unresolved (Goosen et al. 2002; Dowsett and Kowolik 2003). Potential transmission routes include oral–oral and fecal–oral, both with and without intermediate transmission steps. These transmission pathways are supported by a plethora of studies demonstrating the presence of H. pylori isolates, either by culturing or PCR techniques, in both the mouth environment (Dowsett and Kowolik 2003) and stool samples (Thomas et al. 1992; Kelly et al. 1994; Parsonnet et al. 1999). Further clues regarding transmission lie in the fact that infection is more prevalent in developing countries, where it can assume epidemic proportions with up to 80% of the population being infected (Alm et al. 1999). Such observations suggest that H. pylori infection may be associated with low socioeconomic status and overcrowded living conditions, as has been suggested previously (Suerbaum and Michetti 2002). Transmission studies in developed countries suggest a person-to-person mode of transmission (Suerbaum and Michetti 2002). Furthermore, epidemiological and DNA-based studies have suggested that a parent–offspring transmission pathway, mostly mother to child, is responsible for transmission within the family and that infection outside the family rarely occurs (Drumm et al. 1990; Bamford et al. 1993; Rothenbacher et al. 1999; Suerbaum and Michetti 2002; Samir et al. 2004).
Given that developed countries have shown a decrease in H. pylori incidence without targeted intervention (Parsonnet et al. 1992; Banatvala et al. 1993), the status quo of H. pylori and its transmission route should be addressed in developing countries where incidence is high and the bacterium continues to present itself as a serious health concern. Understanding the transmission process is an essential step toward controlling the spread of H. pylori. Previous transmission studies of H. pylori have been conducted in low-incidence study populations related to their socioeconomic status (Rothenbacher et al. 1999; Tindberg et al. 2001), with small within-family sample sizes (Rothenbacher et al. 1999; Samir et al. 2004; Raymond et al. 2004), and using low-resolution methods for the inference of transmission (Rothenbacher et al. 1999; Tindberg et al. 2001; Samir et al. 2004). These characteristics should be further explored. First, poor sanitation, overcrowding, and generally low socioeconomic status are factors that determine susceptibility to H. pylori infection (Everhart 2000; Bunn et al. 2002; Suerbaum and Michetti 2002). Thus transmission should be evaluated in high-prevalence communities. Second, few studies have compared H. pylori genotypes from both parents and several children within individual families (Rothenbacher et al. 1999; Samir et al. 2004). The observation of transmissions from a mother to each of her children should be the means by which the route of infection is evaluated such that one can distinguish socially mediated transmission from a strictly vertical pathway. Third, transmission studies have typically used presence/absence measures of H. pylori infection via 13C urea breath tests (Rothenbacher et al. 1999; Tindberg et al. 2001), presence/absence of antibodies (Tindberg et al. 2001; Samir et al. 2004), restriction enzyme digestion of amplified genes (Wang et al. 1993), or analyses of peptide sequences (Prewett et al. 1992). Although the latter two methods are an advance over 13C urea breath tests as they allow comparison of H. pylori genotypes in parents and children, these methods do not provide the high resolution of nucleotide-sequence-based studies and are more susceptible to convergent changes. Furthermore, previous studies have not considered the potential for mutation, and/or recombination, to occur between the times of transmission and sampling.
In this article we derive DNA sequence data from extended family pedigrees in a high-prevalence community and use population genetics tools and computer simulations to infer the transmission patterns of H. pylori. We show that a large proportion of infection is derived outside of the family in this population and that horizontal transmission from the community plays a major role in the spread of H. pylori.
MATERIALS AND METHODS
Sampling and gene sequencing:
The study population comprised 105 healthy individuals, for which extensive pedigree information was available (supplemental Figure 1 at http://www.genetics.org/supplemental/), from a rural, South African, black community (Ogies, Mpumulanga) who have been followed as part of a long-term surveillance program on the epidemiology of H. pylori (Goosen et al. 2002; Fritz et al. 2006; Olivier et al. 2006). This population had many of the risk factors that are associated with a high prevalence of H. pylori infection (Bunn et al. 2002; Suerbaum and Michetti 2002). The study population comprises 12 pedigrees, the individuals of which occupy 23 independent households (supplemental Figure 1 and supplemental Table 1 at http://www.genetics.org/supplemental/). Furthermore, 100% of the households have a reticulated water supply, 87% flushing toilets, and 98% of individuals have their own toothbrush (supplemental Figure 1 and supplemental Table 1). These population statistics indicate that the study population is sufficiently replicated for the proposed analysis since each of the 23 households have their own reticulated water supply, and most have flushing toilets. Ethical approval for this study was obtained from the University of Pretoria and the Hospital Review board of the Unitas hospital (Fritz et al. 2006; Olivier et al. 2006). Endoscopy was performed in 90 individuals. DNA was isolated directly from gastric biopsy samples, and fragments from three housekeeping genes (ureI, ureC, and mutY; Figure 1) were PCR amplified and sequenced. These housekeeping genes were chosen, using the calculations of recombination end-point frequency (Falush et al. 2001) to span both narrow (ureC-ureI) and moderate (ureC-mutY) genomic distances. This strategy facilitates detection of recombination events following transmission between sampled individuals, a process that could potentially obscure patterns of vertical inheritance of H. pylori infection. The intergene distances between ureI and ureC may be sufficient to maintain linkage disequilibrium between these fragments, while the greater distance between ureC and mutY would allow more recombination and, potentially, breakdown of linkage disequilibrium. PCR products were purified by precipitation with 95% ethanol and 3 m NaAc, and sequence reads were determined on an ABI 3100 capillary sequencer, following cycle-sequencing using the BigDye 3.2 termination reaction. Direct DNA extraction of biopsy samples was preferred over culturing since the latter may result in in vitro sequence change and may also reduce genotypic diversity within a sample. Where multiple genotypes were detected in a single biopsy sample, we cloned PCR products and sequenced a selection of these cloned fragments to identify unique genotypes. PCR products were cloned into the pTZ57R vector using the InsT/Aclone PCR product cloning kit (Fermentas). These data were combined with published multiple strain data (Raymond et al. 2004) to calculate the degree of within-individual sequence diversity and thus to determine whether the single-strain assumption was acceptable, given the intended aims of this study.
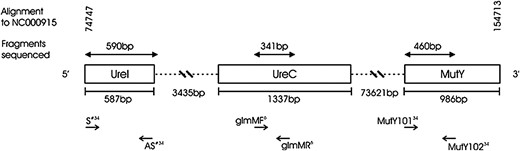
Location of genes sequenced in this study on the H. pylori genome. Alignment to the H. pylori strain 26695 complete genome sequence (GenBank NC_000915) is shown, as are lengths of fragments sequenced, intergene distances in base pairs, and primers used. A “#” indicates where custom primers based on previously published ureI primers (Achtman et al. 1999) were used to amplify ureI.
Sequence analysis:
Sequences from the three genes were analyzed to identify the predominant route of transmission of H. pylori. In summary, (i) neighbor-joining phylograms were used to represent phylogenetic structure of H. pylori within the community and (ii) statistical comparisons and a custom simulation model were developed to identify the most likely path of transmission (Table 1).
Alternative transmission scenarios and probabilities of transmission used in the broken-stick model
Vertical | Horizontal | ||||
|---|---|---|---|---|---|
| Scenario | Maternal | Paternal | Sibling | Household | Community |
| 1 | 0.900 | 0.050 | 0.000 | 0.000 | 0.050 |
| 2 | 0.475 | 0.475 | 0.000 | 0.000 | 0.050 |
| 3 | 0.450 | 0.050 | 0.000 | 0.000 | 0.500 |
| 4 | 0.250 | 0.250 | 0.000 | 0.000 | 0.500 |
| 5 | 0.250 | 0.250 | 0.167 | 0.167 | 0.167 |
| 6 | 0.025 | 0.025 | 0.500 | 0.400 | 0.050 |
| 7 | 0.025 | 0.025 | 0.050 | 0.050 | 0.850 |
| 8 | 0.03 | 0.01 | 0.05 | 0.13 | 0.78 |
Scenarios 1 and 2 represent predominantly vertical transmission, 3–5 mixed transmission, 6–7 predominantly horizontal transmission with little (6) or substantial (7) contribution from the external community, and 8 the probabilities of transmission calculated from pairwise comparisons of sequences.
Phylogenetic structure:
Sequences from the three genes ureI, ureC, and mutY with 80, 79, and 79 genotypes, respectively, were imported into Sequence Navigator (Applied Biosystems, Foster City, CA), where they were proofread and subsequently aligned using ClustalX (Higgins and Sharp 1988). We performed preliminary analyses of sequence diversity in DnaSp (Rozas and Rozas 1999) and used Mega2 (Kumar et al. 2004) to construct unrooted neighbor-joining phylograms based on uncorrected P distances for each of the three genes. The aim of these preliminary analyses was to identify overall trends and population genetic structure within the data set derived from the Ogies community.
Transmission analyses:
To obtain a preliminary view of the information content of the data in terms of analyzing transmission hypotheses across relationship categories, we performed chi-square permutation tests. These tests examined the association between individuals carrying similar sequences and individuals within a particular category of relationship (mother–child, parent–offspring, siblings, family members, or housemates). Family members are individuals who are related and share a household, whereas housemates are individuals who share a household yet are not necessarily related. Since each individual appears in multiple pairwise comparisons, these comparisons are not independent of each other. We tested the effects of dependence on chi-square tests with a Monte Carlo approach that randomly selected individuals from pairwise comparisons. The purpose of these permutations was to compare the results of the dependent chi-square tests utilized above to simulated data sets of various levels of dependence. Significance of the observed chi-square test statistic was assessed using a permutation approach as per Roff and Bentzen (1989). An algorithm was used to produce a series of 10,000 randomized contingency tables for each comparison, with the number of similar sequences and the number of individuals in the particular relationship category (the marginal values) held constant. To assess the significance of an association, we determined the proportion of these randomized contingency tables that showed more extreme chi-square values than the observed data. Since mutations may have accumulated since the time of transmission, we scored sequences as similar if they differed by five or fewer substitutions. This criterion was based on a gap observed in the distribution of pairwise sequence differences (the mismatch distribution), with few comparisons that differ by 6–10 nucleotide substitutions. The maximum mutation rate of H. pylori has been estimated as 2.28e−5 mutations/site/year (Falush et al. 2001). Given a total of 1391 sites sequenced in this study, the probability of a single mutation occurring each year is 0.03. Thus the time required for five mutations to occur is on the order of 160 years, and it is highly unlikely that more than five mutations could have accumulated between the times of transmission and sampling.
These categorical tests alone provide an inadequate representation of H. pylori transmission patterns, as there may be multiple routes of person-to-person infection. A probabilistic model of infection, with pedigree and associated sequence data as inputs, was constructed to characterize patterns of genetic diversity expected under more complex transmission scenarios. In the model, transmission was simulated using a broken-stick design (Figure 2), where the source of infection for each target individual was determined by a random draw from a uniform distribution, with varying frequency segments assigned to five relationship categories (Table 1). Given the mode of transmission, the source individual and the associated DNA sequence was identified from the pedigree data. Infection from the community was simulated by drawing from the data set of available individuals (n = 74) or by creating a new allele at a rate determined by the observed gene diversity. The nucleotide substitutions to be enforced along this new allele were determined by first randomly choosing one of the three identified phylogenetic groups (Figure 3) at a rate determined by their frequency in the observed data and then by choosing a pairwise difference from the mismatch distribution within these groups for each of the three candidate genes. Substitutions along the new allele were applied according to the appropriate mutation model for each gene as determined in PAUP*4b10 (Swofford 1999) using ModelTest 3.4 (Posada and Crandall 1998) and Akaike Information Criterion model selection. Substitutions were constrained to the observed variable sites or to new mutant sites arising at a rate determined by the nucleotide diversity, such that the strong phylogenetic structure evident in H. pylori (Falush et al. 2003) would be retained in the model. Age of infection, drawn from a gamma distribution (mean = 3, α = 0.1) that approximates patterns of infection in empirical studies (Klein et al. 1994; Rowland et al. 2006), was used to calculate the sequence divergence from time of infection to time of sampling. Time since divergence determined the number of mutation and recombination events, with rates of 6.9e−5 and 4.1e−5/nucleotide/annum, respectively (Falush et al. 2001). Mutation events that occurred within the sequenced gene regions (ureI, ureC, and mutY) were enforced according to the best-fit mutation model for each gene. Similarly, recombination events that occurred within the sequenced gene regions, or that occurred within one recombinant's length of any of these gene regions, drawn from an exponential distribution with a mean of 417 bp (Falush et al. 2001), were enforced along the simulated DNA sequences. Transmission was simulated for 26 individuals, for whom at least one parent's bacterium infection had been sequenced, and was repeated 50,000 times for each of eight transmission hypotheses (Table 1). Transmission hypotheses were chosen to represent a range of vertical, horizontal, and combined vertical and horizontal scenarios (Table 1, scenarios 1–7). In addition, we used the observed data to calculate a proportion of sharing of genotypes between children and their mothers, fathers, siblings, and housemates. Genotypes that differed by fewer than five mutations were considered to be identical, as in the chi-square analysis, such that mutation and recombination could be accounted for. These patterns of genotype sharing observed from the data were used to parametize an eighth transmission hypothesis (Table 1, scenario 8). Although only 50,000 Monte Carlo iterations were simulated for each hypothesis (Table 1), the simulated data comprise 1.3 million independent transmission events, since iterations each consist of 26 transmission events across the pedigrees.
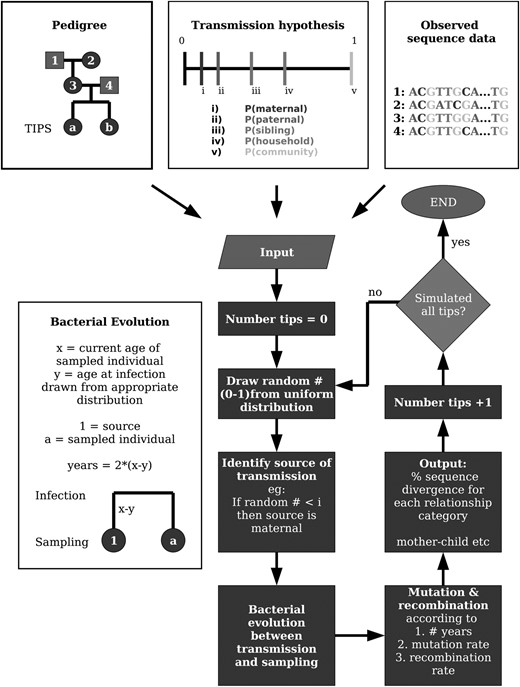
Schematic of the model used to simulate H. pylori transmission (Table 1). Note that only a framework of the model is provided. A detailed description is provided in materials and methods.
The model simulated a single transmission event per individual, and thus summary statistics (gene diversity and nucleotide diversity) and phylogenetic structure of the simulated data should not differ substantially under the alternate transmission hypotheses. However, pairwise comparisons of parent–child divergence should show marked differences. We performed Archie–Faith–Cranston randomization tests, with 1000 permutations, in PAUP*4b10 (Swofford 1999), which calculated the probability that the topologies of randomly chosen simulated data sets for each transmission scenarios were consistent with that of the observed data topology. To compare results from alternate transmission scenarios, we calculated the mean, median, and skewness from simulated distributions of mother–child divergences and used bootstrap resampling procedures (50,000 replicates) to calculate confidence limits on these statistics for each of the eight transmission hypotheses. Finally, we used these resampling procedures along with Kolmogorov–Smirnov tests to infer whether any of the eight transmission hypotheses were unlikely to have given rise to the observed data.
RESULTS
Sequence analysis:
Seventy-five individuals (83%) were H. pylori positive by PCR and histology. Multiple genotypes were detected in 10 (13%) of the individuals sequenced. Co-infection with multiple H. pylori genotypes has been suggested in some previous studies (Miehlke et al. 1999; Luman et al. 2002). Multiple strain data generated in this study (mutY: 3 individuals, 66 pairwise comparisons; ureI: 2 individuals, 28 pairwise comparisons) indicated low average within-individual genetic distances (mutY: 0.006 ± 0.01, n = 19; ureI: 0.014 ± 0.013, n = 12). Furthermore, Raymond et al. (2004) sequenced 20 cultures for each of 6 individuals and detected a maximum of four strains per individual, where each individual appeared to be infected by a dominant strain with >70% occurrence. Mean average ureC genetic distance within individuals was low (0.023 ± 0.004, n = 5). Consequently, all subsequent analyses were performed assuming one strain per individual. It is important to note that we do not advocate that co-infection with multiple strains does not exist, but rather suggest that the low percentage of sequence divergence observed among multiple strains within individuals is unlikely to confound the inference of transmission under a single-strain assumption. We discuss the implications of this assumption later. Preliminary sequence analyses show high levels of gene diversity for each of the genes sequenced (Table 2). In general, nucleotide diversity is higher for mutY than for either of the other genes (ureI and ureC). There are low levels of coding substitutions relative to silent substitutions, and thus there is no evidence for selection among the sequenced genotypes at these genes. Given that the fragments sequenced are from general H. pylori housekeeping genes, this result is expected. Phylogenetic conflict between adjacent segregating sites suggests a minimum estimate of between 23 and 37 recombination events within this sample for each of the three genes (Table 2). Finally, phylogenetic analysis of the three sequenced genes indicates a lack of clustering of individuals from the same family (Figure 3) as would be expected if transmission were vertical. In further support of a substantial horizontal transmission component, most families comprised genotypes belonging to both the hpAfrica1 and hpAfrica2 (Falush et al. 2003) divergent strains (Figure 3), and furthermore there was no significant clustering of H. pylori strains among families (χ2 = 26.23, d.f. = 16, P > 0.05).
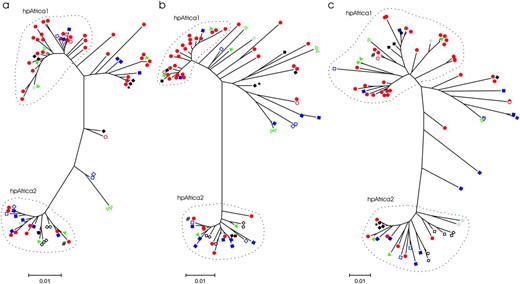
Neighbor-joining phylograms derived from the three genes sequenced in this study: (a) ureI, (b) ureC, and (c) mutY. The three phylogenetic “groups” used for the creation of new alleles in the simulation model broadly correspond to the modern population groups (Falush et al. 2003) identified previously (i.e., hpAfrica1, hpAfrica2, and the complement of these). Pedigree information is indicated by symbols, where solid red circles indicate family 12; solid blue squares, family 13; solid green triangles, family 21; solid black diamonds, family 39; open red circles, family 48; solid gray circles, family 49; open blue squares, family 50; open green triangles, family 51; open black diamonds, family 52; “*”and “#” indicate the varying placement of individuals 112 and 189, respectively, due to recombination between mutY and the other two genes.
H. pylori diversity indexes at three independent loci with mean and standard deviations calculated in DnaSp
ureI | ureC | mutY | |
|---|---|---|---|
| Sequence length (bp) | 590 | 341 | 460 |
| Individuals (n) | 80 | 79 | 79 |
| Gene diversity | 0.992 (0.003) | 0.998 (0.004) | 0.990 (0.004) |
| Nucleotide diversity | 0.041 (0.001) | 0.050 (0.002) | 0.068 (0.002) |
| Segregating sites | 89 | 71 | 105 |
| Ka/Ks | 0.045 (0.041) | 0.050 (0.060) | 0.078 (0.040) |
| Minimum recombination (Re)a | 26 | 23 | 37 |
See Rozas and Rozas (1999) for DnaSp.
Four-gamete test (Hudson and Kaplan 1985).
Transmission analysis:
Transmission of H. pylori was inferred using two approaches. The first approach used categorical tests to determine whether the number of pairwise comparisons between individuals carrying identical or similar sequences, within a particular relationship category, differed from that expected under a random assignment of genotypes to individuals within the sample. We compared genotypes within mother–child, parent–offspring, sibling, extended family, housemate, and spouse relationship classes. To test for associations between genotypes within relationship classes, we used chi-square values, with the test distribution for these pairwise comparisons generated from 10,000 random permutations of genotype assignments (Table 3). Since most individuals are involved in multiple pairwise comparisons, there may be a problem with dependency. Resampling the data set for different levels of dependency indicated that at least some of the statistical power achieved was the result of individuals involved in multiple dependent comparisons (results not shown). However, we used only chi-square results to gain a preliminary understanding of the data. Results from these chi-square permutation tests indicate that (i) parents are significantly more likely to share similar H. pylori genotypes with their children than are unrelated individuals; (ii) siblings are also likely to share H. pylori genotypes; (iii) individuals from the same household show the highest frequency of genotype sharing (evident as large chi-square values), irrespective of their family relationships; and (iv) spousal partners are no more likely to share H. pylori genotypes with each other than with anyone else in the community. These results are consistent with some degree of transmission through childhood social interaction. Most individuals, however, carry substantially different H. pylori genotypes, irrespective of their relationships, which suggests that a large proportion of H. pylori infections are acquired outside the family.
Results of chi-square permutation tests of association between similar genotypes and particular relationship categories
Chi-square | P | |||||
|---|---|---|---|---|---|---|
| Relationship | ureI | ureC | mutY | ureI | ureC | mutY |
| Mother–child | 6.9 | 3.7 | 10.4 | 0.006* | 0.032 | <0.001* |
| Parent–offspring | 11.1 | 1.2 | 12.7 | <0.001* | 0.208 | 0.001* |
| Siblings | 7.8 | 0.13 | 26.9 | 0.004* | 0.585 | <0.001* |
| Extended family | 0.32 | 69.9 | 48.3 | 0.57 | <0.001* | <0.001* |
| Housemates | 33.1 | 17.5 | 96.5 | <0.001* | <0.001* | <0.001* |
| Spouses | 0.7 | 0.7 | 0.2 | 0.068 | 0.355 | 0.179 |
A Bonferonni-corrected α-value (P < 0.05) of [0.05/(no. of categories − 1)] = 0.01 was used. *Significance at the 0.05 level.
The second approach involved the construction of a probabilistic model that used pedigree information and sequence data derived from the study population to simulate transmission processes (Table 1). This simulation model is preferred over categorical tests as it incorporates mutations and recombination events that may have occurred since infection and allows one to investigate patterns of genetic diversity occurring under multiple contrasting transmission pathways. As with all such models, however, it was first necessary to evaluate simulation results in terms of whether these were comparable with the sample and whether these are sufficient to discriminate alternate transmission pathways. Since this model simulated a single transmission event for each of 26 individuals, one would not expect summary statistics (gene diversity and nucleotide diversity) or phylogenetic structure of the simulated data to differ substantially under the alternate transmission hypotheses. Pairwise comparisons of parent–child divergence, however, should show marked differences, according to the frequency of vertical transmission in a particular transmission scenario. Mismatch distributions, distributions of gene diversity and nucleotide diversity, and distributions of segregating sites for three contrasting transmission hypotheses were comparable and similar to the observed data (results not shown). Furthermore, permutation tests in PAUP*4b10 (Swofford 1999), using the observed topology (Figure 3) as a constraint, demonstrated that the simulated data were highly consistent with the observed phylogeny for each of these three alternate transmission hypotheses (in all cases P = 1.0). These results indicate that the simulation model does not perturb within-community phylogenetic structure (evident in Figure 3). To assess the potential of mother–child sequence divergence to discriminate alternate transmission hypotheses, we calculated confidence limits, using bootstrap resampling, on distribution statistics derived from 50,000 simulations. These results indicate that this approach is powerful, with narrow confidence limits on expected statistics (Table 4A). In particular, there is a shift from a strongly right-skewed distribution of mother–child divergences (g1 > 0) in vertical transmission models (hypotheses 1 and 2, Table 4A) to a strongly left-skewed distribution (g1 < 0), when infection is predominantly acquired horizontally and outside the family (hypothesis 7, Table 4A). These results confirm that average pairwise sequence divergences between mothers and their children are low under strict vertical transmission models and high under permissive horizontal transmission models.
Bootstrap estimates and 95% confidence limits (lower, upper) for distribution statistics from simulated and observed data
Hypothesis | Gene | Y | M | g1 |
|---|---|---|---|---|
| A. Mother–child sequence divergences from simulated data under the eight transmission models | ||||
| 1 | ureI | 0.018 (0.018, 0.019) | 0.002 (0.002, 0.002) | 7.91 (7.81, 8.01) |
| ureC | 0.021 (0.021, 0.022) | 0.000 (0.000, 0.000) | 7.19 (7.09, 7.28) | |
| mutY | 0.029 (0.028, 0.029) | 0.009 (0.009, 0.009) | 6.50 (6.42, 6.59) | |
| 2 | ureI | 0.019 (0.018, 0.019) | 0.000 (0.000, 0.000) | 7.54 (7.44, 7.64) |
| ureC | 0.021 (0.021, 0.021) | 0.000 (0.000, 0.000) | 7.48 (7.38, 7.58) | |
| mutY | 0.027 (0.026, 0.027) | 0.002 (0.002, 0.002) | 7.07 (6.98, 7.17) | |
| 3 | ureI | 0.030 (0.030, 0.030) | 0.022 (0.022, 0.022) | 2.68 (2.60, 2.75) |
| ureC | 0.034 (0.034, 0.034) | 0.024 (0.022, 0.025) | 2.06 (1.98, 2.14) | |
| mutY | 0.048 (0.048, 0.048) | 0.043 (0.043, 0.044) | 1.26 (1.19, 1.33) | |
| 4 | ureI | 0.035 (0.034, 0.035) | 0.031 (0.030, 0.033) | 0.73 (0.66, 0.80) |
| ureC | 0.039 (0.039, 0.040) | 0.044 (0.041, 0.046) | −0.01 (0.07, 0.15) | |
| mutY | 0.055 (0.054, 0.055) | 0.059 (0.058, 0.060) | −0.65 (−0.72, −0.58) | |
| 5 | ureI | 0.028 (0.028, 0.028) | 0.015 (0.015, 0.015) | 3.27 (3.19, 3.35) |
| ureC | 0.031 (0.031, 0.032) | 0.015 (0.015, 0.015) | 3.10 (3.02, 3.18) | |
| mutY | 0.043 (0.043, 0.043) | 0.033 (0.033, 0.033) | 2.31 (2.39, 2.46) | |
| 6 | ureI | 0.031 (0.030, 0.031) | 0.024 (0.024, 0.024) | 2.54 (2.46, 2.61) |
| ureC | 0.034 (0.034, 0.034) | 0.018 (0.018, 0.018) | 2.37 (2.29, 2.45) | |
| mutY | 0.048 (0.048, 0.048) | 0.039 (0.039, 0.039) | 1.45 (1.38, 1.53) | |
| 7 | ureI | 0.042 (0.042, 0.042) | 0.042 (0.040, 0.043) | −1.27 (−1.34, −1.20) |
| ureC | 0.049 (0.049, 0.049) | 0.053 (0.052, 0.053) | −2.91 (−2.98, −2.84) | |
| mutY | 0.071 (0.070, 0.071) | 0.077 (0.075, 0.079) | −3.53 (−3.60, −3.46) | |
| 8 | ureI | 0.041 (0.041, 0.041) | 0.041 (0.040, 0.041) | −0.92 (−0.99, −0.84) |
| ureC | 0.048 (0.047, 0.048) | 0.053 (0.053, 0.053) | −2.39 (−2.46, −2.31) | |
| mutY | 0.069 (0.068, 0.069) | 0.074 (0.074, 0.074) | −3.21 (−3.14, −3.06) | |
| Relationship | Gene | Y | M | g1 |
| B. Distribution statistics of mother–child (n = 19), father–child (n = 16), sibling (n = 34), and within-household (n = 99) sequence divergences from observed data | ||||
| Mother–child | ureI | 0.0384 (0.0260, 0.0510) | 0.0394 (0.0094, 0.0694) | −0.0742 (−0.9760, 0.8276) |
| ureC | 0.0433 (0.0282, 0.0586) | 0.0466 (0.0050, 0.0882) | −0.1659 (−2.8531, −0.5234) | |
| mutY | 0.0589 (0.0428, 0.0751) | 0.0591 (0.0299, 0.0882) | −0.0544 (−0.8175, 0.7086) | |
| Father–child | ureI | 0.0364 (0.0247, 0.0482) | 0.0376 (0.0152, 0.0600) | 0.1558 (−0.7526, 1.0641) |
| ureC | 0.0479 (0.0346, 0.0613) | 0.0534 (0.0273, 0.0795) | −0.1951 (−1.1354, 0.7451) | |
| mutY | 0.0655 (0.0492, 0.0819) | 0.0724 (0.0378, 0.1070) | −0.2079 (−1.1760, 0.7602) | |
| Sibling | ureI | 0.0357 (0.0257, 0.0458) | 0.0334 (0.0149, 0.0520) | 0.0913 (−0.6116, 0.7941) |
| ureC | 0.0424 (0.0290, 0.0558) | 0.0438 (0.0164, 0.0713) | −0.0496 (−0.7891, 0.6899) | |
| mutY | 0.0655 (0.0511, 0.0798) | 0.0702 (0.0460, 0.0944) | −0.4751 (−1.1552, −0.2049) | |
| Household | ureI | 0.0319 (0.0270, 0.0367) | 0.0249 (0.0152, 0.0346) | 0.3632 (0.0319, 0.6946) |
| ureC | 0.0380 (0.0320, 0.0442) | 0.0319 (0.0184, 0.0454) | 0.3044 (−0.0281, 0.6370) | |
| mutY | 0.0536 (0.0465, 0.0607) | 0.0484 (0.0353, 0.0615) | 0.0798 (−0.2167, 0.3764) | |
Y, mean; M, median; g1, skewness.
To infer which of the transmission hypotheses were most likely to generate the observed data, we conducted Kolmogorov–Smirnov tests comparing observed distributions of pairwise divergence statistics against those simulated under various transmission scenarios. The observed distribution of within-household sequence divergence values for the 26 focal individuals was significantly different from all the simulated transmission scenarios (Table 5). In contrast, the sequence divergence values among siblings were consistent with all the transmission models considered. These cases show rigorous and insufficient discrimination, respectively. The inability to discriminate among hypotheses for among-housemate comparisons may be due partly to the difficulty in distinguishing instances of vertical and horizontal transmission within households, where individuals can obtain identical genotypes both from specific parent–offspring interactions or from less specific social contacts. Father–child divergence distributions showed significant deviations from the observed data in the two strictly vertical transmission scenarios (Table 5). Observed mother–child divergences were significantly different from both vertical transmission scenarios (Table 5). However, elements of both parent–offspring and social transmission are evident in the observed data as a bimodal distribution with high frequencies of both low and high mother–child sequence divergences, respectively (Figure 4). In general, scenarios with a high probability of vertical transmission (or strongly right-skewed distributions of parent–child sequence divergence) and scenarios with low probabilities of infection from the community were least consistent with the observed data (Table 5). Bootstrap estimates of distribution statistics for the observed data have wider confidence limits than the simulated data (Table 4B), as expected given the smaller sample sizes. Nonetheless, the observed mean mother–child sequence divergences are unlikely to have been generated through predominantly vertical transmission. It is difficult to distinguish the observed data from either mixed transmission or predominantly horizontal scenarios, given the wide confidence estimates on mean, median, and skewness. Skewness, in particular, has confidence limits that encompass both right-skewed (g1 > 0) and left-skewed distributions (g1 < 0), which results from the bimodal distribution of mother–child divergences in the observed data (Figure 4). However, observed distribution statistics are substantially different from those simulated in predominantly vertical transmission scenarios (Table 4).
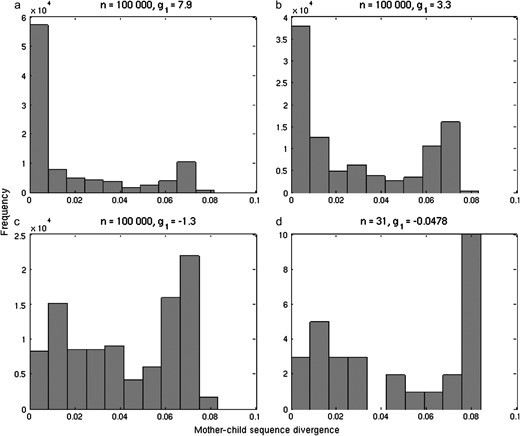
The distribution of mother–child sequence divergence under three simulated transmission scenarios: (a) 95% vertical, 5% horizontal; (b) 50% vertical, 50% horizontal; and (c) 5% vertical, 95% horizontal, compared with (d) the observed data. Sample sizes (n) for each of the distributions are represented as are the skewness statistics (g1) where left-skewed distributions have g1 < 0 and right-skewed g1 > 0. Note that frequencies for the observed data (d) are not ×102.
Kolmogorov–Smirnov tests comparing observed vs. simulated distributions of test statistics under eight transmission scenarios
Mother–child | Father–child | Sibling | Household | ||||||
|---|---|---|---|---|---|---|---|---|---|
| Hypothesis | Gene | k | P | k | P | k | P | k | P |
| 1 | ureI | 0.42 | 0.001 | 0.28 | 0.135 | 0.11 | 0.942 | 0.78 | <0.001 |
| ureC | 0.53 | <0.001 | 0.35 | 0.030 | 0.08 | 0.999 | 0.69 | <0.001 | |
| mutY | 0.48 | <0.001 | 0.30 | <0.001 | 0.01 | 1.000 | 0.83 | <0.001 | |
| 2 | ureI | 0.43 | 0.001 | 0.48 | <0.001 | 0.11 | 0.944 | 0.76 | <0.001 |
| ureC | 0.57 | <0.001 | 0.53 | <0.001 | 0.07 | 0.999 | 0.65 | <0.001 | |
| mutY | 0.53 | <0.001 | 0.48 | <0.001 | 0.05 | 1.000 | 0.81 | <0.001 | |
| 3 | ureI | 0.21 | 0.319 | 0.19 | 0.544 | 0.11 | 0.933 | 0.84 | <0.001 |
| ureC | 0.30 | 0.058 | 0.13 | 0.933 | 0.09 | 0.983 | 0.78 | <0.001 | |
| mutY | 0.26 | 0.127 | 0.14 | 0.858 | 0.02 | 1.000 | 0.91 | <0.001 | |
| 4 | ureI | 0.14 | 0.814 | 0.21 | 0.432 | 0.09 | 0.971 | 0.83 | <0.001 |
| ureC | 0.22 | 0.244 | 0.28 | 0.147 | 0.04 | 1.000 | 0.78 | <0.001 | |
| mutY | 0.20 | 0.398 | 0.19 | 0.534 | 0.01 | 1.000 | 0.91 | <0.001 | |
| 5 | ureI | 0.27 | 0.109 | 0.29 | 0.106 | 0.06 | 0.999 | 0.74 | <0.001 |
| ureC | 0.33 | 0.025 | 0.34 | 0.036 | 0.06 | 0.999 | 0.67 | <0.001 | |
| mutY | 0.31 | 0.036 | 0.30 | 0.093 | 0.07 | 0.999 | 0.81 | <0.001 | |
| 6 | ureI | 0.16 | 0.686 | 0.14 | 0.888 | 0.30 | 0.027 | 0.66 | <0.001 |
| ureC | 0.19 | 0.456 | 0.18 | 0.647 | 0.22 | 0.196 | 0.61 | <0.001 | |
| mutY | 0.41 | 0.415 | 0.16 | 0.758 | 0.30 | 0.020 | 0.72 | <0.001 | |
| 7 | ureI | 0.17 | 0.614 | 0.20 | 0.495 | 0.09 | 0.994 | 0.86 | <0.001 |
| ureC | 0.28 | 0.085 | 0.11 | 0.983 | 0.04 | 1.000 | 0.84 | <0.001 | |
| mutY | 0.23 | 0.239 | 0.16 | 0.790 | 0.01 | 1.000 | 0.95 | <0.001 | |
| 8 | ureI | 0.15 | 0.748 | 0.20 | 0.516 | 0.09 | 0.994 | 0.85 | <0.001 |
| ureC | 0.26 | 0.133 | 0.11 | 0.987 | 0.04 | 1.000 | 0.82 | <0.001 | |
| mutY | 0.21 | 0.348 | 0.15 | 0.816 | 0.01 | 1.000 | 0.93 | <0.001 | |
In each case, the Kolmogorov–Smirnov test statistic (k) and the probability (P) that the observed distribution is consistent with the simulated distribution is shown. Significant results for each of the three genes are shown in italics, where a Bonferroni-corrected α-level of 0.002 [0.05/(no. of hypotheses × no. of tests)] was applied.
DISCUSSION
Previous population genetic studies of H. pylori have shown the existence of ancestral population types or strains that are consistent with geographic regions (Achtman et al. 1999; Falush et al. 2003). These studies indicate the effects that human migrations have had on global genetic diversity within H. pylori. Evolutionarily, the existence of geographical strains, each with an ancestral origin that can be geographically determined, provides a marker independent from that of Y chromosome, microsatellite, or mitochondrial DNA studies, for deciphering human history (Wirth et al. 2004). Comparisons of these markers show that DNA sequences from H. pylori provide greater resolution, for example, in the separation of Buddhists and Muslim populations in Ladakh, India, than do mtDNA sequences or microsatellites (Wirth et al. 2004). The accurate inference of human migratory patterns using H. pylori, however, has been justified on the assumption of strictly vertical transmission (Wirth et al. 2004). To date most studies have suggested predominantly vertical transmission (Drumm et al. 1990; Rothenbacher et al. 1999; Tindberg et al. 2001), with most evidence for infection contained within the family unit and a sampling bias toward maternal transmission.
We have shown that in a high-prevalence population, transmission of H. pylori also includes a strong horizontal component derived from the community. Although multiple strains have not been sequenced for all individuals in this study, we have shown that within-individual sequence diversity is low. This low within-individual genetic diversity, combined with the observation of dominant strains (Raymond et al. 2004), provides support for the single-strain assumption used in this study. Indeed, several recent studies that have sequenced multiple strains found substantially lower sequence divergences within individuals (Israel et al. 2001, Raymond et al. 2004, Kraft et al. 2006), suggesting a shared common ancestor for multiple strains within individuals. Given these results, it is unlikely that sequencing of multiple strains within individuals will explain the right-skewed distribution of parent–offspring genetic distances (Figure 4) and thus could not account for the community-derived component of infection. However, a paradox exists, given the occurrence of a single dominant strain and the observation that a large proportion of temporal genomic changes within H. pylori are the result of intergenomic recombination (Kraft et al. 2006). Kraft et al. (2006) conclude that the continuous acquisition of new strains is necessary for generating genomic changes in H. pylori. Given such intergenomic recombination, the inference of transmission in our study would be confounded. However, the use of multiple unlinked housekeeping genes not under selective pressure strengthens our argument since it is unlikely that each of the genes sequenced have had parallel recombination events.
Further complication in the inference of transmission routes in this study, however, could stem from host–pathogen interactions. Individuals do appear to carry a dominant strain (Israel et al. 2001; Raymond et al. 2004; Kraft et al. 2006). However, whether this observation is the result of within-host selection is uncertain and could certainly complicate the inference of transmission. Our observed results could be generated if a child obtained multiple infections from his or her mother, yet within-host selection resulted in a dominant strain in the child that differed from the mother's dominant strain. However, given the existence of a dominant strain, the multiple infections evident in some individuals are most likely the result of multiple independent horizontal transmission events. Clearly, much work on the development of infection and temporal host–pathogen interactions is required. This would include the sequencing of multiple strains from paired biopsies at the onset of infection, such that an understanding of temporal changes of the H. pylori population in the stomach environment could be addressed.
Many people in developing countries, and until recently those in the developed countries, live in comparable social conditions and experience similarly high H. pylori prevalence to this community (Parsonnet et al. 1992; Banatvala et al. 1993). Given the observed degree of acquisition of infection from the community demonstrated in this study, the retention of strong ancestral geographic structure within global H. pylori sequences (Falush et al. 2003), within sequences from regional populations (Muslims and Buddhists in Ladakh; Wirth et al. 2004), and within the single homogeneous community considered in this study requires an alternate explanation. The ancestral population structure observed in Ladakh is most likely the result of cultural separation of the religious population groups (Kaul and Kaul 1992; Srinivas 1998). The persistence of ancestral H. pylori lineages within the essentially homogeneous and intermarried community in this study, however, suggests that this structure is maintained by bacterial interactions rather than through separation of human societies alone. Phylogenetic structuring of global H. pylori genotypes probably arose through the isolation of ancestral human populations before the onset of migration and admixture. Subsequent recombination between lineages will disrupt this ancestral population structure but recombination within lineages tends to retain this ancestral structure by homogenizing within-group differences. Most likely, this retention of ancestral population structure is the result of genome-selective mechanisms, which act to limit recombination between different ancestral population groups.
From a medical perspective, the presence of a strong community-derived transmission outside the family affects our epidemiological understanding of H. pylori infection, especially in high-prevalence communities. The very high levels of gene diversity and the observation that most individuals carry highly divergent genotypes imply the presence of an immense community reservoir of H. pylori genotypes that serves as a source of infection. Many studies have searched for environmental sources of H. pylori such as water supplies (Klein et al. 1991; Hulten et al. 1996; Bunn et al. 2002), food (Hopkins et al. 1993), or insect vectors (Grubel et al. 1998; Osato et al. 1998), but these sources remain poorly substantiated and controversial, perhaps due to the presence of an alternate form of the bacterium that is difficult to culture (Bode et al. 1993; Dowsett and Kowolik 2003). The Ogies community considered here has a reticulated supply of treated tap water and flushing toilets, and hence water and sanitation are unlikely explanations for the high prevalence and diversity of H. pylori in this population. An alternative reservoir may be within the community itself, with infection passed from person to person, especially among children. Existing studies have found little evidence for transmission among school children (Tindberg et al. 2001) but these results were based on serological analysis in a low-prevalence community. Such transmission pathways could account for the strong community-derived transmission component observed in this study.
Footnotes
Footnotes
Communicating editor: S. Gottesman
Acknowledgement
We thank Mark Achtman, John Atherton, Daniel Falush, and Cisca Wijmenga for pertinent comments on an earlier draft of this manuscript. Wayne Delport thanks Paulette Bloomer and Willem Ferguson for their support. Finally, we thank three anonymous reviewers and associate editor, Susan Gottesman, for insightful comments that significantly improved the quality of this manuscript. Schalk van der Merwe is a recipient of a Astra-Zeneca/South African Gastroenterology Society Fellowship in Gastroenterology.
References
Everhart, J. E.,
Falush, D., C. Kraft, N. S. Taylor, P. Correa, J. G. Fox et al.,
Israel, D. A., N. Salama, U. Krishna, U. M. Rieger, J. C. Atherton et al.,
Kaul, S., and H. N. Kaul,
Klein, P. D., R. H. Gilman, R. Leon-Barua, F. Diaz, E. O. Smith et al.,
Kumar, S., K. Tamura and M. Nei,
NIH Consensus Development Panel,
Parsonnet, J., H. Shmuely and B. S. Haggerty,
Roff, D. A., and P. Bentzen,
Suerbaum, S., and P. Michetti,
Swofford, D. L.,
Wirth, T., X. Wang, B. Linz, R. P. Novick, J. K. Lum, et al.,
