


Abstract
Soybean has 20 chromosome pairs that are derived from at least two rounds of genomewide duplication or polyploidy events although, cytogenetically, soybean behaves like a diploid and has disomic inheritance for most loci. Genetically anchored genomic clones were used as probes for fluorescence in situ hybridization (FISH) to determine the level of postpolyploid chromosomal rearrangements and to integrate the genetic and physical maps to (1) assign linkage groups to specific chromosomes, (2) assess chromosomal structure, and (3) determine the distribution of recombination along the length of a chromosome. FISH mapping of seven putatively gene-rich BACs from linkage group L (chromosome 19) revealed that most of the genetic map correlates to the highly euchromatic long arm and that there is extensive homeology with another chromosome pair, although colinearity of some loci does appear to be disrupted. Moreover, mapping of BACs containing high-copy sequences revealed sequestration of high-copy repeats to the pericentromeric regions of this chromosome. Taken together, these data present a model of chromosome structure in a highly duplicated but diploidized eukaryote, soybean.
THE haploid soybean (Glycine max L. Merr.) genome consists of ∼1100 Mb packaged into 20 chromosome pairs (Arumuganathan and Earle 1991). Approximately 40–60% of the DNA is repetitive (Goldberg 1978; Gurley et al. 1979). The mitotic chromosomes are quite small, only 4–6 μm in length, and are unsuitable for modern cytogenetic studies. However, pachytene chromosomes are much less compacted (Singh and Hymowitz 1988) and very useful for molecular cytogenetics but have, to date, not been used extensively.
Genomic structure, defined as the distribution of either genes or the hetero/euchromatin within a genome, can reveal much about overall genome organization and potentially the evolution of a genome when compared to related species. The organization of gene space and hetero/euchromatin within the soybean genome remains undelineated, especially at the molecular level.
Soybean genome structure is complicated by at least two rounds of polyploidization. Hybridization of RFLP probes indicated that most probes are duplicated an average of 2.6 times in the soybean genome (Shoemaker et al. 1996a). More recently, computational analyses of clustered expressed sequence tags (ESTs) revealed two rounds of genomewide duplication, or polyploidy events (Blanc and Wolfe 2004; Schlueter et al. 2004). Using molecular clocks, the two polyploidization events were estimated to have occurred either 14 and 45 MYA (Schlueter et al. 2004) or 3.3–5.0 and 15.5–16.7 MYA (Blanc and Wolfe 2004). Thus, soybean can be referred to as a “paleopolyploid” genome.
Polyploidization is a common theme in genome evolution but is often followed by a process of “diploidization” that restores diploid-like pairing and disomic genetics, as in the grasses (Levy and Feldman 2002). It has been hypothesized that polyploidization is a key contributor to the evolution of higher organisms (Ohno 1970). Chromosome studies in the genus Glycine have shown that soybean has approximately twice as many chromosomes as its nearest relatives (Doyle et al. 2004), concordant with polyploidy.
There has been extensive genetic mapping in soybean ranging from RFLPs (Keim et al. 1990) to SSRs (Cregan et al. 1999) to SNPs (Zhu et al. 2003). Using classical cytogenetics, a few of these linkage groups have been associated with specific chromosomes (Zou et al. 2003); however, it is not known how well the chromosomes are covered by the molecular linkage groups. A picture of gene/repeat distribution around genetic markers is beginning to emerge using end sequences from genetically anchored bacterial artificial chromosomes (BACs) (Marek et al. 2001; Mudge et al. 2004) where it is hypothesized that the genes are found in ∼25% of the 1110-Mb genome.
To examine chromosome structure, integrate the genetic and chromosome maps, and investigate the polyploidy nature of soybean, we used genetically anchored BACs from linkage group L (LG L) that was previously shown to be cytological chromosome 19 (Zou et al. 2003). We report evidence of variable rates of recombination, highly compartmentalized heterochromatin, and extensive interchromosomal homeology within the soybean genome—interestingly, along the length of another chromosome pair.
MATERIALS AND METHODS
Seeds from G. max (cv. Resnick 2000) were germinated in MetroMix 510. Plants were grown under standard greenhouse conditions (16 hr daylight and 27° daytime temperature). Florets were routinely sampled and were prepared for fluorescence in situ hybridization (FISH) as previously described (Walling et al. 2005) with the following modifications: After 1 week of fixation in Carnoy's solution, the florets were transferred to 70% EtOH and stored at 4° until used to prepare chromosome spreads.
BAC DNA was prepared and purified from the Escherichia coli host using QIAGEN (Chatsworth, CA) large construct kits. The utility of BACs for use in FISH-based experimentation was initially assessed using Southern blotting. BAC DNA (500 ng) was cut with either HindIII or EcoRI and size fractionated on 1% agarose gel. Approximately 25 ng of genomic soybean DNA was labeled with [32P]dCTP using a random primed DNA labeling kit (Roche) and was used to probe the blotted DNA using routine Southern blotting protocols and standard stringency washes (i.e., 1.5× SSC/0.1% SDS 30 min at 60° and 1.0× SSC/0.1% SDS 30 min at 60°). BACs were selected on the basis of low representation of repetitive sequences that appeared on autoradiographs as fainter banding as compared to those BACs that contained highly represented sequences.
FISH was carried out as described in Walling et al. (2005) using ∼20 ng of labeled BAC DNA per slide except that a posthybridization wash in 2× SSC in 50% formamide was used to reduce fluorescence background, and a 30-min blocking step of Image iT FX signal enhancer (Molecular Probes, Eugene, OR) was added prior to secondary antibody detection. BAC DNA was labeled with either digoxygenin or biotin via nick translation using nick translation kits (Roche). The reaction was carried out at 15° for 2 hr at which time it was quenched with 1 μl of 0.5 m EDTA. The nick translation product was purified using QIAGEN PCR columns.
Biotin-labeled sequences were detected using AlexFluor 488 streptaviden (Molecular Probes) and the digoxigenin-labeled sequences were detected with sheep antidigoxigenin conjugated with rhodamine fab fragments (Roche). Chromosomes were counterstained 4′,6-diamidino-2-phenylindole (DAPI). Slides were analyzed and digital images captured using an Olympus BX60 coupled with a Hamamatsu (Bridgewater, NJ) Orca ER CCD camera controlled with MetaMorph (Universal Imaging, West Chester, PA). Images were further processed using MetaMorph and publication images were prepared using Adobe Photoshop v. 8.0 for Macintosh.
RESULTS
Selection of genetically anchored BACs on LG L of soybean:
Previous work with trisomics showed that LG L corresponds to chromosome 19 (Zou et al. 2003). Twenty-one BAC clones anchored to LG L with SSR and RFLP markers (Marek et al. 2001; Mudge et al. 2004) were selected on the basis of genetic map position to derive a subset of BACs that would span the entire linkage group. Two of the BACs selected (076_J21 and 009_M21) previously were shown to contain pericentromeric repetitive elements (Lin et al. 2005). They were used in this study to mark the position of the centromere/pericentromeric region. All BACs were assayed for repeat content using labeled genomic DNA to probe Southern blots of restriction-digested BACs. Twelve BACs that had less intense hybridization signals indicative of few high-copy repeats were selected. Interestingly, all 12 BACs were located at positions >41.1 cM on the linkage map.
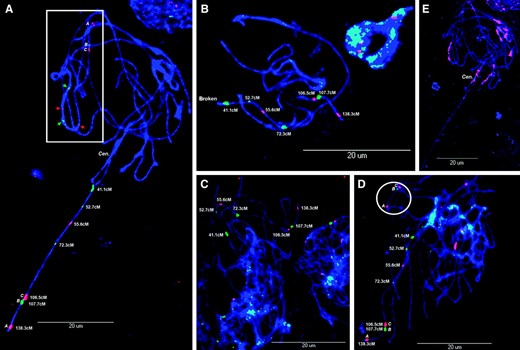
FISH mapping of genetically anchored BACs from linkage group L (Table 1) on pachytene chromosomes from soybean. (A–D) FISH mapping of BACs (012_P14, 123_E07, 181_E15, 007_K23, 161_023, 038_L01, and 144_N07) to the long arm of chromosome 19. Insets in A and D highlight secondary signals from the putative homeologous chromosome (arrows indicate BACs of unknown order). (E) Same chromosome spread as used in A reprobed with repetitive, pericentromeric BAC clone 076_J21. Cen., centromere.
Anchoring of the euchromatic long arm of chromosome 19 with LG L:
Pairs of BAC clones were initially mapped on interphase nuclei to establish the behavior and repeatability of the BACs as FISH probes. Seven BACs that produced distinct signals on interphase nuclei were chosen. LG L is ∼140 cM in length (Cregan et al. 1999; N. D. Young, unpublished data). Most of the seven genetically anchored BACs evenly spanned LG L at intervals of ∼15–20 cM from 41.1 to 138 cM (Table 1), the exception being BACs 161_O23 and 038_L01 positioned at 106.5 and 107.7 cM, respectively. Synteny of these BACs to a single chromosome was confirmed by testing them pairwise on pachytene chromosomes. Subsequent to this, the BACs were positioned on chromosome 19 by pooling labeled BACs into single hybridization experiments. Competing or blocking DNA in the form of C0T fractions or repetitive BACs was not necessary for any of these experiments and was not used for any of these data.
BACs used for FISH experiments, linkage association, and number of FISH signals
BAC name | Library | Marker | cM | No. of FISH signals | No. of measurements |
|---|---|---|---|---|---|
| 107_E11 | Gm_Umb | Satt232 | 7.4 | Disp | N/A |
| 092_H15 | Gm_Umb | Satt446 | 9.2 | Disp | N/A |
| 089_A23 | Gm_Isb | Satt238 | 19.7 | Disp | N/A |
| 094_L03 | Gm_Isb | pA106 | 30 | Disp | N/A |
| 009_M21 | Gm_Isb | Sat_134 | 32.4 | Disp | N/A |
| 034_N02 | Gm_Isb | Satt278 | 33.2 | Disp | N/A |
| 076_J21 | Gm_Isb | Satt398 | 34.6 | Disp | 1 |
| 012_P14 | Gm_Umb | pA023 | 41.1 | 2 | 5 |
| 123_E07 | Gm_Umb | pB046 | 52.7 | 2 | 5 |
| 181_E15 | Gm_Umb | pB162 | 55.6 | 2 | 5 |
| 007_K23 | Gm_Isb | Satt076 | 72.3 | 2 | 5 |
| 161_023 | Gm_Umb | pA489 | 106.5 | 2 | 5 |
| 038_L01 | Gm_Isb | Satt229 | 107.7 | 2 | 6 |
| 144_N07 | Gm_Umb | pA802 | 138.3 | 2 | 7 |
Disp, dispersed FISH signal.
All seven BACs were mapped to the long arm of chromosome 19 (Figure 1, A–D). The lack of cross hybridization when using these BACs as probes for FISH confirms previous observations that the long arm is mostly euchromatic (Singh and Hymowitz 1988). To assess the rate of recombination and further map integration, measurements of BAC positions along the chromosome were taken and transformed into fractional lengths (FL) using a methodology similar to that reported by Cheng et al. (2001). Soybean chromosomes at the pachytene stage are long and fragile (Figure 1B) and associate with each other in heterochromatic regions (i.e., telomeres and centromeres, Figure 2, D and G), resulting in tangled chromosomes that are difficult to disambiguate (Figures 1 and 2). These characteristics impede gross chromosomal analysis including the deduction of whole chromosomal fractional lengths since it is extremely difficult to view or follow the lengths of entire chromosomes. The modified FL uses the telomere and the most proximal single-copy hybridization point (pA023, BAC 012_P14) to anchor the measurements (Figure 3), referred to as FL A [(D ÷ T) × 100 = FL A], where D is the distance from the long-arm telomere to the hybridization point and T is the distance from the telomere to pA023 (41.1 cM). Using this modified approach, we were able to use data from broken and intermingled chromosomes to make inference regarding the structure of the long arm of this chromosome (Table 1; Figure 3).
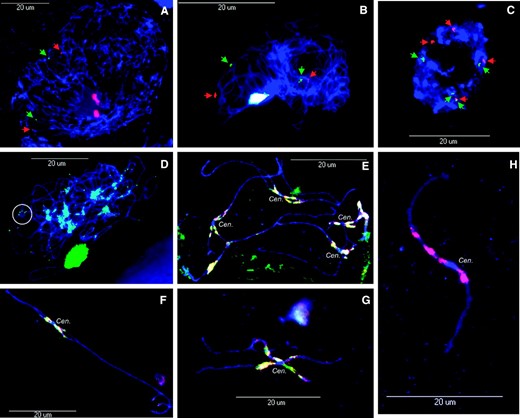
Analysis of duplications and mapping of repetitive BACs using FISH. (A) Soybean chromosomes at zygotene stage probed with BACs 144_N07 (green) and 038_L01 (red). (B) Soybean chromosomes at leptotene stage probed with BACs 012_P14 (red) and 181_E15 (green). (C) Soybean mitotic nucleus at interphase probed with BACs 144_N07 (green) and 038_L01 (red). (D) Soybean chromosomes at pachytene stage probed with the telomere probe (pAtT4); inset highlights grouping of telomeres. (E–G) Soybean pachytene chromosomes probed with 076_J21 (red) and 034_N02 reveal repetitive blocks surrounding the centromere. (H) Higher magnification of an unknown chromosome hybridized with BAC 076_J21, showing the FISH signal flanking the centromere. Cen., centromere.
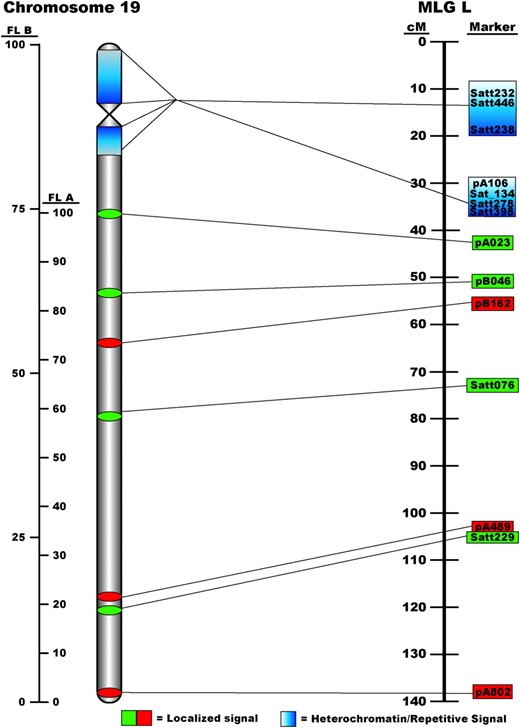
Ideogram of the relationship between soybean pachytene chromosome 19 and genetic linkage group L (LG L). FL A was calculated using the most-promixal single-copy hybridization point (pA023) to anchor the measurements. FL B values were calculated using the entire length of the chromosome.
The integration of the BAC-based physical map of chromosome 19 with the genetic map of LG L allows for preliminary analysis of the rate of recombination along the long arm. In general, these data indicate a trend of recombination suppression toward the proximal region [(peri)centromere] and increased recombination toward the distal region (telomeres) (Figure 3). For example, markers pA023 and pB162 are mapped at 41.1 and 55.6 cM, respectively, a distance of 14.5 cM, but separated by a physical distance of ∼25 FL A. In contrast, more terminally anchored markers, Satt229 and pA802, were genetically mapped at 107.7 and 138.3 cM, respectively, a 30.6-cM difference, but were separated on the chromosome by only 17 FL A—a twofold decrease in the physical map distance as compared to the genetic map distance.
Integration of heterochromatin/repetitive DNA sequences:
BAC 076_J21 anchored by Satt 398 was previously shown to contain repeats found in pericentromeric regions of all 20 pairs of chromosomes (Lin et al. 2005). We sought to determine the boundaries of repetitive blocks on LG L and to identify other genetically anchored BACs with hybridization characteristics similar to 076_J21. Seven BACs that contain genetic markers mapped between 35 and 7.4 cM were selected. When used as FISH probes, each of these BACs produced signals that flanked the centromere, similar to BAC 076_J21 (Figures 1E and 2H; Lin et al. 2005). On mitotic metaphase chromosomes, the signals from each BAC completely colocalized to the pericentromeric region and could be seen on each of the 40 chromosomes (data not shown). On pachytene chromosomes, however, most of the signals completely colocalized to the pericentromeric regions, yet there were portions of some BACs that had unique signal. For example, BAC 076_J21 (green) colocalized with 034_N02 (red); however, nonoverlapping signal can be seen from each BAC, indicating that they are not completely identical in sequence content (Figure 2, E–G). BACs genetically anchored to the top of LG L (up to ∼35 cM) appear to be tightly linked to heterchromatic blocks near the centromere and the short arm of chromosome 19.
A slide on which the low-copy BACs had been mapped was reprobed with BAC 076_J21. Using this, we were able to map heterochromatic blocks with respect to the euchromatic long arm of this chromosome (Figure 1, A and E). Superimposition of Figure 1, A and E, results in a picture that demonstrates distinct segregation of euchromatin from heterochromatin on soybean chromosomes (Figure 3).
Characterization of the whole length of chromosome 19:
Due to the previously mentioned issues, it was very difficult to find separated pachytene chromosomes but one spread did have chromosome 19 sufficiently separated to analyze the entire length (Figure 1A). Both telomeres were visible and we were able to generate an additional set of measurements that took into account the total length of the chromosome and centromere position by adding the distance from pA023 to the tip of the small arm to our previous measurements. Subsequent measurements were taken from pA023 to the centromere (I° constriction) and to the extremities of the pericentromeric repetitive blocks. These additional measurements along with those from the long arm were converted into fraction lengths on the basis of the total length of the chromosome (FL B). These data were used to integrate the single-copy BAC data with the repetitive BACs and to derive an ideogram of chromosome 19 (Figure 3).
Singh and Hymowitz (1988) described chromosome 19 as having a total length of 13.54 μm, an arm-to-leg ratio (long arm/short arm) of 4.42, a subtelomeric centromere, and a short arm composed primarily of heterochromatin. Our measurement of chromosome 19 was ∼60 μm with a short arm to long arm ratio of 5.58 (Figure 1A). Condensation of chromosomes prior to metaphase is a dynamic process; thus measurements of a chromosome from different preparations would result in different numbers. Nevertheless, the short arm to long arm ratio and positioning of the centromere corroborate that reported by Singh and Hymowitz (1988) and DAPI staining and hybridization signals from repetitive probes indicate that the short arm of chromosome 19 is predominantly heterochromatic.
Mitotic soybeans are ∼4–6 μm in length (data not shown). Our measurements found the total length of chromosome 19 at pachytene to be ∼60 μm, 10- to 15-fold longer. Singh and Hymowitz (1988) found several other chromosomes two- to threefold longer than chromosome 19. These data suggest that some chromosomes of soybean at the pachytene stage may be up to 30-fold longer than those at mitotic metaphase.
Intragenomic homeology of chromosome 19:
Several of the BACs tested on interphase nuclei and pachytene chromosomes had secondary FISH hybridization signals indicating potential duplications. An example can be seen with BACs 144_N07 (green) and 038_L01 (red) in which duplication is clearly evident in both zygotene chromosomes (Figure 2A, one signal per BAC expected, two observed) and an interphase nucleus (Figure 2C, two signals expected per BAC, four observed). Similarly, BACs 012_P14 (red) and 181_E15 (green) each had two FISH signals per BAC on leptotene chromosomes while only one was expected (Figure 2B).
Several reports have shown evidence of segmental duplication in soybean (Shoemaker et al. 1996a; Pagel et al. 2004; Song et al. 2004). Using this set of genetically anchored BACs, we show, for the first time, chromosomal-level homeology within the soybean genome (Figure 1A, inset). All the secondary hybridization signals from chromosome 19 appear to be syntenic to one other chromosome (Figure 1A, inset), indicating long-range, chromosome-level homeology. Due to the difficulty in obtaining clearly delineated chromosome spreads, it was difficult to ascertain the precise order of the FISH signals on the putative homeolog although the three most-distal BACs (161_O23, 038_L01, and 144_N07) are colinear (Figure 1, A and D, insets).
DISCUSSION
FISH is a common approach to merge genetic, physical, and chromosome maps to gain insight into the organization and structure of a genome (Arabidopsis, Zhong et al. 1996 and Jackson et al. 1998; rice, Cheng et al. 2001; humans, Cheung et al. 2001; Medicago truncatula, Kulikova et al. 2001). BAC clones, either genetically anchored or unanchored, can be used as FISH probes to map individual BACs or BAC contigs to the chromosomes, thereby integrating the physical map, and often the genetic map, with specific chromosomes and/or chromosomal regions.
BAC clones that were previously anchored to the genetic map using either RFLP or SSR markers (Marek et al. 2001; Mudge et al. 2004) were selected to integrate the genetic and chromosome maps of LG L/chromosome 19 of soybean (Zou et al. 2003). Since we know relatively little about the sequence landscape of the soybean genome, a preliminary step of screening BACs using genomic DNA as a probe in Southern blot analysis was done to ensure that BACs with few repetitive sequences were chosen. Later it was determined that this step was unnecessary as most repetitive sequences appear to be sequestered in pericentromeric regions, and BACs from the euchromatic arm did not appear to have high-copy repeats as evidenced by lack of cross hybridization to other chromosomes.
Recombination has been observed to increase distally on chromosomes as shown in wheat (Faris et al. 2000) and mammals (reviewed in Lichten and Goldman 1995). Even with the paucity of markers used in this study, we observed an increase in recombination in the terminal portion of the long arm of this chromosome—a decrease in fragment length to centimorgan distance. Analysis of chromosome 19 also revealed that ∼25% of the genetic length (0–35 cM) resides in ∼17% of the chromosomal length (heterochromatin). Given the tight packaging of DNA into heterochromatin as evidenced by intense DAPI staining, it is likely that a much larger fraction of the chromosomal DNA resides in this recombinationally suppressed region. Although uneven distribution of recombination was observed, the map coverage, as evidenced by FISH mapping of the most-distal marker (pA802), did reveal good coverage of the long arm of chromosome 19. The short arm appears to be mostly heterochromatic and precise placement of individual BACs was complicated due to repetitive sequences.
Soybean is highly duplicated as evidenced by multiple RFLP bands (Shoemaker et al. 1996a) and by careful clustering and analysis of ESTs (Blanc and Wolfe 2004; Schlueter et al. 2004). Analysis of duplicate ESTs indicates that there have been at least two genomewide duplication events with disparate time estimates of 14 and 45 MYA (Schlueter et al. 2004) and ∼4 and 16 MYA (Blanc and Wolfe 2004). For the most part, soybean has diploid-like genetics but there are instances of inheritance ratios consistent with duplicate factor inheritance (Shoemaker et al. 1996b, 2004). Moreover, derived haploids do show some evidence of nonhomologous chromosome pairing, although part of the associations may be due to “chromosomal stickiness” (Crane et al. 1984). If the genomewide duplication events were a result of allo- or auto-polyploidy, then “diploidization” must have occurred subsequently to the polyploidy events to result in present-day soybean. Diploidization is hypothesized to occur via small or large chromosome-level rearrangements, i.e., inversions, translocations, and deletions, resulting in disomic pairing (Wolfe 2001; Levy and Feldman 2002). Even in rice with a haploid genome of ∼400 Mb, there is evidence of a polyploidization event followed by rapid diploidization consisting of rearrangements and deletions (Wang et al. 2005). Similar evidence for ancient polyploidization events followed by diploidization exists for Arabidopsis thaliana with an even smaller genome (∼120 Mb) (Vision et al. 2000; Blanc et al. 2003).
We found evidence of long-range interchromosomal homeology, i.e., synteny of seven BACs from the long arm of LG L on another chromosome—putatively a homeolog of LG L/chromosome 19. The extent of homeology among these chromosomes was unexpected. Genetic mapping has shown extensive interchromosomal homeology albeit segmentalized (Shoemaker et al. 1996a; http://soybase.org/data/dup_regions.html). Although all seven BACs were syntenous on other chromosomes, they were not completely colinear. Thus, intrachromosomal rearrangments have occurred, consistent with the hypothesis of chromosome-level diploidization.
Although soybean has had at least two rounds of polyploidization, only one additional hybridization signal was seen for each BAC. We hypothesize that the duplicate loci on the putative homeolog are derived from the more recent polyploidy event of either 4 or 14 MYA (Blanc and Wolfe 2004; Schlueter et al. 2004). This suggests that the more ancient duplication may be so diverged that it is not visible via this approach; i.e., it has insufficient sensitivity. This is corroborated by analysis of sequenced BACs from paralogous loci on LGs E and A2 that are estimated to have diverged 7–11 MYA (S. A. Jackson, R. C. Shoemaker and J.-Y. Lin, unpublished data) where the LG E BAC can be used as a FISH probe to detect the paralogous locus on LG A2 (Pagel et al. 2004).
The results presented herein are consistent with previous cytogenetic observations that the arms of most soybean chromosomes are, with the exception of a few short arms, highly euchromatic (Singh and Hymowitz 1988). Moreover, the lack of extensive cross hybridization from the BACs on the long arm together with our previous observations (Pagel et al. 2004; Lin et al. 2005) indicate that the euchromatic regions of the genome are mostly devoid of medium- to high-copy dispersed repeats. In fact, all the repetitive clones that we have analyzed thus far in this article and those in Lin et al. (2005) localize to the centromeric/pericentromeric regions. This suggests that high-copy repeats are not tolerated in the euchromatic regions either by exclusion from insertion or by efficient mechanisms of elimination (Devos et al. 2002; reviewed in Bennetzen et al. 2005).
Footnotes
Communicating editor: J. A. Birchler
Acknowledgement
The authors acknowledge funding from the National Science Foundation (DBI-0501877) and the United Soybean Board that supported this work.
References
Arumuganathan, K., and E. D. Earle,
Bennetzen, J. L., J. Ma and K. M. Devos,
Blanc, G., and K. H. Wolfe,
Blanc, G., K. Hokamp and K. H. Wolfe,
Cheng, Z. K., G. G. Presting, C. R. Buell, R. A. Wing and J. Jiang,
Cheung, V. G., N. Nowak, W. Jang, I. R. Kirsch, S. Zhao et al.,
Crane, C. F., W. D. Beversdorf and E. T. Bingham,
Cregan, P. B., T. Jarvik, A. L. Bush, R. C. Shoemaker, K. G. Lark et al.,
Devos, K. M., J. K. Brown and J. L. Bennetzen,
Doyle, J. J., J. L. Doyle, J. T. Rauscher and A. H. D. Brown,
Faris, J. D., K. M. Haen and B. S. Gill,
Goldberg, R. B.,
Gurley, W. B., A. G. Hepburn and J. L. Key,
Jackson, S. A., M-L. Wang, H. M. Goodman and J. Jiang,
Keim, P., B. W. Diers, T. C. Olson and R. C. Shoemaker,
Kulikova, O., G. Gualtieri, R. Geurts, D-J. Kim, D. Cook et al.,
Levy, A. L., and M. Feldman,
Lichten, M., and A. S. H. Goldman,
Lin, J-Y., B. Hass-Jacobus, P. SanMiguel, J. G. Walling, Y. Yuan et al.,
Marek, L. M., J. Mudge, L. Darnielle, D. Grant, N. Hanson et al.,
Mudge, J., Y. Huihuang, R. L. Denny, D. K. Howe, D. Danesh et al.,
Pagel, J., J. G. Walling, N. D. Young, R. C. Shoemaker and S. A. Jackson,
Schlueter, J. A., P. Dixon, C. Granger, D. Grant, L. Clark et al.,
Shoemaker, R. C., K. Polzin, J. Labate, J. Specht, E. C. Brummer et al.,
Shoemaker, R., T. Olson and V. Kanazin,
Shoemaker, R., P. Cregan and L. Vodkin,
Singh, R. J., and T. Hymowitz,
Song, Q., L. Marek, R. Shoemaker, G. Lark, V. Concibido et al.,
Vision, T. J., D. G. Brown and S. D. Tanksley,
Walling, J. G., J. C. Pires and S. A. Jackson,
Wang, X., X. Shi, B. Hao and J. Luo,
Wolfe, K. H.,
Zhong, X., P. F. Fransz, E. J. van Wennekes, P. Zabel, A. van Kammen et al.,
Zhu, Y.-L, Q-J. Song, D. L. Hyten, C. P. Van Tassell, L. K. Matukumalli et al.,
Zou, J. J., R. J. Singh, J. Lee, S. J. Xu, P. B. Cregan et al.,
