


Abstract
The third hypervariable (V3) region of the HIV-1 gp120 protein is responsible for many aspects of viral infectivity. The tertiary structure of the V3 loop seems to influence the coreceptor usage of the virus, which is an important determinant of HIV pathogenesis. Hence, the information about preferred conformations of the V3-loop region and its flexibility could be a crucial tool for understanding the mechanisms of progression from an initial infection to AIDS. Taking into account the uncertainty of the loop structure, we predicted the structural flexibility, diversity, and sequence fitness to the V3-loop structure for each of the sequences serially sampled during an asymptomatic period. Structural diversity correlated with sequence diversity. The predicted crown structure usage implied that structural flexibility depended on the patient and that the antigenic character of the virus might be almost uniform in a patient whose immune system is strong. Furthermore, the predicted structural ensemble suggested that toward the end of the asymptomatic period there was a change in the V3-loop structure or in the environment surrounding the V3 loop, possibly because of its proximity to the gp120 core.
ONE of the most crucial events during virus infection is target cell entry by virus particles. Human immunodeficiency virus type 1 (HIV-1) first binds to the cell surface molecule CD4 to enter its target cell. Then, to accomplish the cell entry the virus needs a secondary receptor, which was found to be the chemokine receptor CCR5, CXCR4, or both (Berger et al. 1998). In the process of viral infection, the virus changes its coreceptor usage from CCR5 use to CXCR4 use in ∼50% of infected individuals. This switch of the coreceptor usage was found to be associated with acceleration of decrease in CD4 cell count and hence it could be an important determinant of HIV pathogenesis (see review by Regoes and Bonhoeffer 2005). However, the mechanism of coreceptor switching is still unclear.
Patterns of molecular evolution consistent with the coreceptor usage have been analyzed within single patients (Shankarappa et al. 1999; Jensen et al. 2003). The third hypervariable (V3) region is likely influenced by coreceptor usage. The V3 region is a surface-accessible loop formed by a disulfide bridge between two invariant cysteines at positions 296 and 330 of the external envelope protein gp120 (numbered according to Wolfs et al. 1990). Sequence variation in the V3 region has been linked to changes in several different phenotypes: cell tropism (Cann et al. 1992; Stamatatos and Cheng-Mayer 1993; Chavda et al. 1994), the ability to induce syncytia (de Jong et al. 1992b; Fouchier et al. 1992), and progression from an initial infection to AIDS (Distler et al. 1995). These phenotypes were often found to be associated with the differential use of chemokine receptors. Viruses that use the chemokine receptor CCR5, CXCR4, or both are termed R5, X4, and R5X4, respectively (Berger et al. 1998).
Intrahost populations of HIV-1 show considerable genetic diversity due to high rates of mutation (Shankarappa et al. 1999; Jung et al. 2002). Furthermore, positive selection in viral evolution is a key process both for drug resistance (Frost et al. 2001; Leal et al. 2004) and for immune escape (Yang et al. 2000; Ross and Rodrigo 2002; Williamson 2003). Distler et al. (1995) found that the only amino acid substitution consistently associated with reduced CD4 cell counts and progression to AIDS was a substitution at position 306 in the V3 region. Fouchier et al. (1992) found that two amino acid residues, at positions 306 and 320, were responsible for differences in the viral phenotype, including fusion capacity and monocytotropism. In a study by de Jong et al. (1992a) it was found that mutation at position 306 required an additional mutation at position 320 or 324 for full expression of the syncytium-inducing, high-replicating phenotype. These studies have led to the identification of putative motifs that distinguish between phenotypes. Moreover, a rule for motif structure was derived from the motifs: the 11/25 or the charge rule (Coakley et al. 2005). Furthermore, by using an information-theoretic analysis, Korber et al. (1993) have found several covarying mutations at pairs of sites. The correlation between mutations at those sites suggests that conformational changes play an important role.
The ability of the virus to infect depends mostly on the tertiary structure of the receptor-binding site for the virus (Kwong et al. 2002; Gamblin et al. 2004). The gp120 glycoprotein experiences several different conformational states. Among the changes in conformation that can occur is variation in V3 shape or exposure, as shown by changes in V3 reactivity with conformation-dependent antibodies (Stamatatos and Cheng-Mayer 1995). Hence, learning more about the tertiary structure of the virus-receptor binding region should help to explain the mechanism of viral infection.
To date, the only available crystal structures for gp120 are for deglycosylated core regions of the proteins from the laboratory-adapted X4 and the primary R5 isolates, where 52 N- and 19 C-terminal amino acids, 67 V1/V2 amino acids, and 32 V3-loop residues (amino acids 298–329) have been deleted (Kwong et al. 1998, 2000; Huang et al. 2004). While the structural data were not complete, Kwong et al. (2000) found an important feature—that the gp120 core structures of X4 and R5 isolates were very similar, although their antigenic characters were extremely different. Together with chimeric substitution and sequence analysis, their finding suggests that coreceptor selection and neutralization resistance are specified by the major variable loops, V1/V2 and V3. Hence, to study the immunological characters of gp120, we should look at those variable loops. Furthermore, on the basis of the structure of a complex of the truncated version of gp120, the V3 loop is expected to be close to a conserved area of gp120 thought to interact with coreceptors (Wyatt et al. 1998) and hence it seems to be that the tertiary structure of the V3 loop influences to the coreceptor usage of the virus.
To determine the conformation of the V3 loop, Fab fragments of neutralizing antibodies in complex with V3-loop peptides were studied by X-ray crystallography; however, only parts of V3-loop structure were determined (Stanfield et al. 1999, 2003). This is undesirable, since the integrity of the loop is considered to be a critical factor in stabilization of the structural and functional motifs of the V3 domain. Thus, significant questions about the structure of the V3 loop remain to be addressed.
The consensus sequence of the V3 region (LaRosa et al. 1990) has been examined by proton two-dimensional nuclear magnetic resonance (NMR) spectroscopy (Vranken et al. 2001). The nuclear Overhauser effect data support a β-turn conformation in water for the central conservative Gly–Pro–Gly (GPG) region and point toward partial formation of a helix in the C-terminal section. Upon addition of trifluoroethanol, a C-terminal helix is formed. The C-terminal helix is amphipathic and common to the V3 regions from other strains that were examined: Thailand, MN, Haiti, and RF (Catasti et al. 1995, 1996). Thus, the C-terminal helix may be an important feature for V3-loop function(s). It has been suggested that a conserved secondary structure within the V3 loop, most likely an α-helix, is required for interaction with coreceptors (Hung et al. 1999).
There should be a reason why HIV-1 virus switches its coreceptor usage in the course of infection. Various hypotheses explaining the coreceptor switching have been proposed. Regoes and Bonhoeffer (2005) concluded in their review that a quantitative analysis of the interaction between the virus and immune cells is required to judge those hypotheses. As we have explained in the previous paragraph, the tertiary structure of the V3 loop seems to influence to the coreceptor usage of the virus. To make this point clear, we examined the dynamics of structural flexibility and sequence fitness to structure of the V3 region within a single host. Using the existing structural information obtained by X-ray crystallography and NMR spectroscopy, we were able to define the “universe” (full spectrum) of V3-loop structures. For each sequence, the structural distribution in the universe was estimated with use of Bayes' theorem and information about amino acid preference of the structural environment. The strength of sequence fitness to the V3-loop structure was also calculated, taking into account the uncertainty of the structure, and it was found that toward the end of the asymptomatic period, the sequence fitness to the structure had weakened. The results of analysis of viral sequences within patients implied that the structural flexibility depended on the patient. We discuss possible sources of these structural features of the V3 loop.
MATERIALS AND METHODS
Set of V3 sequences:
Tertiary structures of V3 sequences of the HIV-1 env gene obtained at multiple time points covering 6–12 years of infection from patients enrolled in the Multicenter AIDS Cohort Study were examined. These sequences were analyzed by Shankarappa et al. (1999) and consist of viral sequences isolated from peripheral blood mononuclear cells and of parallel sequences isolated from the plasma. Shankarappa et al. (1999) studied the evolution of the C2–V5 region from nine patients and found a clear pattern characterizing the sequences at a given time point. They found that sequence divergence, which can be defined as the evolutionary distance from an early founder sequence, increased linearly during the first phase of the infection. At a later stage, divergence tended to stabilize. Diversity increased at the initial phase and stabilized or declined from the intermediate phase forward.
We extracted sequences of the V3 region from the same sequence data sets. The data set from patient 8 includes 119 sequences, of which 26 sequences have an insertion of three amino acids at the GPG motif region. To avoid unreliable inference from the local structure of V3 region, we decided not to use this data set. The data set from patient 9 consists of 113 sequences, 4 of which have one amino acid insertion at the C-terminal region of V3 and were excluded from the analysis. In most cases, the V3 loop is formed by a disulfide bridge between two cysteines at positions 296 and 330. However, a few of the sequences in the data sets contain another amino acid at 296 or 330 and were excluded from the analysis. We examined tertiary structures of V3 sequences from eight patients. They consist of 35 amino acid residues and form a disulfide bridge between two cysteines.
X4 sequences:
Identification of the X4 sequence was done using the 11/25 rule (Coakley et al. 2005). Recent works have proposed sophisticated methods to predict coreceptor usage by the virus (Resch et al. 2001; Jensen et al. 2003). However, the 11/25 rule is still one of the best available motif-based predictors of coreceptor usage. In the data sets from patients 5, 6, 7, 9, and 11, we did not obtain a sufficient number of X4 sequences. This is in contrast to results with patients 1, 2, and 3, as previously shown by Shankarappa et al. (1999).
Structural ensemble:
The polypeptide chain of the V3 loop has >100 atoms and hence there are a huge number of possible interactions between atoms. In general, this complexity hampers prediction of the tertiary structure of proteins. However, a recent study suggests that the fundamental physics that underlie the folding process from nonnative structure to native structure of protein may be simpler than previously thought (Baker 2000). Different groups used a variety of approaches to model the trade-off between one attractive native interaction and another (Alm and Baker 1999; Galzitskaya and Finkelstein 1999; Muñoz and Eaton 1999). The success of these models supports two ideas: first, that the topology of the native state determines the overall features of protein-folding reactions and second, that nonnative interaction plays a relatively minor role. On the basis of the pairwise interactions between the carbon atoms on the backbone (Cα) and/or the side chains (Cβ), several knowledge-based methods have been proposed (Jones et al. 1992; Sasai 1995; Domingues et al. 1999). Comparative modeling based on alignment to one or more related protein structures produces highly accurate structure predictions (Baker and Sali 2001). These methods predict the most likely structure of the sequence.
Categories of residue burial and pairwise distances
Categories | |
|---|---|
| Environment classa | 0–4, 5–10, 11–16, 17–22, 23–28, >28 |
| Environment class for pairwise terma | 0–16, >16 |
| Pairwise distance (small interval)b | 0–4, 5–6, 7–8, 9–10, >10 |
| Pairwise distanceb | 0–8, 9–10, 11–12, 13–14, 15–16, >16 |
Categories | |
|---|---|
| Environment classa | 0–4, 5–10, 11–16, 17–22, 23–28, >28 |
| Environment class for pairwise terma | 0–16, >16 |
| Pairwise distance (small interval)b | 0–4, 5–6, 7–8, 9–10, >10 |
| Pairwise distanceb | 0–8, 9–10, 11–12, 13–14, 15–16, >16 |
For environmental class, each category represents a range of values for the number of Cα atoms that surround the Cα atom of the corresponding residue inside the 10-Å radius sphere.
For pairwise distance, each category represents a range of spatial distances (Å) between the Cα atoms of the corresponding residues.
. The interaction between residue pairs with small site intervals plays an important role in making local conformation like an α-helix structure. Hence we decided to treat separately the interaction between residues with small site intervals
The population of V3-loop structures and prior distribution:
NMR data for V3-loop structure (PDB code 1CE4) (Vranken et al. 2001) resulted in 20 models, representing the structural diversity of the loop when viewed at moderate resolution (Figure 1a). Furthermore, the five existing crown structures (PDB codes 1CE4, 1NJ0, 1B03, 1ACY, and 1K5M) (Ghiara et al. 1994; Balbach et al. 2000; Vranken et al. 2001; Ding et al. 2002; Sharon et al. 2003; Figure 1b) have provided additional information on the diversity of the crown structure. These two sources of structural data can be regarded as samples from the population of the structures. The population of V3-loop structures and the prior distribution,
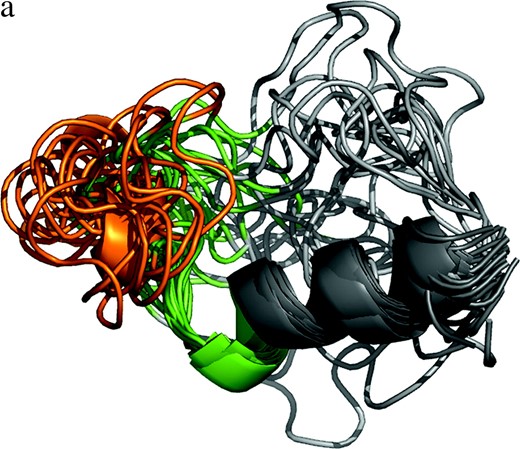
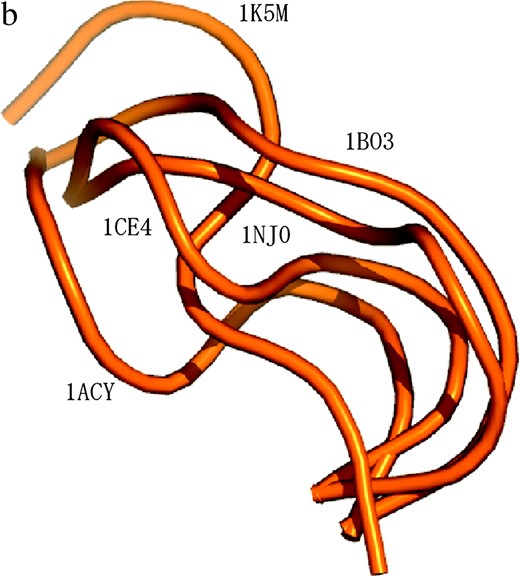
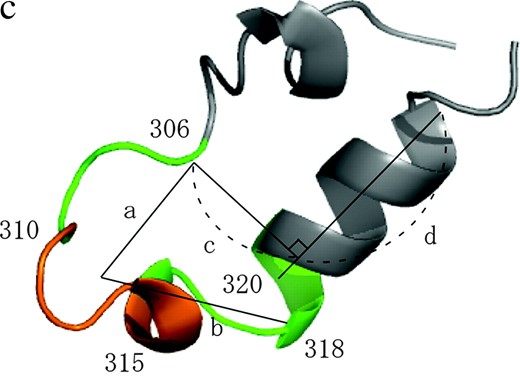
Measured structures of V3 loop and characterization of the locality around the crown region. (a) NMR-based V3-loop structures. The 20 models were superposed by use of the α-helix region (residues 318–330; in dark gray). The crown region is orange. We studied the structural ensemble of the locality consisting of the V3 loop and flanking sites (in green). (b) The five structures of the V3 crown measured in previous work (1CE4, 1NJ0, 1B03, 1ACY, and 1K5M). The three-dimensional coordinates (x, y, z) of the five crowns were set as explained in the main text. (c) Four structural parameters used to characterize the locality around the crown region.
Presampling of loop structures to construct the population of the crown structures:
In the first step, loop structures were generated from the distribution among the 20 models of the NMR data by the Markov chain Monte Carlo (MCMC) method. Preserving the bond lengths and the chemical structures of amino acid residues, the torsion angles were updated in the proposal step. At each step, one residue was randomly selected and its two torsion angles (ϕ, φ) were updated. The acceptance rate was specified on the basis of the likelihoods of the current and proposed structural features in the following way. The V3 loop has a helical structure at the C-terminal region and a disulfide bridge between the two cysteines (Figure 1, a and c). The helical structure (residues 318–330) was largely conserved in the NMR data, while the N-terminal region (residues 296–305) was completely disordered (Figure 1a). Therefore, we decided not to consider the N-terminal region and to express the structural variability of the locality around the crown region (residues 306–320). First, the structure of the α-helix region was fixed with the torsion angles set at the average of the 20 NMR-based models. We introduced four parameters to describe the area (Figure 1c). The parameter a (b) is the spatial distance between the centroid of the Cα atoms at the crown (residues 310–315) and the Cα atom at residue 306 (318). The parameter c represents the spatial distance between the Cα atoms at residue 306 and the α-helix at the C-terminal region. The parameter d is for the projected position of the Cα atom at residue 306 onto the α-helix at the C-terminal region.
Discarding the first 10,000 structures as burn-in, we next sampled 1 structure out of 100 iterations. In total, we collected 10,000 loop structures. To have an unbiased picture of the structural ensembles of the crown, we extracted 100 nonredundant crown structures out of those in the loop structures (sampled above) in the following way.
The population of the structure of the V3 crown:
The large difference among the 5 measured crown structures necessitates construction of a population of diversified crown structures. For each of the 10,000 crown structures, we calculated RMSDs from the 5 structures. Assuming a normal distribution with mean of 3.06 Å and standard deviation of 0.73 Å, we selected the crown structure whose RMSDs had the highest likelihood. This structure and the above 5 structures comprise an extended set of nonredundant crown structures. At each step, RMSDs between each of the candidates in the remaining set and the members of the set of nonredundant structures at the time were evaluated. The candidate with the highest likelihood was added to the set of the nonredundant structures. In this way, we extracted 100 crown structures out of 10,000. The set of 105 nonredundant crown structures was regarded as a population of the crown structure.
The V3 loop structure population and prior distribution:
For each member of the population of crown structures, we constructed a population of V3-loop structures in the same way as for the presampling procedure, using MCMC (described above). At this time, new structures were proposed without changing the crown structure. For each crown structure, 1000 structures were collected. We considered a uniform distribution as the prior distribution of the crown structure,
Structural entropy and sequence–structure fitness:
RESULTS
Evolutionary history of V3 sequences and structural ensembles:
Figure 2 shows the phylogenetic relationships between the V3 amino acid sequences from patients 1, 2, and 3. The trees were obtained using the maximum-parsimony method and were based on the topologies of the maximum-likelihood trees of the C2–V5 region of env sequences. Coreceptor usage and the time points of sequence appearance are illustrated by colored circles and numbers in the circles (see the Figure 2 legend). Shankarappa et al. (1999) categorized time points postinfection into three periods, asymptomatic infection periods I, II, and III (AIP I, II, and III) based on sequence divergence from the founder and sequence diversity. In AIP I, the amount of extant sequence diversity and divergence from the founder increases linearly. In AIP II, sequence divergence keeps increasing, but diversity stabilizes or decreases. In AIP III, divergence becomes stable and diversity is stable or decreases. The lineages of R5 sequences in AIP I and of X4 sequences were clearly separated, excepting a few of the X4s in AIP I. The R5 sequences in AIP III followed the X4 lineage in all three patients.
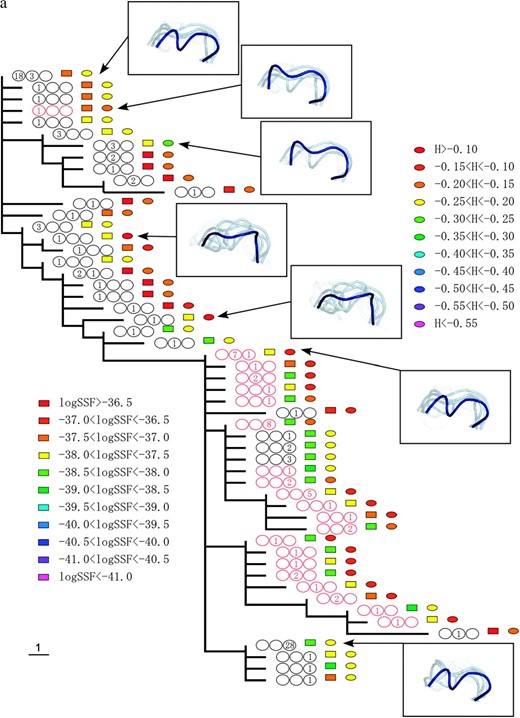
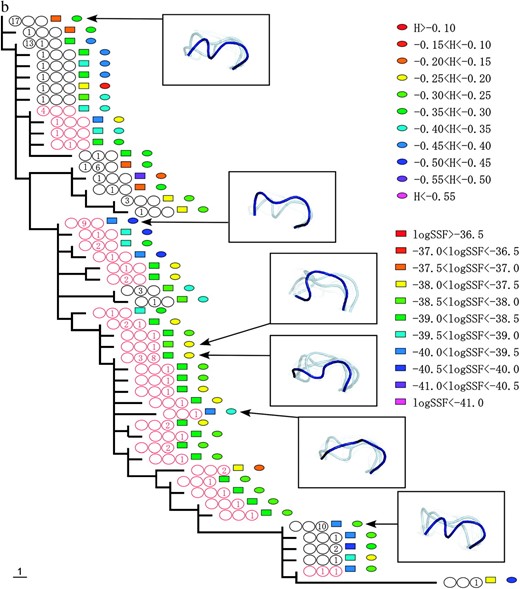
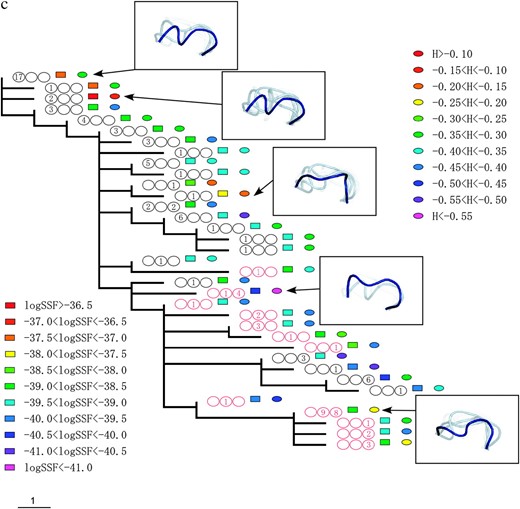
The phylogenic relationships between V3 amino acid sequences from patients 1 (a), 2 (b), and 3 (c). The trees were obtained by the maximum-parsimony method on the basis of the topologies of the maximum-likelihood trees of the C2–V5 region of env sequences. X4 sequences are indicated by red circles. The period in which the sequence appeared is indicated by a number in the circles, and the numbers themselves correspond to the number of sequences isolated during the specified time period. The left, middle, and right circles correspond to AIP I, II, and III, respectively. The colored squares show the range of the logarithms of SSF (“log SSF”) and the colored circles indicate the range of structural entropy (“H”). The values for structural entropy were subtracted by the value of the maximum entropy (= log 105). Some of the crown structure usages are illustrated. The crown with the highest posterior probability (in deep blue), crowns in the 10th percentile of posterior probability (in light blue), and those in the 20th percentile of posterior probability (in light gray) are shown.
Crown structure usages of some sequences are illustrated in Figure 2. In these illustrations, the crown with the highest posterior probability is shown in deep blue, and crowns in the upper 10th and 20th percentiles of posterior probability are shown in light blue and in light gray, respectively. The illustrations for sequences with high structural entropy contain a relatively large number of crowns. The crown with the highest posterior probability for each sequence was within a small subgroup of 105 crowns. For patient 1, the subgroup consists of 3 crowns. For patient 2 (3), it contains 5 (4) crowns. However, the structural entropies of sequences were different from each other and the structural ensemble depended on the sequence. Furthermore, we observed a strong correlation between structural entropy (
Figure 2 also shows the changes in logarithm of SSF and structural entropy along the phylogenic tree. The logarithm of SSF is indicated by the colored squares and structural entropy is shown by the colored circles (see Figure 2 legend).
Structural flexibility and diversity of X4 and R5 sequences:
We examined the dynamics of structural entropy, which is a measure of structural flexibility of the crown (Figure 3). In patient 1, the X4 sequences had relatively high structural flexibility as compared to those of R5 sequences. However, in the other patients, we did not observe a similar difference in the structural flexibility of the X4 and R5 sequences. We also evaluated the average of the structural entropy among all sequences in a patient (
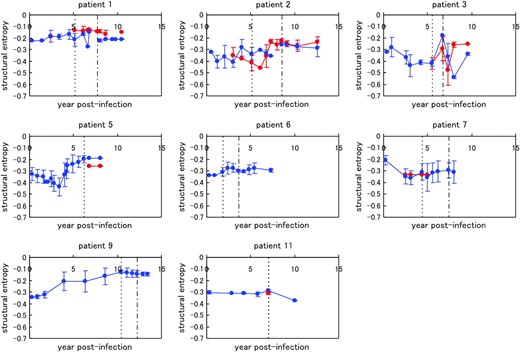
Chronological changes in the average structural entropy in the eight patients, shown with standard deviation. Data for the X4 sequences are indicated by red lines and those for the R5 sequences are in blue. The dotted vertical line for each patient indicates the border between AIP I and II, and the dotted-dashed vertical line for each patient (except patients 5 and 11) shows the border between AIP II and III. The values for structural entropy were subtracted by the value of the maximum entropy (= log 105).
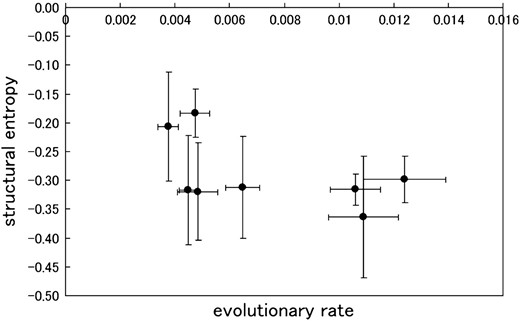
The mean values of structural entropy, which were subtracted by the value of the maximum entropy (= log 105), compared with evolutionary rates in the eight patients.
Mean and standard deviation of structural entropy, sequence diversity, and the decay of sequence–structure fitness within patients during the asymptomatic period
Patient index | Evolutionary ratea (×10−3) | Structural entropyb | Slopec | Interceptc | Correlation coefficient (P-value)c | Correlation coefficient (P-value)d |
|---|---|---|---|---|---|---|
| p1 | 4.73 (0.543) | −0.183 (0.0418) | −0.163 (0.0343) | −36.6 (0.232) | 0.795 (4 × 10⁻⁴) | 0.797 (4 × 10⁻⁴) |
| p2 | 4.83 (0.728) | −0.319 (0.0846) | −0.136 (0.0207) | −37.6 (0.144) | 0.885 (3 × 10⁻⁵) | 0.841 (2 × 10⁻⁴) |
| p3 | 10.9 (1.28) | −0.363 (0.106) | −0.212 (0.0648) | −37.6 (0.366) | 0.756 (0.01) | 0.771 (9 × 10⁻³) |
| p5 | 4.49 (0.337) | −0.317 (0.0949) | −0.0785 (0.0542) | −37.7 (0.233) | 0.361 (0.17) | 0.926 (3 × 10⁻⁷) |
| p6 | 12.4 (1.51) | −0.298 (0.0400) | −0.0451 (0.0244) | −37.6 (0.0960) | 0.547 (0.10) | 0.887 (6 × 10⁻⁴) |
| p7 | 6.48 (0.620) | −0.312 (0.0889) | −0.157 (0.0439) | −37.1 (0.231) | 0.804 (9 × 10⁻³) | 0.957 (5 × 10⁻⁵) |
| p9 | 3.75 (0.374) | −0.206 (0.0945) | −0.114 (0.0276) | −39.3 (0.251) | 0.794 (2 × 10⁻³) | 0.901 (6 × 10⁻⁵) |
| p11 | 10.6 (0.917) | −0.316 (0.0274) | 0.0002 (0.0164) | −38.2 (0.0968) | 0.005 (0.99) | 0.263 (0.62) |
The evolutionary rate of the env sequences (Seo et al. 2002).
The average values for structural entropy over all time points were subtracted by the value of the maximum entropy (= log 105).
The logarithm of the average SSF was regressed on the number of years postinfection (see main text). Standard errors are given in parentheses of the slope and intercept columns. P-values are given in parentheses of correlation coefficient column.
Correlation between the dynamics of structural diversity and those of sequence diversity.
We compared the structural diversity (
Strength of sequence fitness to the V3-loop structure of X4 and R5 sequences:
The approach we used to evaluate the distribution of the V3-loop structure also gave us the SSF, taking into account the uncertainty of the structure, as defined in Equation 6. Figure 5 shows the chronological change in the average SSF in all eight patients. The average SSFs among R5 and X4 sequences are shown separately. The SSF for X4 was relatively low in comparison to that of R5 in AIP I. In patients 1 and 2, the SSF of R5 rapidly declined during AIP II. In all patients, the SSF seemed to decrease as the infection progressed. We also evaluated the average SSF among all sequences at the given time point and performed regression analysis. We fit a linear equation to the logarithm of the average SSF (Table 2). The slope represents the decay rate and the intercept expresses the SSF at the time of infection. In patients 1, 2, 3, 7, and 9, the correlation coefficients were negative and the corresponding absolute values were >0.75. The P-values for those patients were <0.05. Hence, in those five patients, the average SSF clearly decreased as the infection progressed. In Figure 6, we compared the slope values with the evolutionary rates in the five patients. We performed regression analysis and observed a high negative correlation, with a correlation coefficient R = −0.93 and P-value P = 0.02 (<0.05).
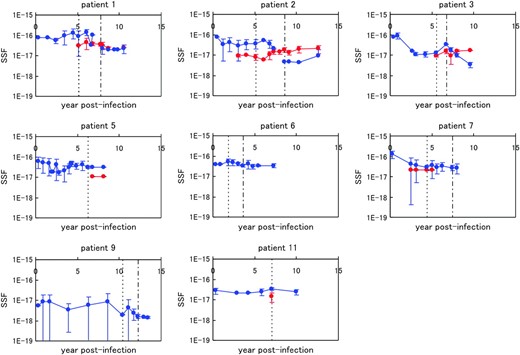
Chronological changes in the average SSF in the eight patients, shown with standard deviations. The data for the X4 sequences are indicated by red lines and those for the R5 sequences are in blue. The dotted vertical line for each patient indicates the border between AIP I and II, and the dotted-dashed vertical line for each patient (except patients 5 and 11) shows the border between AIP II and III.
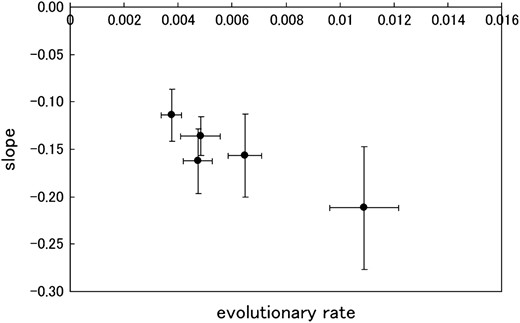
Decay of SSF during the asymptomatic period and comparison among patients. The slope values of the regression analysis were compared with the evolutionary rates in the five patients, in which the logarithms of the average sequence–structure fitness negatively correlate with the progression of infection.
DISCUSSION
Here, we examined the tertiary structure of the V3 loop of the HIV-1 gp120 protein, making use of the structural ensemble. In our analysis, the structural ensemble was consistent with structural variability for the area of the crown region, including flanking sites (residues 306–320). This region had previously been found to be flexible, using an NMR spectroscopy-based approach. Several authors have proposed structures for the crown but intriguingly the proposed structures were significantly different from one another. We estimated the full range of V3-loop structures with 105 nonredundant crown structures. This structural universe enabled us to evaluate both the structural flexibility and the sequence fitness to the loop structures and, in addition, enabled us to observe the dynamics of structural adaptation of the virus in a single host. The latter seems to be difficult to observe using purely experimental approaches.
We evaluated the structural diversity and entropy of the crown region in the eight patients, with the hope that the analysis would help us to learn more about viral adaptation in a single host. Structural diversity was found to correlate with diversity of the V3-loop sequence. This suggests that sequence variability inflated the variability of structure. Furthermore, a high correlation between the structural entropy and the average RMSD (Equation 4) was observed. This implies that in the ensemble with lower structural flexibility measured by the entropy, the main crown components of the ensemble were those with similar structures. The V3 loops with similar crown structures potentially cause similar antigenic character of the viruses. In this sense, the antigenic character of the sequence with the lower structural flexibility is nearly specific. We found that the mean and standard deviation of the structural entropies during the asymptomatic period depended on the patient. Since the structural flexibility (entropy) of the V3 crown region is an important factor for antigenicity, the patient-specific dependence of entropy might itself depend on specific properties of each patient's immune system. In the eight patients, the structural entropy was relatively high in comparison to the maximum entropy (= log 105). It seems that the high entropy of the V3-loop region is a crucial feature of the virus under the strong selection pressure of the immune system. The mean values for structural entropy negatively correlated with evolutionary rates. Therefore, for a patient in whom the rate of sequence evolution is high, the antigenic character of each virus might be specific. However, the correlation coefficient between the mean values of the structural entropies and the evolutionary rates of the sequences was low (R = −0.53) and the P-value was large (P = 0.17). Hence, in this work, we could not fully clarify this point.
The predicted ensemble of the structure showed that toward the end of the asymptomatic period, SSF decreased. The low level of the SSF may be an indicator of structural change in the V3 loop. Or, it may be attributable to an interaction with the gp120 core; our analysis did not incorporate these interactions. Once the structure of the complete gp120 is measured, it should become possible to look at the dynamics of the interaction between the V3 loop and the gp120 core. In the three patients (1, 2, and 3) with relatively large numbers of X4 sequences, we compared the SSF of X4 and R5 sequences and found that the SSF of X4 sequences was lower than that of R5 sequences in AIP I and II. The SSF of R5 sequences in AIP III was comparable to or lower than that of X4. These results suggest that structural change in the V3 loop or the change in interaction with the gp120 core was brought on by X4 sequences and then followed by R5 sequences in AIP III. In addition, the decay rate of SSF was larger when the sequences evolved faster. We postulate that the evolutionary rate could increase if the viral sequences experienced strong positive selection, for example, in a patient whose immune system is strong. This would mean that under the pressure of positive selection, evolution of the V3 loop effectively accelerates to change the structure of the loop and/or its interaction with the gp120 core.
Footnotes
Communicating editor: S. Yokoyama
Acknowledgement
We thank Jeffrey L. Thorne and Keiko Udaka for useful advice. This work was supported by the Institute for Bioinformatics Research and Development of the Japan Science and Technology Agency and the Japan Society for the Promotion of Science.
References
Alm, E., and D. Baker,
Baker, D., and A. Sali,
Balbach, J. J., J. Yang, D. P. Weliky, P. J. Steinbach, V. Tugarinov et al.,
Berger, E. A., R. W. Doms, E. M. Fenyo, B. T. Korber, D. R. Littman et al.,
Cann, A. J., M. J. Churcher, M. Boyd, W. O'Brien, J. Q. Zhao et al.,
Catasti, P., J. D. Fontenot, E. M. Bradbury and G. Gupta,
Catasti, P., E. M. Bradbury and G. Gupta,
Chavda, S. C., P. Griffin, Z. Han-Liu, B. Keys, M. A. Vekony et al.,
Coakley, E., C. J. Petropoulos and J. M. Whitcomb,
de Jong, J. J., A. de Ronde, W. Keulen, M. Tersmette and J. Goudsmit,
de Jong, J. J., J. Goudsmit, W. Keulen, B. Klaver, W. Krone et al.,
Ding, J. A., D. Smith, S. C. Geisler, X. Ma, G. F. Arnold et al.,
Distler, O., P. W. McQueen, M. L. Tsang, L. A. Evans, L. Hurren et al.,
Domingues, F. S., W. A. Koppensteiner, M. Jaritz, A. Prlic, C. Weichenberger et al.,
Fouchier, R. A., M. Groenink, N. A. Kootstra, M. Tersmette, H. G. Huisman et al.,
Frost, S. D. W., H. F. Günthard, J. K. Wong, D. Havlir, D. D. Richman et al.,
Galzitskaya, O. V., and A. V. Finkelstein,
Gamblin, S. J., L. F. Haire, R. J. Russell, D. J. Stevens, B. Xiao et al.,
Ghiara, J. B., E. A. Stura, R. L. Stanfield, A. T. Profy and I. A. Wilson,
Hobohm, U., and C. Sander,
Huang, C.-C., M. Venturi, S. Majeed, M. J. Moore, S. Phogat et al.,
Hung, C.-S., N. V. Heyden and L. Ratner,
Jensen, M. A., F.-S. Li, A. B. van 't Wout, D. C. Nickle, D. Shriner et al.,
Jones, D. T., W. R. Taylor and J. M. Thornton,
Jung, A., R. Maier, J. P. Vartanian, G. Bocharov, V. Jung et al.,
Korber, B. T. M., R. M. Farber, D. H. Wolpert and A. S. Lapedes,
Kwong, P. D., R. Wyatt, J. Robinson, R. W. Sweet, J. Sodroski et al.,
Kwong, P. D., R. Wyatt, S. Majeed, J. Robinson, R. W. Sweet et al.,
Kwong, P. D., M. L. Doyle, D. J. Casper, C. Cicala, S. A. Leavitt et al.,
LaRosa, G. J., J. P. Davide, K. Weinhold, J. A. Waterbury, A. T. Profy et al.,
Leal, É. de S., E. C. Holmes and P. M. de A. Zanotto,
Muñoz, V., and W. A. Eaton,
Regoes, R. R., and S. Bonhoeffer,
Resch, W., N. Hoffman and R. Swanstrom,
Ross, H. A., and A. Rodrigo,
Sasai, M.,
Seo, T.-K., J. L. Thorne, M. Hasegawa and H. Kishino,
Shankarappa, R., J. B. Margolick, S. J. Gange, A. G. Rodrigo, D. Upchurch et al.,
Shannon, C. E.,
Sharon, M., N. Kessler, R. Levy, S. Zolla-Pazner, M. Görlach et al.,
Simons, K. T., R. Bonneau, I. Ruczinski and D. Baker,
Simons, K. T., I. Ruczinski, C. Kooperberg, B. A. Fox, C. Bystroff et al.,
Stamatatos, L., and C. Cheng-Mayer,
Stamatatos, L., and C. Cheng-Mayer,
Stanfield, R. L., E. Cabezas, A. C. Satterthwait, E. A. Stura, A. T. Profy et al.,
Stanfield, R. L., J. B. Ghiara, E. O. Saphire, A. T. Profy and I. A. Wilson,
Vranken, W. F., F. Fant, M. Budesinsky and F. A. M. Borremans,
Williamson, S.,
Wolfs, T. F. W., J.-J. de Jong, H. van den Berg, J. M. G. H. Tijnagel, W. J. A. Krone et al.,
Wyatt, R., P. D. Kwong, E. Desjardins, R. W. Sweet, J. Robinson et al.,
Yang, Z., R. Nielsen, N. Goldman and A. M. K. Pedersen,
