


Abstract
The extent to which epistasis contributes to adaptation, population differentiation, and speciation is a long-standing and important problem in evolutionary genetics. Using recombinant inbred (RI) lines of Arabidopsis thaliana grown under natural field conditions, we have examined the genetic architecture of fitness-correlated traits with respect to epistasis; we identified both single-locus additive and two-locus epistatic QTL for natural variation in fruit number, germination, and seed length and width. For fruit number, we found seven significant epistatic interactions, but only two additive QTL. For seed germination, length, and width, there were from two to four additive QTL and from five to eight epistatic interactions. The epistatic interactions were both positive and negative. In each case, the magnitude of the epistatic effects was roughly double that of the effects of the additive QTL, varying from −41% to +29% for fruit number and from −5% to +4% for seed germination, length, and width. A number of the QTL that we describe participate in more than one epistatic interaction, and some loci identified as additive also may participate in an epistatic interaction; the genetic architecture for fitness traits may be a network of additive and epistatic effects. We compared the map positions of the additive and epistatic QTL for germination, seed width, and seed length from plants grown in both the field and the greenhouse. While the total number of significant additive and epistatic QTL was similar under the two growth conditions, the map locations were largely different. We found a small number of significant epistatic QTL × environment effects when we tested directly for them. Our results support the idea that epistatic interactions are an important part of natural genetic variation and reinforce the need for caution in comparing results from greenhouse-grown and field-grown plants.
THE term “epistasis” has a number of different, yet related, meanings in the various subdisciplines of genetics (Avery and Wasserman 1992; Phillips 1998). Each of the different uses of epistasis has the sense of a phenotype dependent upon interactions between alleles at different loci. In population, evolutionary, or quantitative genetics, epistasis is broadly defined as nonadditive interactions between alleles at different genes.
How much does epistasis for fitness contribute to local adaptation, population differentiation, and speciation? This question dates back more than 75 years to the differing views of Fisher and Wright, summarized in Fisher (1958) and Wright (1984), on the genetic basis of evolutionary change. Wright viewed epistatic interactions as an essential component of moving from one adaptive peak to another. On the other hand, Fisher emphasized the additive effects of genes, summarized in his Fundamental Theorem of Natural Selection as a population's response to natural selection being proportional to the additive genetic variance of fitness in the population (Fisher 1958).
One way to view the question of the importance of epistasis is from the perspective of a new mutant allele. If epistasis is prevalent, then a new mutant allele will interact with many other loci and alleles in the genetic background, and its fitness may be based not only upon its direct effects on the phenotype, but also upon its effects through the interactions. If additivity among loci is prevalent, then the fitness of a new mutant allele will depend more upon its direct effects on the phenotype. With epistatic interactions, the effect of a gene on a phenotype is a collective property of a network of genes, rather than a property of a gene itself (Wade 2002). We need to know the extent and nature of epistatic interactions to understand the genetic architecture of any quantitative trait, including fitness.
Recently, there has been a resurgence of interest in the role of epistasis in evolutionary biology as new theoretical and experimental approaches have been developed (Coyne et al. 2000; Goodnight and Wade 2000; Whitlock and Phillips 2000; Wolf et al. 2000). One example of this is in metapopulation biology. The existence of epistasis within small demes permits a more rapid response of the demes to selection than would be expected solely on the basis of the additive variation present (Whitlock et al. 1993; Wade and Goodnight 1998; Goodnight 2000); group selection permits changes that exploit the epistatic variance as well. There has also been extensive investigation of the theoretical basis for the conversion of epistatic variance to additive variance after a population bottleneck (Goodnight 1995; Cheverud and Routman 1996; Cheverud et al. 1999; Lopez-Fanjul et al. 2000, 2004; Barton and Turelli 2004). A second example is the continuing interest in understanding the evolution of recombination. The extent of epistatic interactions and their evolution are deeply intertwined with our understanding and theories of the evolution of sex and genetic recombination (Malmberg 1977; Barton 1995; Kondrashov and Kondrashov 2001; Otto and Lenormand 2002; Michalakis and Roze 2004).
In addition to estimating the total amount of epistasis, we need to understand the variation in epistatic interactions among loci within a genome (Phillips et al. 2000). If epistatic interactions are both synergistic and antagonistic (greater or less than that expected from consideration of the effects of the alleles considered independently), then an experimental measurement or theoretical treatment of the average level of epistasis underestimates the amount that is really present (Phillips et al. 2000). In recent studies with RNA viruses, Bonhoeffer et al. (2004) found positive (synergistic) epistasis, while Sanjuán et al. (2004) found both negative (antagonistic) and positive epistasis. Thus, we need experimental measurements of epistasis, and a mechanistic characterization of its nature, to address a variety of problems in population and evolutionary genetics.
There are several contemporary experimental approaches to measuring epistatic effects in an evolutionary genetics context. One is to use specific mutations as a starting point and then measure fitness effects with combinations of other mutations or genetic backgrounds. Elena and Lenski (1997) with Escherichia coli and deVisser et al. (1997) with Aspergillus niger have provided examples, obtaining evidence for both positive and negative epistatic interactions. Several groups have used mutations to study epistasis for viral fitness (Bonhoeffer et al. 2004; Froissart et al. 2004; Michalakis and Roze 2004; Sanjuán et al. 2004). Bonhoeffer et al. (2004) reported evidence for positive epistasis in human immunodeficiency virus I, while Sanjuán et al. (2004) found both positive and negative epistasis in vesicular stomatitis virus, especially noting the synthetic lethals and the significance of the antagonistic epistasis for which they provided evidence. In Arabidopsis thaliana, epistatic interactions for flowering time have been uncovered beginning with a single locus and examining the effects of different genetic backgrounds: the FRI locus upregulates FLC transcription (Koornneef et al. 1994; Michaels and Amasino 1999; Schlappi 2001; Caicedo et al. 2004).
A second approach, which we have used, is to follow a form of QTL mapping (Weller 1986; Paterson et al. 1988; Jansen and Stam 1994; Lander and Botstein 1994; Zeng 1994) to find epistatic interactions. In particular, one can identify two-way epistatic interactions by performing a complete pairwise analysis of all the molecular markers. Standard QTL software packages, such as QTL Cartographer (Basten et al. 2004), estimate epistatic interactions among already identified additive QTL, but will not currently perform a complete pairwise analysis of map segments without regard to already identified additive loci. Four computer programs that do facilitate all pairwise map segment scanning have been developed: Epistat (Chase et al. 1997), Epistacy (Holland 1998), Pseudomarker (Sen and Churchill 2001), and BQTL (Borevitz et al. 2002). There are several examples of this epistatic QTL approach. Shook and Johnson (1999) performed QTL analyses of fitness-related life-history traits in Caenorhabditis elegans recombinant inbred lines; they found seven significant epistatic effects. Similarly, Routman and Cheverud (1997) and Cheverud (2000) used an all pairwise comparison approach to identify >100 candidates for epistatic interactions in mouse body weight, and Peripato et al. (2004) studied the genetic basis for mouse litter size, finding two additive QTL and eight epistatic QTL. With A. thaliana, Juenger et al. (2005) found two epistatic QTL for flowering time in recombinant inbred lines generated from a cross of the Landsberg and Cape Verde accessions.
In this article, we report an epistatic QTL study of natural variation of A. thaliana, grown under field conditions, that measured the fitness-related traits of fruit number, seed size, and germination rate. Our study differs from other Arabidopsis QTL studies by our analysis of fitness under field conditions combined with using the all pairwise map segment comparison method to uncover epistasis. We find more epistatic interactions than additive QTL and also larger effects for the epistatic interactions than for the additive loci. Our analysis indicates that there is a network of additive and epistatic effects underlying these traits. We also compare the additive and epistatic genetic architecture underlying seed size and germination in field-grown and greenhouse-grown plants. We find the genetic architecture for greenhouse-grown and field-grown traits to be largely different. Our experimental approach of measuring natural variation for fitness as a QTL under field conditions should make the results directly applicable to understanding the role of epistasis in population and evolutionary genetics.
MATERIALS AND METHODS
Plant material and growth conditions:
All seeds were obtained from the Arabidopsis Biological Resource Center (ABRC; Columbus, OH). We used a mapping population of 100 RI lines (ABRC stock no. CS1899) that had been generated from a cross between the Columbia (ABRC stock no. CS-933) and the Landsberg erecta (ABRC stock no. CS-20) accessions of A. thaliana (L.) Heynh. Progeny from the initial cross were taken through eight generations of selfing via single-seed descent to produce nearly homozygous lines with an estimated heterozygosity of 0.42% (Lister and Dean 1993; Juenger et al. 2000). We constructed a linkage map using a total of 228 markers (chromosome 1, 54 markers; chromosome 2, 33 markers; chromosome 3, 37 markers; chromosome 4, 50 markers; and chromosome 5, 54 markers). The map position of each marker was estimated from the observed recombination frequencies using the Kosambi mapping function as implemented by the software MapMaker 3.0 (Lander et al. 1987). This analysis provided unique positions for each marker and a map spanning 592 cM of the A. thaliana genome (99% of the 597-cM estimated size of the A. thaliana genome based on both the Arabidopsis Genome Initiative sequence map and the Lister and Dean RI genetic map; http://www.Arabidopsis.org/servlets/mapper). The mean intermarker distance was 2.8 cM. Our map did not differ in marker order from the published linkage map of A. thaliana.
Plants used in the greenhouse experiment were grown from seed sowed singly in an ∼150-cm3 plastic pot filled with a soilless mix of peat moss, perlite, pine bark, and vermiculite (Fafard no. 3B, Agawam, MA). All replicates of each RI line were randomly assigned to an individual pot in a flat. The seeds were cold stratified at 4° for 3 days and then transferred to a single growth chamber with control for both day length (14 hr) and temperature (18°). Five replicate plants were grown for each of the RI lines and seeds were collected from each plant. For each line, we pooled seeds from all replicates and randomly selected 25 seeds from each line for analysis.
In October 2002, we planted seeds of each line into plastic trays filled with Fafard no. 3B soilless mix. The seeds were cold stratified at 4° for 3 days and then transferred to a single growth chamber with control for both day length (10 hr) and temperature (15°) until a week before transplanting when they were moved outdoors to harden. In November 2002, we transplanted 2448 young plants (at the four true-leaf stage) to a field at the University of Georgia's Plant Sciences Farm in Oconee County, Georgia, where natural populations of A. thaliana occur. Plants growing naturally in that field were at the same phenological stage as the transplants. The field was plowed just before planting, but natural vegetation was allowed to regrow during the experiment. Therefore, the experimental plants experienced levels of competition similar to those of naturally growing plants. We planted 24 replicates of each of the 100 RI lines and the two parental genotypes from which the lines were derived. The plants grew, flowered, and set fruit at a phenological schedule similar to that of the natural populations. After all plants had senesced, we collected and counted all the fruits from each replicate. Of the 2448 individuals planted in the field, 1942 survived through the entire season to produce fruit, representing 79% survival. Three lines failed to reproduce entirely (ABRC stock nos. CS1900, CS1982, and CS1999) and were included in the analysis as producing no fruits. The mean replicate number within each line was 20 (median value was 21 and mode was 22). The replicates ranged from 3 lines with only 1 replicate (CS1948, CS1949, and CS1978) to 4 lines in which all 24 replicates reproduced. We examined 25 seeds per replicate (a total of 48,550 seeds) for seed size measurements and 50 seeds per replicate (a total of 197,100 seeds) for estimates of germination rate.
Seeds were placed under a dissecting scope and seed length and width were measured with a video imaging system (Optimas Image Analysis Software for Windows, version 6.51, Media Cybernetics, San Diego). Mean seed length and width were calculated for each line. Seeds used for the germination assay were sterilized by exposing dry seeds to ultraviolet light (254 nm) for 2 hr. Seeds from each line were divided randomly into 10 sets of five seeds and each set was randomly placed in an individual plate (10 replicate plates) containing an agar medium (0.8% agar with 1% sucrose, B5 vitamins, and Murashige and Skoog salts). This design confounds plate with replicate (the set of five seeds in each plate represents a true replicate but the five seeds within each plate are pseudoreplicates), but we felt that the number of replicate plates provided a sufficiently large set of independent data. Seed sets from multiple lines were placed in the same plate to reduce the number of plates used. Plates were positioned horizontally at 15° for 12-hr days. For each seed, we observed how many hours elapsed before a radicle emerged. Plates were checked every 6 hr until 100% of seeds had germinated. We report the least squares mean number of hours for each line (after removing the effect of plate in an analysis of variance).
Additive QTL analysis:
Composite interval mapping was performed using QTL Cartographer (version 1.17, released January 28, 2005, and WinQTLCart version 2.5, released February 15, 2005) (Basten et al. 1994, 2004; Wang et al. 2004). The settings used were a walk speed of 1 cM, model 6 standard, regression method 3 forward and backward, and probabilities of 0.05. Significance levels were set via the program's permutations function using 2000 permutation times (Churchill and Doerge 1994; Doerge and Churchill 1996). Joint-trait mapping with QTL Cartographer's JZmapqtl program was performed to test for genotype × environment interactions for the traits that were grown in both the field and the greenhouse. Multiple interval mapping with QTL Cartographer's MImapqtl program was performed to test for epistatic interactions among the identified additive QTL using the five-phase analyses described in the QTL Cartographer manual.
Epistatic QTL analysis:
We used the programs Epistat (Chase et al. 1997) (http://64.226.94.9/epistat.htm) and Epistacy (Holland 1998) (http://www4.ncsu.edu/∼jholland/Epistacy/Epistacy.htm) to analyze the quantitative trait data. For Epistat, we used an automated search for all-pairwise interactions, with an initial likelihood-ratio cutoff of 4, a value less stringent than the cutoff of 6 suggested by the authors. Subsequently we used the Montecarlo simulation program associated with Epistat to analyze 1,000,000 resampled subgroups, as a means of estimating P-values. We ran Epistasy in the SAS environment (SAS Institute 2001) with a P-value filter of 0.01, a value higher than is statistically significant. We removed all interactions in the Epistat and Epistacy outputs where the two interacting markers were within 50 cM of each other to avoid linkage effects. The output of both the Epistat and the Epistacy program was sorted by P-values to find the values that were significant; these values, and also P-values in the genetic map neighborhood of the significant values, are plotted in Figures 2 and 4. Both Epistat and Epistacy provide estimates of the genotypic values. Epistacy reports this directly in the output. Epistat reports the values as normalized values (i.e., mean of 0 and standard deviations of 1; K. Chase, personal communication); we transformed back to the original values by multiplying by the standard deviation and adding the mean. The estimated genotypic values provided by both programs were similar.
We modified the Epistacy SAS script to test for epistasis × environment effects comparing quantitative traits from plants grown in the field and in the greenhouse. The quantitative trait was input as values for a single variable, with an associated variable to indicate the growth environment. The environment was then specified as a class and added to the “Proc GLM” routine at the core of Epistacy (class &&gnmk&i &&gnmk&j envirn; model &trait = &&gnmk&i|&&gnmk&j|envirn; lsmeans &&gnmk&i*&&gnmk&j&&gnmk&i*&&gnmk&j*envirn;).
RESULTS
Our goal was to determine the genetic basis for quantitative traits related to fitness, focusing on epistatic interactions, in addition to individual locus additive effects, in plants grown under natural field conditions. We compared fruit number, germination rate, and seed size differences in a standard set of Landsberg × Columbia recombinant inbred lines of A. thaliana (Lister and Dean 1993) grown over winter and early spring in a field in Georgia. The use of these well-characterized lines allowed us to map simple quantitative trait loci and epistatic interactions between pairs of loci for these traits. The genetic variation reflects the differences between these two accessions seen under field conditions. At the same time we were able to compare the genetic variation for germination and seed size in the same set of recombinant inbred lines grown in the greenhouse as well as in the field, thus testing for correlations in the genetic basis of the same traits under these two different growth conditions.
Additive QTL analysis:
We used QTL Cartographer (Basten et al. 1994, 2004; Wang et al. 2004) to perform composite interval mapping to identify additive QTL. Loci that were significant by permutation analysis are reported in Table 1.We also list additive loci that were nearly significant and that mapped close to a locus involved in a significant epistatic interaction, as reported below. In field-grown plants, there are two additive loci identified for fruit number, two for germination, four for seed length, and two for seed width. In greenhouse-grown plants there is one additive locus for germination, two for seed length, and one for seed width. One QTL for seed length in field-grown plants corresponds to a QTL for seed length in greenhouse-grown plants, as judged by map position; all the other loci vary between field- and greenhouse-grown plants; these results are graphed in Figure 1. The absolute values of the additive effects for the fruit number QTL are in the range of 11–13% and are smaller for the other traits, in the range 0.8–3.2%. We indicate correspondences that exist between these additive QTL and the epistatic interactions, discussed below, in the last column of Table 1.
Additive QTL
Trait | Growth site | QTL no. | Chromosome no. | Position (cM) | LOD score | Significant? | % additive effect | Partial R2 | Maps close to epistatic QTL? |
|---|---|---|---|---|---|---|---|---|---|
| Fruit number | Field | 1 | 1 | 91.6 | 2.60 | No | −11.1 | 0.09 | Table 2, group 1 |
| Fruit number | Field | 2 | 2 | 70.4 | 3.69 | Yes | 13.0 | 0.14 | |
| Fruit number | Field | 3 | 5 | 85.0 | 2.99 | Yes | −11.5 | 0.10 | Table 2, group 6 |
| Germination | Field | 1 | 3 | 72.6 | 2.25 | No | 1.0 | 0.05 | Table 2, group 2 |
| Germination | Field | 2 | 4 | 61.4 | 11.79 | Yes | 2.6 | 0.34 | Table 2, group 5 |
| Germination | Field | 3 | 4 | 96.4 | 4.74 | Yes | −1.6 | 0.14 | Table 2, group 4 |
| Seed length | Field | 1 | 1 | 40.1 | 5.33 | Yes | 1.4 | 0.14 | |
| Seed length | Field | 2 | 1 | 91.6 | 6.68 | Yes | −1.7 | 0.18 | Table 2, group 5 |
| Seed length | Field | 3 | 2 | 43.3 | 3.12 | Yes | −1.1 | 0.08 | Table 2, group 1 |
| Seed length | Field | 4 | 3 | 19.2 | 2.31 | No | 0.9 | 0.06 | Table 2, group 3 |
| Seed length | Field | 5 | 3 | 39.5 | 3.72 | Yes | −1.2 | 0.08 | Table 2, group 4 |
| Seed length | Field | 6 | 5 | 104.3 | 2.44 | No | 0.9 | 0.06 | Table 2, group 5 |
| Seed width | Field | 1 | 3 | 11.4 | 6.83 | Yes | −1.3 | 0.16 | Table 2, group 3 |
| Seed width | Field | 2 | 3 | 41.5 | 2.72 | No | −0.8 | 0.06 | Table 2, group 4 |
| Seed width | Field | 3 | 5 | 119.3 | 5.64 | Yes | 1.1 | 0.15 | Table 2, group 5 |
| Germination | Greenhouse | 1 | 1 | 132.5 | 2.37 | No | −2.8 | 0.09 | Table 3, group 1 |
| Germination | Greenhouse | 2 | 2 | 25.8 | 2.49 | No | −3.0 | 0.09 | Table 3, group 2 |
| Germination | Greenhouse | 3 | 5 | 109.2 | 3.10 | Yes | 3.2 | 0.10 | |
| Seed length | Greenhouse | 1 | 1 | 3.8 | 3.64 | Yes | −2.0 | 0.12 | Table 3, group 2 |
| Seed length | Greenhouse | 2 | 1 | 99.8 | 2.95 | Yes | −2.2 | 0.12 | |
| Seed width | Greenhouse | 2 | 2 | 64.4 | 4.1 | Yes | 1.5 | 0.16 |
These data were generated by composite interval mapping by QTL Cartographer with 2000 permutations. Additive QTL are listed that either were statistically significant on their own or were near-significant and additionally mapped close to a locus that participates in an epistatic interaction. Significance levels were determined by the 2000 permutations. The additive effect is expressed as a percentage of the overall average for this trait. The last column indicates a possible relationship between an additive QTL and one member of an epistatic QTL pair (Table 2, column 2) as deduced by similarity in map position.
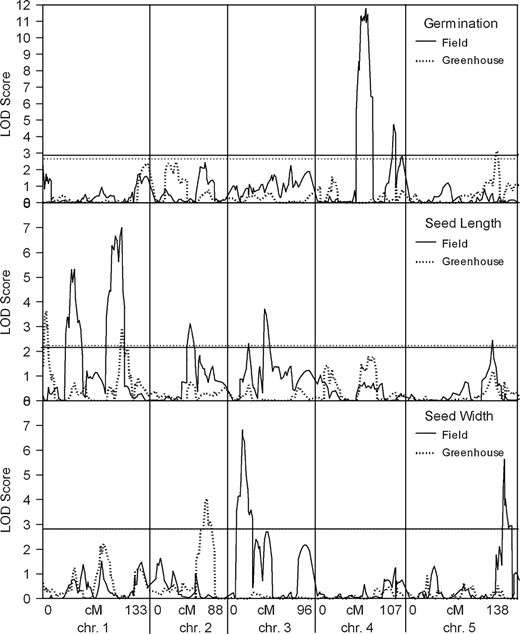
Comparison of field and greenhouse QTL LOD scores. This displays the output of WinQTLCartographer (Wang et al. 2004) composite interval mapping as QTL LOD score vs. genetic map position for the traits that were measured from lines grown in both field and greenhouse environments. (Top) Seed germination; (middle) seed length; (bottom) seed width. Field growth is a solid line, while greenhouse growth is a dashed line. Horizontal lines represent the significance levels established by permutations.
Epistatic QTL analysis:
We used the programs Epistat (Chase et al. 1997) and Epistacy (Holland 1998) to analyze the quantitative trait data. Both programs can perform a complete comparison of all-pairwise markers to test for additive × additive epistatic interactions from recombinant inbred line data, although they do so in different ways. Epistat uses likelihood ratios to compare epistatic and additive models. From the Epistat output, we eliminated all interactions that the program identified as possibly due to linkage, since the lines cannot be considered to be at linkage equilibrium. We then used the associated Montecarlo simulation program to resample subgroups as a means of estimating P-values. Epistacy is a SAS script built around a general linear model analysis. We removed all interactions in the Epistacy output in which the two markers were within 50 cM of each other to avoid linkage effects. The final results of the two programs were nearly identical. The total number of pairwise interaction tests that we ran was large; however, the markers are not fully independent since they are linked. We used the correction suggested by Holland (1998) of dividing the desired P-value (0.01) by N(N − 1)/2, where N is the number of chromosomes. Hence our criterion for statistical significance was P = 0.001.
Figure 2 shows the epistatic interactions mapped for fruit number and germination rate in the field-grown RI lines. To prepare Figure 2, we converted the A. thaliana genetic map into a single pseudomap by appending each chromosome map, one after another, with a 10-cM spacer between the end of one chromosome and the beginning of the next. We then placed this lumped linear genetic map on both x- and y-axes and plotted the positions of the epistatic interactions detected. The significance level of an interaction is indicated by the darkness of the point plotted (we refer to this type of graph as an M&M plot).
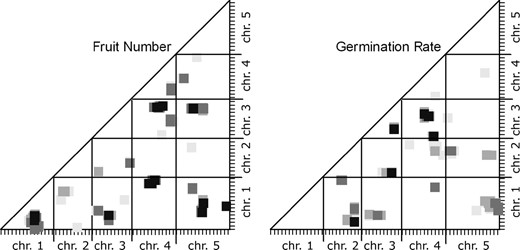
Epistatic QTL for fitness traits in field-grown Arabidopsis. The programs Epistat and Epistacy were used to estimate the probabilities of interactions between map segments for these quantitative traits; the results from the two programs were combined in each scatter plot. The axes indicate the genetic map of A. thaliana with one chromosome following another so that the total is displayed linearly. The x- and y-axes correspond to marker X and marker Y in Table 2. The plotted squares indicate the P-value for an interaction between the map segments:  = 0.001,
  = 0.003,
  = 0.005,
  = 0.007. Note that because of the correction for multiple comparisons, these values correspond to a 10-fold-higher statistical significance probability. The data in Table 2 contain the P = 0.001 subset of this graph.
Although only the P = 0.001 value is significant, plotting slightly higher P-values allowed us to visualize the neighborhood of a given interaction. The epistatic interactions detected generally occur in clusters of points with more than one point representing a significant interaction and numerous points representing interactions individually slightly less than significant. These clusters seem likely to be the result of a single underlying epistatic interaction between two loci. The diameter of these clouds of points is 10–20 cM, similar to the width of an additive QTL peak near its base.
We used QTL Cartographer's multiple interval mapping program, MImapqtl, to test for interactions among the additive QTL that it detects. No significant interactions were detected. This is consistent with the results from Epistat and Epistacy, which similarly did not detect interactions among the markers associated with pairs of additive QTL.
In Table 2 we summarize the epistatic interactions detected at the P = 0.001 level for fruit number and seed germination, length, and width in field-grown plants. Each cluster of interacting marker pairs is indicated by a single representative, the individual interaction that had the lowest P-value; this is analogous to referring to an additive QTL by the marker and map position at the LOD score peak. Other marker pairs contributing to the group at the P = 0.001 level are also indicated, but without listing each of the many pairwise interactions involved. We detected seven epistatic interactions for fruit number and five for germination percentage. Each of these is larger than the number of additive QTL for the same trait.
Epistatic QTL for traits in field-grown A. thaliana
Interaction group | Chromosome no. | Position (cM) | Chromosome no. | Position (cM) | Genotypic values | % largest effect | Partial R2 | |||||||
|---|---|---|---|---|---|---|---|---|---|---|---|---|---|---|
| Trait | Marker X | Marker Y | XlXl YlYl | XlXl YcYc | XcXc YlYl | XcXc YcYc | Significance | |||||||
| Fruit no. | 1 | mi353 (mi353, mi424) | 1 | 90.8 | mi265 (f19g10A, m235, mi113, mi163, mi265) | 1 | 36.8 | 99.2 | 94.4 | 66.6 | 119.7 | −41 | 0.15 | *** |
| Fruit no. | 2 | mi178 | 3 | 43.7 | g17286 | 1 | 38.6 | 103.0 | 94.9 | 86.6 | 135.3 | −31 | 0.13 | ** |
| Fruit no. | 3 | mi465 (g18491, mi465, mi128, m226) | 4 | 45.9 | g17311 (g17311, pT32CX) | 1 | 125.4 | 119.6 | 82.3 | 94.6 | 113.7 | −33 | 0.16 | *** |
| Fruit no. | 4 | agp21e (ag, agp21e, cds11) | 4 | 67.4 | m424 (m424, nga6) | 3 | 82.9 | 96.3 | 112.6 | 113.4 | 90.8 | 19 | 0.10 | *** |
| Fruit no. | 5 | cdpk9 | 5 | 44.5 | m339 | 3 | 79.4 | 92.5 | 123.7 | 109.2 | 95.4 | 29 | 0.12 | ** |
| Fruit no. | 6 | mi137 (mi291b, mi137) | 5 | 72.3 | mi291a (CTS039, mi291a) | 1 | 71.9 | 86.7 | 111.2 | 117.4 | 94.7 | 26 | 0.13 | ** |
| Fruit no. | 7 | bio205 | 5 | 134.4 | mi72 | 1 | 63.6 | 76.5 | 114.1 | 106.8 | 110.6 | 20 | 0.06 | * |
| Germination | 1 | mi473 | 2 | 83.3 | ve007 | 1 | 20.9 | 91.1 | 92.0 | 94.5 | 89.9 | 4 | 0.07 | * |
| Germination | 2 | m339 | 3 | 79.4 | mi320 | 2 | 9.6 | 94.3 | 90.5 | 91.1 | 93.1 | −3 | 0.13 | ** |
| Germination | 3 | nga6 | 3 | 86.4 | g4708 (g4708, m228) | 3 | 23.5 | 94.2 | 92.2 | 89.2 | 92.5 | −5 | 0.12 | *** |
| Germination | 4 | o6455 | 4 | 83.3 | ca1 | 3 | 4.2 | 92.5 | 89.6 | 92.0 | 94.1 | −4 | 0.11 | * |
| Germination | 5 | mi422 (mi422, m226) | 4 | 69.4 | ve021 (ve021, g4564b) | 3 | 58.6 | 92.3 | 92.3 | 94.3 | 89.1 | 4 | 0.11 | ** |
| Seed length | 1 | mi238 (m216, mi148, mi238) | 2 | 39.92 | snp308 | 1 | 0.89 | 0.30 | 0.507 | 0.490 | 0.493 | −4 | 0.511 | *** |
| Seed length | 2 | mi74B (mi74B, mi199, mi172, mi467, mi289, m228, mi339) | 3 | 5.83 | mi425 (m532, mi425, g17311) | 1 | 117.19 | 0.14 | 0.509 | 0.486 | 0.500 | −4 | 0.506 | ** |
| Seed length | 3 | mi207 | 3 | 18.60 | mi421(mi310, mi421) | 2 | 19.14 | 0.10 | 0.506 | 0.494 | 0.496 | −3 | 0.508 | * |
| Seed length | 4 | ve027 | 4 | 100.64 | mi413 (mi413, m457) | 3 | 50.63 | 0.10 | 0.496 | 0.501 | 0.512 | 3 | 0.494 | * |
| Seed length | 5 | m435 (mi271, m435) | 5 | 108.70 | m213 (pap240, m213) | 1 | 77.73 | 0.09 | 0.493 | 0.497 | 0.514 | 4 | 0.495 | ** |
| Seed length | 6 | chhank (agp11e, chhank) | 5 | 132.33 | ve001 (ve001, agp16, o846a) | 1 | 2.99 | 0.14 | 0.510 | 0.496 | 0.495 | −3 | 0.508 | *** |
| Seed length | 7 | mi194 (mi194, mi83, m435) | 5 | 90.58 | ve021 (ve021, g4117) | 3 | 58.58 | 0.12 | 0.493 | 0.511 | 0.503 | 3 | 0.495 | ** |
| Seed length | 8 | nga139 | 5 | 50.48 | g4564a | 4 | 50.92 | 0.12 | 0.493 | 0.509 | 0.503 | 3 | 0.497 | * |
| Seed width | 1 | mi268 (mi289, mi339, mi142, mi268) | 3 | 30.86 | m532 (mi425, m532, ve011, agp64) | 1 | 117.82 | 0.17 | 0.333 | 0.329 | 0.321 | −4 | 0.333 | *** |
| Seed width | 2 | nga162 | 3 | 20.56 | ubique | 2 | 82.20 | 0.08 | 0.325 | 0.330 | 0.320 | −3 | 0.335 | * |
| Seed width | 3 | pCITd23 | 4 | 40.32 | pap86 | 3 | 41.15 | 0.11 | 0.327 | 0.321 | 0.329 | −3 | 0.336 | * |
| Seed width | 4 | g4560 (mi138, g4560) | 5 | 36.85 | g3829 | 1 | 29.84 | 0.16 | 0.328 | 0.335 | 0.329 | 3 | 0.321 | ** |
| Seed width | 5 | atr3 | 5 | 118.44 | nga111 | 1 | 115.55 | 0.15 | 0.325 | 0.334 | 0.329 | 3 | 0.322 | *** |
| Seed width | 6 | atr3 | 5 | 118.44 | pCITf3 (mi87, nga8, hy4, pCIT3) | 4 | 30.80 | 0.18 | 0.325 | 0.334 | 0.329 | 3 | 0.322 | *** |
The epistatic interactions that scored P = 0.001 or below are listed here. Marker X and marker Y and the map position correspond with the darkest squares shown in Figure 1 and hence are a subset of the total in that figure. The interaction groups are frequently composed of multiple interacting segments that mapped near each other on both the x- and y-axes. Each interaction group is represented by the specific interaction that had the lowest probability, with the other contributing markers indicated in parentheses. Thus, fruit number interaction group 1 is composed of most of the possible pairwise interactions among [mi353, mi424] and [f19g10A, m235, mi113, mi163, mi265], each of which had P = 0.001 or less, and within each set the markers map near each other. We did not include interactions that mapped in the same region but had P-values >0.001 within an interaction group. The genotypic values are the averages over those estimated for all the pairwise interactions within the group; we indicate the percentage deviation from the average of the parental genotypes of the recombinant genotype (averaged over all significant interactions in its group) that is most different from the midparent. The partial R2 values are those calculated by the Epistacy SAS program. *P = 0.001; **P = 0.0005; ***P = 0.0001.
If we increase the significance stringency to P = 0.0005, the fruit number epistatic interaction 7 is not significant, and the germination epistatic interactions 1 and 4 are not significant. If we increase the significance stringency further to P = 0.0001, the fruit number epistatic interactions 6, 5, and 2 are not significant, and germination epistatic interactions 2 and 5 are not significant. Thus at the P = 0.0005 level, there are six significant interactions for fruit number and three for germination, while at the P = 0.0001 level there are three significant interactions for fruit number and one for germination (Table 2, final column). Seed length and width have a similar pattern with each having some epistatic interactions significant at P = 0.001, some at P = 0.0005, and some at P = 0.0001.
We have summarized the QTL and epistatic interactions for traits measured from the field-grown plants in Figure 3, a genetic architecture diagram. Several apparently neighboring loci may actually represent a single locus involved in multiple ways in the genetic basis of the traits. For example, the QTL for fruit number on chromosome 1 at 91 cM may also be the locus that interacts with another locus on chromosome 1 at 36 cM (Table 2, fruit no. 1). Similarly, the locus at 36 cM may be the same one that is interacting with the locus on chromosome 3 at 43 cM (Table 2, fruit no. 2). Two of the three simple QTL for fruit number, and two of the two simple QTL for germination percentage, are potentially involved in epistatic interactions with other loci; these map correspondences are indicated in the final column of Table 1. For seed width, the region on chromosome 5 at 118–120 cM may have three roles, participating in two epistatic interactions as well as an additive QTL. For each trait, about half of the loci involved in epistatic interactions are potentially participating in more than one such interaction.
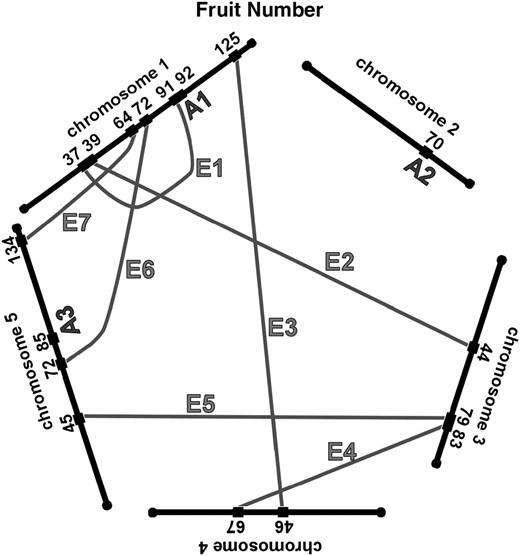
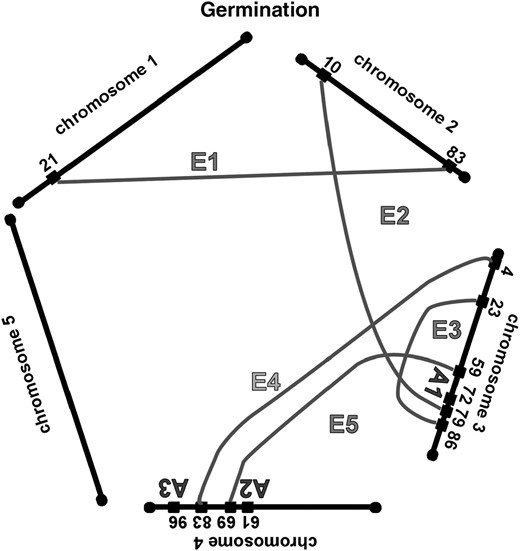
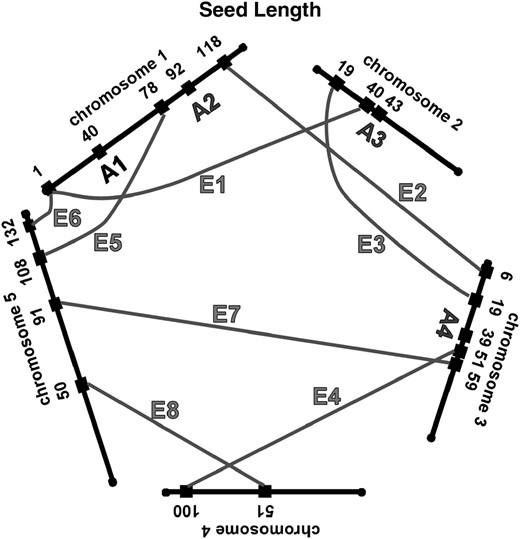
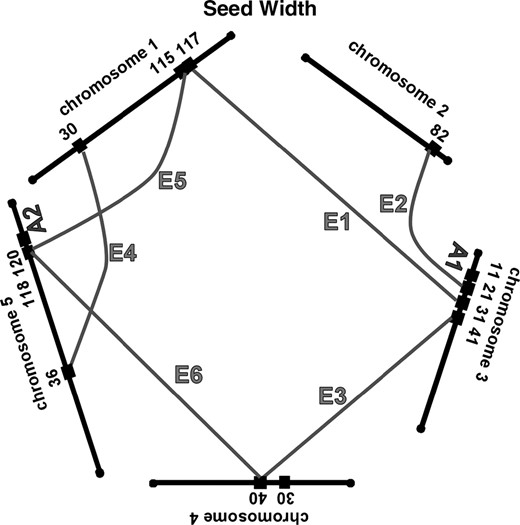
Network of additive and epistatic QTL for fruit number, germination, seed length, and width in field-grown A. thaliana. “A” indicates additive QTL from Table 1. Shaded lines labeled with “E” connect the epistatic interactions. For the epistatic interactions, the locations and cluster number shown are those from Tables 2 and 3.
Both Epistat and Epistacy provide estimates of the genotypic values of the genotypes involved; the genotypic values provided by both programs were similar. For each epistatic interaction cluster, we calculated the genotypic values by averaging the individual estimates from all of the interactions within the cluster that had a P-value of 0.001 or less. This is shown in Table 2 for all four genotypes, along with the largest epistatic effect given as a percentage change from the average of the parental (Landsberg and Columbia) average. The epistatic effects on fruit number were large, ranging from −41% to +29%. The epistatic effects on germination and seed size were smaller, ranging from −5% to +4%. In each case, the effects of the epistatic interactions on the traits are larger in magnitude than the effects of the additive QTL.
Comparison of field-grown and greenhouse-grown plants:
We had the opportunity to compare the genetic basis of several quantitative seed traits in the Landsberg × Columbia RI lines in field- and greenhouse-grown plants, including germination percentage, seed length, and seed width. Our analysis was similar to that just described, with a search for simple QTL and for epistatic interactions by comparison of all-pairwise marker interactions.
We found similar numbers of additive QTL for these traits under both growth conditions (Table 1); however, there was little correspondence among them in genetic map position. Seed length from field-grown plants had a QTL that mapped to 1-91.6, while seed length from the greenhouse-grown plants had a QTL that mapped to 1-99.8. These were the only QTL that had any overlap in map position among these three traits grown in two environments.
We used QTL Cartographer's JZmapqtl program to specifically test for G × E interactions for the three traits that were examined from both greenhouse- and field-grown plants. For germination and seed width, no significant G × E effects were found. For seed length, one significant G × E effect was found that mapped to chromosome 1 at 115 cM. The additive QTL closest to this G × E effect for seed length were at 1-91.6 (field) and 1-99.9 (greenhouse). The seed length G × E effect maps close to a locus involved in an epistatic interaction for seed length under both growth conditions. In Table 3, greenhouse seed-length interaction 1 involves one locus that maps to 1-117.8 while field seed-length interaction 2 involves one locus that maps to 1-117.2.
Comparison of epistatic QTL from greenhouse- and field-grown A. thaliana
Trait | Growth site | Interaction group | Marker X | Chomosome no. | Position | Marker Y | Chromosome no. | Position (cM) | Field and Greenhouse |
|---|---|---|---|---|---|---|---|---|---|
| Germination | Greenhouse | 1 | agp64 | 1 | 121.00 | ve009 | 1 | 50.79 | |
| Germination | Greenhouse | 2 | mi421 | 2 | 19.14 | mi208 | 1 | 73.50 | |
| Germination | Greenhouse | 3 | ve021 | 3 | 58.58 | er (er, mi54, m220) | 2 | 50.64 | xEnv |
| Germination | Greenhouse | 4 | mi51 (mi51, mi204) | 4 | 1.53 | g4514 (ltp, g4514) | 2 | 73.77 | |
| Germination | Greenhouse | 5 | mi433 (mi433, nga139, g4715b, mi138, mi433, g4715b) | 5 | 42.22 | g6842 (gpa1, g6842, thy1, m246, g4553, mi398) | 2 | 46.77 | xEnv |
| Germination | Field | 1 | mi473 | 2 | 83.33 | ve007 | 1 | 20.91 | |
| Germination | Field | 2 | m339 | 3 | 79.41 | mi320 | 2 | 9.56 | |
| Germination | Field | 3 | nga6 | 3 | 86.41 | g4708 (g4708, m228) | 3 | 23.48 | |
| Germination | Field | 4 | o6455 | 4 | 83.35 | ca1 | 3 | 4.24 | |
| Germination | Field | 5 | mi422 (mi422, m226) | 4 | 69.37 | ve021 (ve021, g4564b) | 3 | 58.58 | |
| Seed length | Greenhouse | 1 | mi289 (mi289, mi339) | 3 | 22.97 | m532 | 1 | 117.82 | L |
| Seed length | Greenhouse | 2 | m518a (hy4, m518a, m518, pCITd23, g6837, mi30, g4564a) | 4 | 31.73 | agp16 (ve001, t1g11a, agp16, o846a, apx1a) | 1 | 5.52 | |
| Seed length | Greenhouse | 3 | g4564a (mi465, mi128, g6837, mi30, g4564a, mi260, mi112, jgb9, agp21e) | 4 | 50.92 | f19g10a (g3829, m253, f19g10a, g17286, cds12, cts039, m235) | 1 | 32.71 | xEnv |
| Seed length | Greenhouse | 4 | ve027 | 4 | 100.64 | mi425 (mi425, m532, ve011, agp64, g17311) | 1 | 117.19 | |
| Seed length | Greenhouse | 5 | mi125 | 5 | 65.16 | mi63 (mi63, mi19, mi72) | 1 | 56.69 | |
| Seed length | Greenhouse | 6 | mi83 (g4028, mch1, mi194, mi83, mi423b, mi61, m331, mi271, pap3, m435, h2a1, mi70, agp27e) | 5 | 93.68 | mi425 (agp64, g17311, mi425, m532, ve011) | 1 | 117.19 | |
| Seed length | Greenhouse | 7 | agp11e | 5 | 122.69 | g17286 | 1 | 38.61 | |
| Seed length | Greenhouse | 8 | mi125 (mi125, m291b) | 5 | 65.16 | thy1 | 2 | 57.74 | |
| Seed length | Field | 1 | mi238 (m216, mi148, mi238) | 2 | 39.92 | snp308 | 1 | 0.89 | |
| Seed length | Field | 2 | mi74B (mi74B, mi199, mi172, mi467, mi289, m228, mi339) | 3 | 5.83 | mi425 (m532, mi425, g17311) | 1 | 117.19 | L |
| Seed length | Field | 3 | mi207 | 3 | 18.60 | mi421 (mi310, mi421) | 2 | 19.14 | |
| Seed length | Field | 4 | ve027 | 4 | 100.64 | mi413 (mi413, m457) | 3 | 50.63 | |
| Seed length | Field | 5 | m435 (mi271, m435) | 5 | 108.70 | m213 (pap240, m213) | 1 | 77.73 | |
| Seed length | Field | 6 | chhank (agp11e, chhank) | 5 | 132.33 | ve001 (ve001, agp16, o846a) | 1 | 2.99 | |
| Seed length | Field | 7 | mi194 (mi194, mi83, m435) | 5 | 90.58 | ve021 (ve021, g4117) | 3 | 58.58 | |
| Seed length | Field | 8 | nga139 | 5 | 50.48 | g4564a | 4 | 50.92 | |
| Seed width | Greenhouse | 1 | g6837 (mi128, g6837, g4564a) | 4 | 49.80 | f19g10a | 1 | 32.71 | xEnv |
| Seed width | Greenhouse | 2 | pCITd23 (m518a, pCITd23) | 4 | 40.32 | pap86 | 3 | 41.15 | W |
| Seed width | Greenhouse | 3 | mi219 | 5 | 57.06 | g3843 | 4 | 7.75 | |
| Seed width | Field | 1 | mi268 (mi289, mi339, mi142, mi268) | 3 | 30.86 | m532 (mi425, m532, ve011, agp64) | 1 | 117.82 | |
| Seed width | Field | 2 | nga162 | 3 | 20.56 | ubique | 2 | 82.20 | |
| Seed width | Field | 3 | pCITd23 | 4 | 40.32 | pap86 | 3 | 41.15 | W |
| Seed width | Field | 4 | g4560 (mi138, g4560) | 5 | 36.85 | g3829 | 1 | 29.84 | |
| Seed width | Field | 5 | atr3 | 5 | 118.44 | nga111 | 1 | 115.55 | |
| Seed width | Field | 6 | atr3 | 5 | 118.44 | pCITf3 (mi87, nga8, hy4, pCIT3) | 4 | 30.80 |
The epistatic interactions that scored P = 0.001 or below are listed here. Marker X and marker Y and the map position correspond with the darkest squares shown in figure 3 and hence are a subset of the total in that figure. The interaction groups are frequently composed of multiple interacting segments that mapped near each other on both the x- and y- axes. Each interaction group is represented by the specific interaction that had the lowest probability, with the other contributing markers indicated in parentheses. Thus the field-grown seed-width group 1 is composed of most of the possible pairwise interactions among [mi289, mi339, mi142, mi268] and [mi425, m532, ve011, agp64], each of which had P = 0.001 or less, and within each set the markers map near each other. We did not include interactions that mapped in the same region but had P-values above >0.001 within an interaction group. The epistatic interactions in which a significant environment interaction effect, P = 0.001 or less, was detected by the modified Epistacy SAS script are indicated by xEnv. There was correspondence for one epistatic interaction for seed length and one for seed width between greenhouse-grown and field-grown plants, which are indicated by an L and a W, respectively.
Most of the significant epistatic interactions differ for the same trait in greenhouse-grown and in field-grown A. thaliana, just as there is little correspondence among the locations of the additive QTL. The epistatic interactions for these seed traits grown in two environments are graphed in Figure 4; the clusters of epistatic interactions at the P = 0.001 level are reported in Table 3. For germination, there were five epistatic interactions in greenhouse-grown plants, but none of these corresponded with the five epistatic interactions found in field-grown plants. For seed length we found eight epistatic interactions under both growth conditions; one of these appeared, on the basis of map locations, to be the same interaction in both and is indicated by an L in the final column of Table 3. For seed width there were three significant interactions in greenhouse-grown plants and six in field-grown plants; one of these interactions was found in common, as indicated by a W in the final column of Table 3. For greenhouse-grown plants as well as for field-grown plants, there are more significant epistatic interactions than additive QTL.
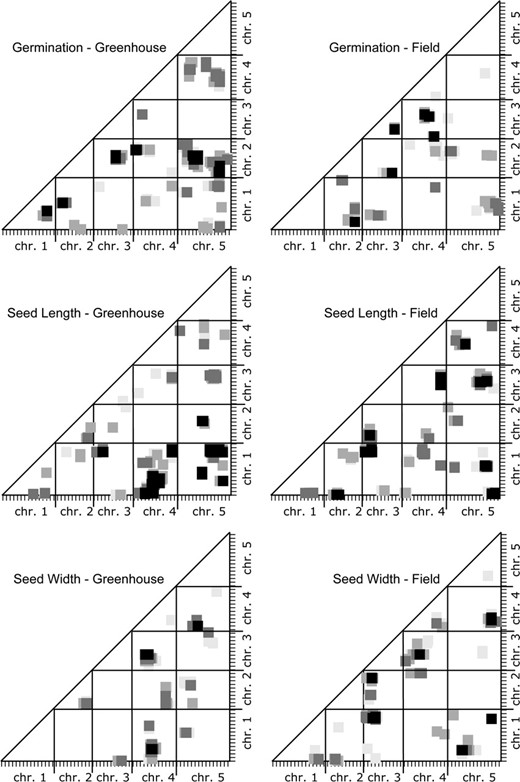
Epistatic QTL compared from greenhouse- and field-grown A. thaliana. The programs Epistat and Epistacy were used to estimate the probabilities of interactions between map segments for these quantitative traits; the results from the two programs were combined in each scatter plot. The axes indicate the genetic map of A. thaliana with one chromosome following another so that the total is displayed linearly. The x- and y-axes correspond to marker X and marker Y in Table 3. The plotted squares indicate the P-value for an interaction between the map segments: = 0.001, = 0.003, = 0.005, = 0.007. Note that because of the correction for multiple comparisons these values correspond to a 10-fold-higher statistical significance probability.
To examine further the growth condition effect on epistasis, we modified the Epistacy SAS script to test for significant epistasis × environment interactions. Several, but not all, of the epistatic interactions in field- and greenhouse-grown plants were found to have significant growth-environment interactions. These are indicated in Table 3 by xEnv in the final column.
For both the additive QTL G × E effect and the epistatic QTL G × G × E effects, the number of significant environment interactions was less than the total number of loci that appear to be different by simple comparison of the initial results. This is to be expected. The initial detection of additive QTL or epistatic QTL interactions was based upon a comparison of a data set with noise to a null hypothesis of no locus or no interaction. The G × E or G × G × E tests are a more rigorous test, comparing two data sets both with noise directly against each other. Thus, we identified additive and epistatic QTL in field-grown and greenhouse-grown plants in individual screens that map to different chromosomal regions, but only a subset of these shows a significant environment interaction effect when the data sets are compared to each other.
DISCUSSION
Epistasis plays a role in the natural variation between Landsberg and Columbia accessions for fitness:
We searched for additive and epistatic QTL in the fitness-related traits of fruit number, germination percentage, and seed size in field-grown A. thaliana by examining the standard set of Landsberg × Columbia recombinant inbred lines. Total fruit number is an excellent measure of reproductive performance because there is a very significant linear relationship between fruit number and seed number (Mauricio and Rausher 1997; Mauricio 1998). Although A. thaliana fruits dehisce, the septum is durably persistent and fruit number is readily quantifiable.
Some QTL programs, such as QTL Cartographer, will facilitate searches for epistatic interactions among additive QTL loci that are already defined as part of multiple interval mapping. The programs that we used, Epistat and Epistacy, perform all pairwise marker × marker comparisons to look for epistatic interactions. This permits the user to look for epistatic QTL between markers/map segments where there is no a priori evidence for an additive QTL. The M&M epistasis probability plots of Figure 2 are a two-dimensional analog of the familiar LOD plots vs. chromosome map position used in QTL analysis. They helped us to identify clusters of significant interactions that most likely identify a single pair of interacting loci, thus permitting us to generate the network graphs of Figure 3. They also give some sense of the resolution of the genetic mapping as 10–20 cM in both dimensions.
Our data are based on recombinant inbred lines from which we can measure only additive × additive epistatic interactions. We may be underestimating the total amount of epistasis if additive × dominant or dominant × dominant interactions exist (Kearsey et al. 2003); similarly, we have not searched for higher-order epistatic interactions, examples of which are also known to exist (Templeton 2000).
For fruit number, we identified and mapped the loci involved in seven epistatic interactions and two additive effects. For seed germination, we identified and mapped loci involved in five epistatic interactions and two additive effects. For seed-size traits, we similarly found approximately twice as many epistatic interactions as additive QTL, with four additive loci and eight interactions for seed length and two additive loci and six interactions for seed width. These epistatic interactions were those chosen at a P = 0.001 significance level, equivalent to P = 0.01 before the correction for multiple comparisons (Holland 1998). The differences between the Landsberg and Columbia accessions thus include more loci involved in epistatic contributions than in single additive QTL. For fruit number, the effect of the epistasis on the genotypes was large, ranging from −41% to +29%; for germination percentage, the effects were smaller, ranging from −5% to +4%. The epistatic effects are roughly double the effects of the additive QTL. These results indicate that epistasis plays a large role in the natural variation for fitness differences between these two accessions in our fields, both in numbers of interactions and in genotypic effects. We found both positive and negative epistatic interactions.
The map locations of the additive and epistatic QTL, as summarized in Figure 3, suggest that some of the loci identified participate in more than one fashion. For example on chromosome 1, both an additive QTL and an epistatic interaction are indicated for the 91- to 92-cM region. This could indicate a single locus that is both providing an additive effect and also interacting with a second locus at position 37 cM. Similarly, this second locus could be the same one that is interacting with map position 44 cM on chromosome 3. The 17 loci for fruit number defined by three additive QTL and seven epistatic interactions could plausibly represent 10–12 individual loci with 2 of the 3 additive loci also participating in an epistatic interaction. The 12 loci for germination percentage defined by two additive QTL and five epistatic interactions could plausibly represent 8–10 individual loci with both of the additive loci participating in an epistatic interaction. Seed length may have 16 total loci from four additive QTL and eight epistatic interactions, while seed width could have as few as 7 loci arranged as two additive QTL and six epistatic interactions. These results, diagrammed in Figure 3, indicate that the genetic architecture underlying fitness in these lines is a network of epistatic and additive effects.
Weinig et al. (2003) studied the inheritance of fitness components in the same set of Landsberg × Columbia recombinant inbred lines, grown in fields in North Carolina and Rhode Island. Fruit number was measured under three conditions: a spring cohort in North Carolina and both a spring and a fall cohort in Rhode Island. They found two additive QTL for fall fruit number in Rhode Island, six additive QTL for spring fruit number in Rhode Island, and one additive QTL for spring fruit number in North Carolina. After identifying additive QTL, Weinig et al. (2003) performed a search for epistatic interactions among combinations of markers linked to the additive QTL as well as markers linked to a candidate gene of interest, TFL1, an approach different from the all-pairwise marker comparison search method that we used. They found four significant epistatic interactions involving a total of five markers for spring fruit number in the lines grown in Rhode Island, but not in the other growth cohorts. Three of the markers and one of the interactions mapped to the upper arm of chromosome 5 in a region spanning ∼40 cM, which contained three additive QTL.
Both the additive QTL and the epistatic interactions that Weinig et al. (2003) identified are different from the ones that we report here as judged by the map locations of the markers involved; however, the total number of additive QTL is similar to the numbers that we found, and they did find evidence for epistasis in one environment even with the more restricted search approach that they used. While the specific loci involved vary with different growing conditions, the overall pattern of the genetic architecture for fitness in A. thaliana may be a small number of additive QTL and a comparable but larger number of epistatic QTL.
Kroymann and Mitchell-Olds (2005) have recently studied a QTL for plant mass (growth rate) in A. thaliana derived from the Landsberg × Columbia recombinant inbred lines in controlled growth chamber studies. They performed a genetic dissection of a 1-cM/210-kb interval on chromosome 5 to create near isogenic lines. They identified two QTL within this region and also demonstrated a significant epistatic effect of 34% on the total biomass, depending upon the parental background used for the same segment. The magnitude of this effect is similar to the magnitudes that we noted for fruit number. Kroymann and Mitchell-Olds (2005) also detected high levels of nucleotide polymorphism in this region indicative of balancing selection. The authors predict that complex traits in A. thaliana will have a highly polygenic and epistatic architecture, a conclusion that is consistent with our results.
Field growth vs. greenhouse growth:
We also examined the differences between additive QTL and epistatic interactions among quantitative traits measured from field-grown and greenhouse-grown Landsberg × Columbia recombinant inbred lines. The number of loci involved was similar, but their map positions were largely different for the quantitative traits that we measured (Tables 1 and 3, Figures 1 and 4). A subset of the epistatic interactions showed significant environment interactions when explicitly tested for this in a more rigorous manner. The genetic architecture underlying some quantitative traits of evolutionary or ecological interest may differ, depending upon whether a plant is grown in a growth chamber or a greenhouse or the field. Certainly genotype × environment interactions are well known for QTL (Gurganus et al. 1998; Wang et al. 1999). Weinig et al. (2002, 2003) provide examples of this in the Landsberg × Columbia recombinant inbred lines of A. thaliana; in the first case, finding different QTL for flowering time under field and greenhouse conditions and, in the second case, obtaining different QTL for fruit number for the three different field conditions tested.
Our results illustrate that the genetic basis of epistatic interaction QTL can vary under different growth conditions, as well as it does for additive QTL, and thus reinforce the need for caution in comparing the genetic architecture underlying traits in greenhouse-grown and field-grown plants (Mauricio 2001).
There are other examples of finding epistatic QTL in both plants and animals (recently reviewed in Malmberg and Mauricio 2005). The previously mentioned work of Cheverud (2000) and Peripato et al. (2004) with mice and Shook and Johnson (1999) with C. elegans demonstrated epistatic QTL for fitness-related traits in these organisms. In Arabidopsis, a number of studies have found epistasis in natural variation for quantitative traits of evolutionary or ecological interest (Juenger et al. 2000, 2005; Borevitz et al. 2002; Kearsey et al. 2003; Ungerer et al. 2003; Ungerer and Rieseberg 2003; Weinig et al. 2003; Kroymann and Mitchell-Olds 2005). These studies differ in the methods of detection of epistasis and in the relative number and magnitude of effects of the additive QTL and epistatic QTL found. In this article we found support for the importance of epistatic interactions in evolution, in terms of both the number of loci involved and the strength of the effects compared to the additive QTL, on the basis of measurements of fitness under field conditions.
There is not yet enough data to resolve the questions of how much epistasis contributes to natural variation for fitness among metapopulations and populations and how much it contributes to the process of speciation. From the studies done, there is clearly variability in the amount of epistatic interactions detected, but the number of epistatic interactions also seems to be similar to, and frequently larger than, the number of additive QTL. The approach of performing all pairwise comparisons, without restriction to just the known additive QTL, has been performed in only a very small number of studies of the genetic basis of fitness. Hence, it is difficult to make generalizations about the relative importance of epistasis vs. additive traits. Our data and analysis indicate that there are about twice as many epistatic QTL and interactions as there are additive QTL and that the effects of the epistatic interactions are about double those of the additive QTL; the genetic architecture is composed of a network of epistatic and additive QTL.
Footnotes
Communicating editor: G. Gibson
Acknowledgement
We thank Stacy Jørgensen for helping to plant the field experiment and we are grateful for the efforts of the staff of the University of Georgia's Plant Sciences Farm in preparing the field site as well as the greenhouse staff of the Plant Biology Greenhouses for their help. Two reviewers and Greg Gibson provided useful suggestions to strengthen the manuscript. We also thank Kevin Chase for suggestions on using the Epistat program, Christopher Basten for help with QTL Cartographer, and Lisa Donovan for help with SAS scripts. This work was funded by Department of Energy grant DEFG02-97ER20286 to R.L.M. and National Science Foundation grant DEB-0129191 to R.M.
References
Avery, L., and S. Wasserman,
Barton, N. H.,
Barton, N. H., and M. Turelli,
Basten, C. J., B. S. Weir and Z-B. Zeng,
Basten, C. J., B. S. Weir and Z-B. Zeng,
Bonhoeffer, S., C. Chappey, N. T. Parkin, J. M. Whitcomb and C. J. Petropoulos,
Borevitz, J. O., J. N. Maloof, J. Lutes, T. Dabi, J. L. Redfern et al.,
Caicedo, A. L., J. R. Stinchcombe, K. M. Olsen, J. Schmitt and M. D. Purugganan,
Chase, K., F. R. Adler and K. G. Lark,
Cheverud, J. M.,
Cheverud, J. M., and E. J. Routman,
Cheverud, J. M., T. T. Vaughn, L. S. Pletscher, K. King-Ellison, J. Bailiff et al.,
Churchill, G. A., and R. W. Doerge,
Coyne, J. A., N. H. Barton and M. Turelli,
deVisser, J., R. F. Hoekstra and H. VandenEnde,
Doerge, R. W., and G. A. Churchill,
Elena, S. F., and R. E. Lenski,
Froissart, R., C. O. Wilke, R. Montville, S. K. Remold, L. Chao et al.,
Goodnight, C. J.,
Goodnight, C. J.,
Goodnight, C. J., and M. J. Wade,
Gurganus, M. C., J. D. Fry, S. V. Nuzhdin, E. G. Pasyukova, R. F. Lyman et al.,
Holland, J. B.,
Jansen, R. C., and P. Stam,
Juenger, T., M. Purugganan and T. F. C. Mackay,
Juenger, T. E., S. Sen, K. A. Stowe and E. L. Simms,
Kearsey, M. J., H. S. Pooni and N. H. Syed,
Kondrashov, F. A., and A. S. Kondrashov,
Koornneef, M., H. Blankestijndevries, C. Hanhart, W. Soppe and T. Peeters,
Kroymann, J., and T. Mitchell-Olds,
Lander, E. S., and D. Botstein,
Lander, E. S., P. Green, J. Abrahamson, A. Barlow, M. J. Daly et al.,
Lister, C., and C. Dean,
Lopez-Fanjul, C., A. Fernandez and M. A. Toro,
Lopez-Fanjul, C., A. Fernandez and M. A. Toro,
Malmberg, R. L.,
Malmberg, R. L., and R. Mauricio,
Mauricio, R.,
Mauricio, R.,
Mauricio, R., and M. D. Rausher,
Michaels, S. D., and R. M. Amasino,
Otto, S. P., and T. Lenormand,
Paterson, A. H., E. S. Lander, J. D. Hewitt, S. Peterson, S. E. Lincoln et al.,
Peripato, A. C., R. A. De Brito, S. R. Matioli, L. S. Pletscher, T. Vaughn et al.,
Phillips, P. C., S. P. Otto and M. C. Whitlock,
Routman, E. J., and J. M. Cheverud,
Sanjuán, R., A. Moya and S. F. Elena,
Schlappi, M.,
Sen, S., and G. A. Churchill,
Shook, D. R., and T. E. Johnson,
Templeton, A. R.,
Ungerer, M. C., and L. H. Rieseberg,
Ungerer, M. C., C. R. Linder and L. H. Rieseberg,
Wade, M. J.,
Wade, M. J., and C. J. Goodnight,
Wang, D. L., J. Zhu, Z. K. Li and A. H. Paterson,
Wang, S., C. J. Basten and Z-B. Zeng,
Weinig, C., M. C. Ungerer, L. A. Dorn, N. C. Kane, Y. Toyonaga et al.,
Weinig, C., L. A. Dorn, N. C. Kane, Z. M. German, S. S. Hahdorsdottir et al.,
Weller, J. I.,
Whitlock, M. C., and P. C. Phillips,
Whitlock, M. C., P. C. Phillips and M. J. Wade,
Wolf, J. B., E. D. Brodie, III and M. J. Wade (Editors),
Wright, S.,
