


Abstract
Expressed sequence tag (EST) markers were developed for Ambystoma tigrinum tigrinum (Eastern tiger salamander) and for A. mexicanum (Mexican axolotl) to generate the first comprehensive linkage map for these model amphibians. We identified 14 large linkage groups (125.5–836.7 cM) that presumably correspond to the 14 haploid chromosomes in the Ambystoma genome. The extent of genome coverage for these linkage groups is apparently high because the total map size (5251 cM) falls within the range of theoretical estimates and is consistent with independent empirical estimates. Unlike most vertebrate species, linkage map size in Ambystoma is not strongly correlated with chromosome arm number. Presumably, the large physical genome size (∼30 Gbp) is a major determinant of map size in Ambystoma. To demonstrate the utility of this resource, we mapped the position of two historically significant A. mexicanum mutants, white and melanoid, and also met, a quantitative trait locus (QTL) that contributes to variation in metamorphic timing. This new collection of EST-based PCR markers will better enable the Ambystoma system by facilitating development of new molecular probes, and the linkage map will allow comparative studies of this important vertebrate group.
THE tiger salamander (Ambystoma tigrinum) species complex consists of several closely related and phenotypically diverse taxa that range from central Mexico to southern Canada (Shaffer and McKnight 1996). The complex as a whole is an important, naturalistic model system because taxa are characterized by extensive interspecific and intraspecific variation for a number of ecologically important traits, including expression of metamorphic vs. nonmetamorphic (paedomorphic) life histories (Gould 1977; Shaffer and Voss 1996), timing of metamorphosis (Rose and Armentrout 1976; Voss and Smith 2005), cannibal vs. normal larval morphologies (Powers 1907; Hoffman and Pfennig 1999), infectious disease (Collins et al. 2004), variation in adult coloration and pigment patterning (Reese 1969; Parichy 1996, 1998), and variation in general morphology (Shaffer 1984; Irschick and Shaffer 1997). In addition, these salamanders are important laboratory models for olfaction (Marchand et al. 2004; Park et al. 2004), vision (Thoreson et al. 2004; Chichilnisky and Reike 2005), cardiogenesis (Denz et al. 2004; Zhang et al. 2004), embryogenesis (Bachvarova et al. 2004; Ericsson et al. 2004), and postembryonic development (Parichy 1998; Voss and Smith 2005), including organ and tissue regeneration (Christensen et al. 2002; Schnapp and Tanaka 2005). Both natural and laboratory-based research areas are in need of a comprehensive genome map that can be used to identify the position and effect of loci that contribute to phenotypic variation and that can be used to compare features of the salamander genome to other vertebrates. Moreover, molecular markers that are used to develop linkage maps provide the material for generating nucleotide probes and sequences that can be used in a variety of ways, including in situ hybridization, population genetics, systematics, molecular evolution, and functional genomics.
Several lines of evidence suggest that meiotic or recombinational map size is large in tiger salamanders. The earliest mapping studies in A. mexicanum employed tetrad analysis and gynogenic salamanders for estimating genetic distance between a few phenotypic markers and their centromeres (e.g., three in Lindsley et al. 1955 and seven in Armstrong 1984). Most of these phenotypes were mapped to positions distant from centromeres (unlinked); this suggests a large recombinational map size for Ambystoma relative to other vertebrates where the majority of loci typically show linkage with the centromere (Brown et al. 1998; Steen et al. 1999; Groenen et al. 2000; Kelly et al. 2000; Kong et al. 2002). Using a more direct method, Callan (1966) reported chiasmata counts from A. mexicanum oocyte nuclei ranging from 101 to 126, averaging 113 chiasmata per nucleus. Assuming that one crossover is equivalent to a 50-cM map distance (Sturtevant 1913), this chiasmata frequency converts to an estimated map distance of 5650 cM, which is ∼4.2× larger than that of the mouse genome and 1.6× larger than that of the human genome (Table 1). Finally, Voss et al. (2001) estimated map size from a linkage analysis in which 347 molecular genotypes were obtained for offspring from backcrosses between A. mexicanum and A. mexicanum/A. t. tigrinum hybrids. That analysis yielded one of the largest partial genetic linkage maps ever constructed (∼3400 cM) and an overall map size estimate of 7291 cM based on the method of Hulbert et al. (1988). Thus, all studies to date suggest that recombinational map size is relatively larger in Ambystoma than in other vertebrates. Although recombinational map size in Ambystoma may simply be a consequence of a large physical genome size (Table 1), the contribution of additional factors that are known to strongly influence map length in other vertebrates (e.g., chromosome number and morphology) have not been considered.
Relationships between genome size and map size in vertebrates
Organism | Genome size (Gbp)a | Nb | Chromosomal armsb | Map size (cM)c | Obligatory map (N × 50 cM) | Proportion obligatoryd | cM/arm |
|---|---|---|---|---|---|---|---|
| Mouse | 2.7 | 20 | 20 | 1361 | 1000 | 0.73 (0.73) | 68.1 |
| Rat | 2.6 | 21 | 33 | 1749 | 1050 | 0.60 (0.94) | 53.0 |
| Human | 3.0 | 23 | 46 | 3615 | 1150 | 0.32 (0.64) | 78.6 |
| Chicken | 1.2 | 38 | 44 | 3800 | 1900 | 0.50 (0.58) | 86.4 |
| Zebrafish | 1.8 | 25 | 50 | 3011 | 1250 | 0.42 (0.83) | 60.2 |
| Ambystoma (map)e | 30.0 | 14 | 28 | 5152 | 700 | 0.14 (0.27) | 184.0 |
| Ambystoma (χ)f | 30.0 | 14 | 28 | 5650 | 700 | 0.12 (0.25) | 201.8 |
References: mouse, Mouse Genome Sequencing Consortium (2002); rat, Rat Genome Sequencing Project Consortium (2004); human, International Human Genome Sequencing Consortium (2000); chicken, International Chicken Genome Sequencing Consortium (2005); zebrafish, Kelly et al. (2000); Ambystoma, Licht and Lowcock (1991).
The haploid number of chromosomes. Smaller chicken microchromosomes (10–38; Masabanda et al. 2004) are tabulated as one-armed chromosomes. References: mouse, Mouse Genome Sequencing Consortium (2002); rat, Rat Genome Sequencing Project Consortium (2004); human, International Human Genome Sequencing Consortium (2000); chicken, International Chicken Genome Sequencing Consortium (2005); zebrafish, Gornung et al. (2000); Ambystoma, Callan (1966).
References: mouse, Steen et al. (1999); rat, Brown et al. (1998); human, Kong et al. (2002); chicken, Groenen et al. (2000); zebrafish, Kelly et al. (2000).
Numbers in parentheses represent the obligatory proportion of the map assuming one obligate chiasma per arm.
Map size is estimated as the sum of LG1–14.
Map size is estimated as 50 cM × the average number of chiasmata (Callan 1966).
Recently completed expressed sequence tag (EST) sequencing projects for two tiger salamander species, A. mexicanum (Haberman et al. 2004; Putta et al. 2004) and A. tigrinum tigrinum (Putta et al. 2004), allowed us to rapidly develop a sufficient number of EST-based markers to generate a comprehensive genetic map for Ambystoma, and the first such map for any amphibian. Below we describe this new resource and show its utility in two areas: (1) mapping phenotypic mutants and (2) investigating the relative effects of genome size and chromosome number on recombination-based estimates of genome size. We also note the importance of these EST-based PCR markers as a general resource for tiger salamander research.
MATERIALS AND METHODS
Study species:
A. tigrinum tigrinum:
The Eastern tiger salamander is the archetype of the tiger salamander species complex. This relatively large salamander species breeds in ponds and temporary pools in the eastern and southern parts of the United States; the individual that was used in this study was purchased from Charles D. Sullivan, which collects and distributes amphibians from breeding ponds in the vicinity of Nashville, Tennessee. These salamanders undergo a typical amphibian life cycle, wherein they hatch from the egg in an aquatic-larval form and eventually undergo a metamorphosis through which they achieve a terrestrial adult form.
A. mexicanum:
The Mexican axolotl is native to a single lake in central Mexico (Lake Xochimilco, Mexico D.F., Mexico). It is commonly used in biological research and strains have been maintained in laboratory culture for nearly a century and a half (Dumeril 1870; see also review by Smith 1989). The most notable feature of this salamander is that it exhibits a phenotype, known as paedomorphosis, wherein it forgoes metamorphic changes typical of most ambystomatid salamanders and retains a largely larval morphology throughout adult life. Several developmental mutants have been described for A. mexicanum (Malacinski 1989) and are readily available (http://www.ambystoma.org). We estimated the genomic position of two recessive pigment mutants: white (Häcker 1907) and melanoid (Humphrey and Bagnara 1967). In comparison to wild type, white is characterized by a general lack of epidermal pigment cells, which is caused by failure of pigment cell precursors to migrate or survive in epidermal tissues (reviewed by Parichy et al. 1999). In comparison to wild type, melanoid is characterized by a lack of iridophores in the skin and iris, relatively fewer xanthophores and greater numbers of melanophores (Humphrey and Bagnara 1967).
Molecular markers:
A total of 1095 molecular markers were genotyped using a previously described AxTg mapping family that was generated by backcrossing A. mexicanum/A. t. tigrinum F1 hybrids to a single A. mexicanum (Voss 1995). In a previous study using AxTg, Voss et al. (2001) reported linkage analyses of 323 “anonymous” molecular markers (315 AFLPs and 8 RAPDs) and 24 markers for nuclear protein-coding sequences. Here we report an additional 202 AFLP markers (scored for 44 backcross offspring) and 546 EST-based markers (scored for 91 backcross offspring). Marker fragments were amplified using standard PCR conditions (150 ng DNA, 50 ng each primer, 1.2 mm MgCl2, 0.3 units Taq polymerase, 1× PCR buffer, 200 mm each of dATP, dCTP, dGTP, dTTP; thermal cycling at 94° for 4 min; 33 cycles of 94° for 45 sec, 60° for 45 sec, 72° for 30 sec; and 72° for 7 min). Polymorphisms were diagnosed by primer extension [Perkin-Elmer (Norwalk, CT) AcycloPrime-FP chemistry and Wallac (Gaithersburg, MD) Victor3 plate reader] (e.g., Chen et al. 1999; Hsu et al. 2001; Gardiner and Jack 2002), thermal-gradient capillary gel electrophoresis (SpectruMedix, Reveal), allele-specific amplification, PCR fragment size polymorphism, and restriction digestion. Primer sequences, diagnostic polymorphisms, polymorphism detection assays, numbers of individuals genotyped, and NCBI GI numbers for source sequences for all 570 protein-coding loci are summarized in supplementary Table S1 at http://www.genetics.org/supplemental/. The design of AFLP markers, EST-based markers, and primer extension probes is described in detail below.
Generation of AFLP and RAPD markers:
The methods used to generate AFLPs and RAPDs were reported previously (Voss and Shaffer 1997; Voss et al. 2001). An additional 202 AFLPs were generated for this study using the same methods and backcross progeny. Primer sequences for all AFLPs are provided in supplementary Table S2 at http://www.genetics.org/supplemental/.
EST-based marker design:
The majority of EST-based markers were designed to target 3′-unconserved regions of assembled EST sequences that were derived from A. mexicanum and A. t. tigrinum (Putta et al. 2004). These sequences were identified by first aligning (BLASTx) assembled sequences to a custom database of human protein sequences (Ref Seq Release 3, NCBI). The 3′-most 70 bp of aligning sequence and all remaining nonaligning 3′ sequence were targeted for primer design. These regions presumably correspond to sequence encoding carboxy-terminal regions and 3′-untranslated regions. Primers were designed within these regions using Primer3 software (http://www.mit.wi.edu/Primer3.html). When presumably orthologous sequences (>90% identity) were available for both A. mexicanum and A. t. tigrinum, marker design was additionally constrained to flank at least one polymorphism between the two sequences.
Primer extension probe design:
Primer extension probes were designed to target polymorphisms that were observed between presumptively orthologous EST sequences or between EST sequences and sequenced marker fragments that were amplified from A. mexicanum and A. t. tigrinum. Design of primer extension probes was constrained such that probes were complementary to sequence immediately 3′ of targeted SNP positions. The software package Array Designer 2.1 (PREMIER Biosoft International) was used to identify probes with Tm 60° ± 8° and high Δg for primer hairpin and primer dimer formation.
Construction of the linkage map:
A linkage map was constructed for the tiger salamander using genotypes for 570 protein-coding markers (EST and gene based) and 525 AFLP markers. Linkage analyses were performed using Mapmaker/EXP 3.0b and linkage groups (LG) were visualized using MapManagerQXTb19 (Meer et al. 2004) and MapChart 2.1 (Voorips 2002). This linkage map was constructed by first identifying sets of markers that formed linear linkage groups supported by a log of odds (LOD) ≥5.0 and then by recursively adding markers to these initial groups at lower LOD thresholds (4.0, 3.5, and 3.0). At each step linkage groups were visually inspected to verify the linear arrangement among markers. At each LOD threshold, the addition of new markers to an existing linkage group or merger of two existing linkage groups was constrained such that addition or merger did not disrupt arrangements that were previously set at a higher LOD threshold. A few markers could not be assigned to precise positions within a linkage group, but could be assigned to a single linkage group at LOD >4.0 (supplementary Table S2 at http://www.genetics.org/supplemental/). Linkage distances among markers in the final map were estimated using the Kosambi (1944) mapping function in MapManagerQXTb19 (Meer et al. 2004).
QTL analysis:
Interval analysis was used to identify the positions of two mutant phenotypes that segregated within the AxTg mapping family: white, which is specified by the recessive locus d, and melanoid, which is specified by the recessive locus m. Interval analysis was also used to identify the position of a major-effect QTL that contributes to segregation of metamorphosis vs. paedomorphosis and developmental timing. Segregation patterns of white, melanoid, and metamorphic phenotypes within the AxTg family have been previously described (Voss 1995). Likelihood-ratio statistics (LRS) for association of phenotypic variation with genotypic inheritance were estimated using the interval mapping (e.g., Haley and Knott 1992; Martinez and Curnow 1992; Zeng 1993, 1994) function of MapManagerQTXb19 (Meer et al. 2004). Significance thresholds for interval mapping were obtained through 10,000 permutations of trait values among backcross progeny. Confidence intervals for QTL positions were estimated by the method of Darvasi and Soller (1997).
RESULTS
Segregation of molecular markers:
The segregation of alternate genotypes for a majority of the molecular markers was consistent with the Mendelian expectation of 1:1. Only 7% of protein-coding markers had genotypic ratios exceeding the 95% tail of the χ2 distribution (Figure 1A). On average, ratios of anonymous markers were more deviant than those of protein-coding markers with 17% of markers exceeding the 95% tail of the χ2 distribution (Figure 1B). Plotting χ2 values for both marker classes against genomic position showed that the few markers with significantly deviant ratios were not strongly clustered at any position within the genome (Figure 1C).
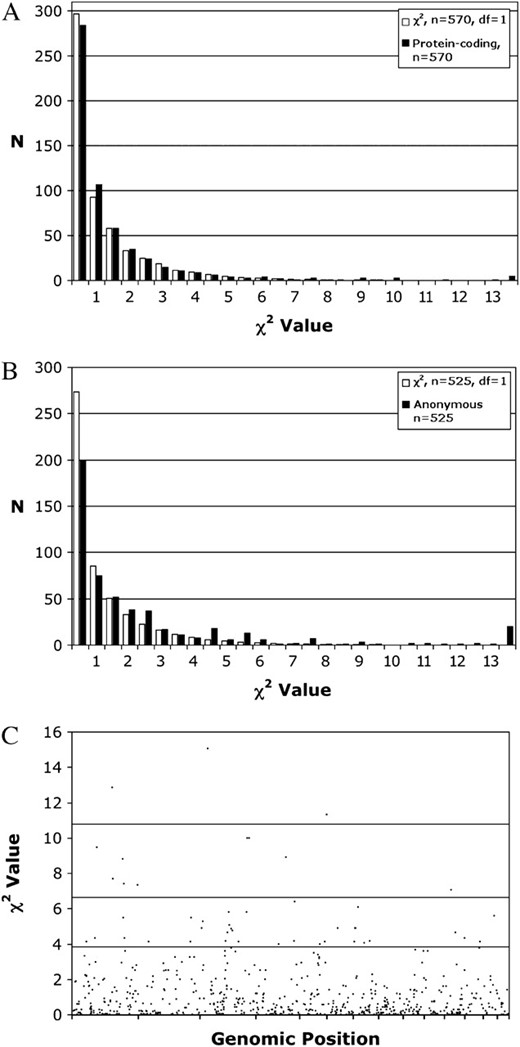
(A) Plot of the distribution of the χ2 statistic for 1:1 segregation of marker genotypes vs. standard χ2 distributions for gene and EST-based markers. (B) Plot of the distribution of the χ2 statistic for 1:1 segregation of marker genotypes vs. standard χ2 distributions for anonymous markers (AFLPs and RAPDs). (C) Plot of χ2 statistics for 1:1 segregation of marker genotypes vs. map position. The x-axis represents LG1–14 concatenated head to tail, and vertical bars demark boundaries between linkage groups.
Linkage analysis:
Linkage analysis revealed 14 large linkage groups that ranged in size from 125.5 to 836.7 cM and consisted of 14–123 markers (Figure 2, Table 2). A total of 790 markers were assigned to these 14 linkage groups, with 486 protein-coding loci and 169 anonymous loci placed at precise positions. The total linkage distance spanned by these markers was 5251.3 cM and the average intermarker distance was 7.96 cM.
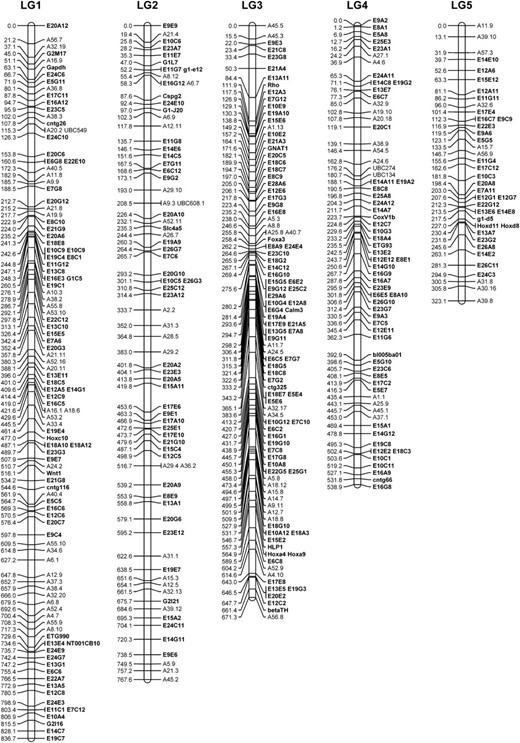
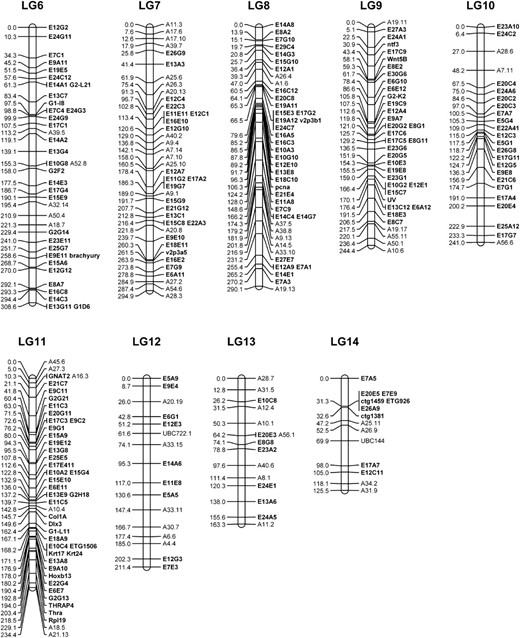
The tiger salamander linkage map (LG1–14).
Distribution of markers on Ambystoma LG1–14
LG | EST baseda | Anonymous markersa | All markers | cM | % map | Average intermarker distance |
|---|---|---|---|---|---|---|
| 1 | 73 (70) | 50 (37) | 123 (107) | 836.7 | 15.9 | 7.8 |
| 2 | 56 (51) | 47 (24) | 130 (75) | 767.6 | 14.6 | 10.2 |
| 3 | 80 (78) | 34 (21) | 114 (99) | 671.3 | 12.8 | 6.8 |
| 4 | 55 (54) | 21 (14) | 76 (68) | 538.9 | 10.3 | 7.9 |
| 5 | 32 (30) | 18 (9) | 50 (39) | 323.1 | 6.2 | 8.3 |
| 6 | 34 (34) | 15 (5) | 49 (39) | 308.6 | 5.9 | 7.9 |
| 7 | 27 (25) | 24 (17) | 51 (42) | 294.9 | 5.6 | 7.0 |
| 8 | 34 (34) | 17 (8) | 51 (42) | 290.1 | 5.5 | 6.9 |
| 9 | 32 (31) | 9 (5) | 41 (36) | 244.4 | 4.7 | 6.8 |
| 10 | 21 (21) | 13 (3) | 34 (24) | 241.0 | 4.6 | 10.0 |
| 11 | 39 (38) | 10 (6) | 49 (44) | 234.4 | 4.5 | 5.3 |
| 12 | 9 (9) | 12 (7) | 21 (16) | 211.4 | 4.0 | 13.2 |
| 13 | 7 (7) | 12 (8) | 19 (15) | 163.3 | 3.1 | 10.9 |
| 14 | 9 (9) | 5 (5) | 14 (14) | 125.5 | 2.4 | 9.0 |
| Total | 508 (491) | 287 (169) | 795 (660) | 5251.3 | 100.0 | 8.0 |
| % mapped | 87.4 | 54.7 | 71.9 |
Numbers in parentheses represent the number of markers that were placed at precise positions within the map.
Thirty-six smaller linkage groups that ranged in size from 0 to 79 cM and consisted of 2–10 markers were identified. Thirteen of these linkage groups contained at least one EST or protein-coding marker and spanned a total of 479.7 cM; 23 additional linkage groups that consisted of only AFLP markers spanned a total of 630.5 cM. A total of 165 markers (134 AFLP and 31 protein coding) did not show linkage to any other marker and were not assigned to any of the linkage groups.
QTL analyses:
white:
Interval analysis identified two LRS peaks for white on LG1 (D1, LRS 37.2, 95% C.I. = 17 cM; D2, LRS 12.4, 95% C.I. = 44 cM) (Figure 3). Although this suggests the possibility that white may depend upon more than a single locus, the lesser LRS peak is only suggestive of a significant QTL and an equally supportive LRS is expected to be observed once at random within the genome. In the mapping cross, color phenotypes segregated as F2-type markers because F1 hybrids and the recurrent A. mexicanum carried a single recessive allele (d) at white (Dtig/dmex and Dmex/dmex genotypes, respectively). In contrast, molecular genotypes segregated as backcross-type markers. As a result, only the A. t. tigrinum marker alleles were fully informative for association testing; that is, we expected that at the position of white, all individuals inheriting A. t. tigrinum molecular marker alleles would exhibit wild-type coloration, but never white coloration. Segregation ratios for two protein-coding markers (E16A12 and E23C5) near the maximum LRS peak on LG1 are consistent with this expectation (Table 3). In contrast, incomplete association was observed for markers from the region with the suggestive LRS. These results indicate that d is most likely located within the 14.2-cM region that includes markers E16A12 and E23C5.
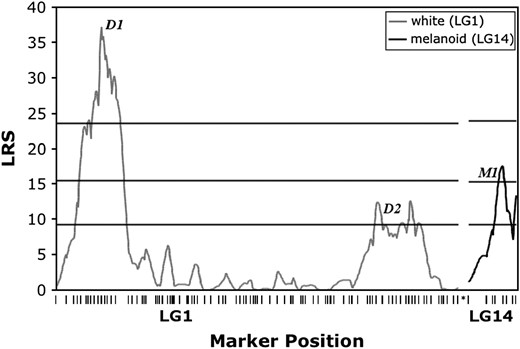
LRS plot for association between segregation of pigment phenotypes and marker genotypes in LG1 and LG14. Horizontal lines represent LRS thresholds for suggestive (37th percentile), significant (95th percentile), and highly significant (99.9th percentile) associations (Lander and Kruglyak 1995) estimated using MapMaker QTXb19.
Segregation of markers associated with white
Phenotype | |||
|---|---|---|---|
| QTL | Genotype | white | + |
| D1 | E16A12Am/E16A12Am | 18 | 20 |
| D1 | E16A12Am/E16A12Att | 0 | 46 |
| D1 | E23C5Am/E23C5Am | 18 | 18 |
| D1 | E23C5Am/E23C5Att | 0 | 43 |
| D2 | A32.20Am/A32.20Am | 16 | 31 |
| D2 | A32.20Am/A32.20Att | 2 | 38 |
Phenotype | |||
|---|---|---|---|
| QTL | Genotype | white | + |
| D1 | E16A12Am/E16A12Am | 18 | 20 |
| D1 | E16A12Am/E16A12Att | 0 | 46 |
| D1 | E23C5Am/E23C5Am | 18 | 18 |
| D1 | E23C5Am/E23C5Att | 0 | 43 |
| D2 | A32.20Am/A32.20Am | 16 | 31 |
| D2 | A32.20Am/A32.20Att | 2 | 38 |
melanoid:
Interval analysis revealed a single region of LG14 that was strongly associated with segregation of the melanoid mutant phenotype (M1, LRS 17.5, 95% C.I. = 32 cM) (Figure 3). As was the case with white, the founding and recurrent A. mexicanum parents that were used to generate the AxTg family were heterozygous for the melanoid mutant (Mmex/mmex). The expressed sequence marker E17A7 is closest to the maximum inflection point of the LRS profile for melanoid. Genotypic ratios for this locus are consistent with tight linkage to melanoid, given the same expectations described above for segregation of molecular markers and the white phenotype (Table 4).
Segregation of markers associated with melanoid
Phenotype | |||
|---|---|---|---|
| QTL | Genotype | melanoid | + |
| M1 | E24E9Am/E24E9Am | 10 | 30 |
| M1 | E24E9Am/E24E9Att | 6 | 41 |
| M1 | E17A7Am/E17A7Am | 14 | 23 |
| M1 | E17A7Am/E17A7Att | 2 | 44 |
Phenotype | |||
|---|---|---|---|
| QTL | Genotype | melanoid | + |
| M1 | E24E9Am/E24E9Am | 10 | 30 |
| M1 | E24E9Am/E24E9Att | 6 | 41 |
| M1 | E17A7Am/E17A7Am | 14 | 23 |
| M1 | E17A7Am/E17A7Att | 2 | 44 |
Metamorphosis vs. paedomorphosis:
Interval analysis revealed a single region of LG3 that was strongly associated with segregation of metamorphosis vs. paedomorphosis in the AxTg family (LRS 101.7, 95% C.I. = 9 cM) (Figure 4). The marker ctg325 lies closest to the maximum inflection point of the LRS profile. This QTL is located near the middle of LG3 and corresponds to the previously described met QTL (Voss and Shaffer 1997; Voss and Smith 2005). A region of LG4 also showed a suggestive association with segregation of metamorphosis vs. paedomorphosis, although it is much weaker relative to met.
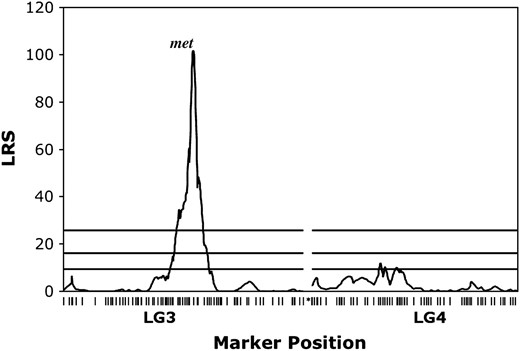
LRS plot for association between segregation of metamorphosis vs. paedomorphosis and marker genotypes in LG3 and LG4. Horizontal lines represent LRS thresholds for suggestive (37th percentile), significant (95th percentile), and highly significant (99.9th percentile) associations (Lander and Kruglyak 1995) estimated using MapMaker QTXb19.
BLAST alignments to the human RefSeq database:
Our BLASTx analysis of 570 EST/gene-based markers yielded alignments with multiple human protein-coding genes. In total, 390 presumptive protein-coding markers had best BLASTx alignments with 350 nonredundant human RefSeq proteins. Best BLASTx matches and corresponding bitscore and E-values are provided in supplementary Table S3 at http://www.genetics.org/supplemental/. Analyses of conserved synteny and segmental homology between Ambystoma and other vertebrate species are presented elsewhere.
DISCUSSION
We have generated the first comprehensive linkage map for Ambystoma by mapping >1000 anonymous markers and EST loci in an interspecific mapping panel. Fourteen large (>125–836 cM) and 35 small (0–75 cM) linkage groups were identified. Because the number of large linkage groups equaled the haploid chromosome number in A. t. tigrinum and A. mexicanum (Paramenter 1919; Fankhauser and Humphrey 1942), and because these linkage groups yielded a map size estimate that agrees with a theoretical and empirical (see below) estimate of total map size, we propose this set as a framework for the 14 chromosomes in the tiger salamander genome. It is unlikely that the collection of smaller linkage groups represent any additional chromosomes within the Ambystoma genome because the haploid chromosome number is indisputably 14 and microchromosomes are not known in this group.
Map coverage:
The combined map distance of our 14 largest linkage groups (5251 cM) is consistent with previous studies that indicated a large genetic map for Ambystoma. By comparison, the combined map length of LG1 and LG2 is greater than the total map length of the mouse genome! Marker-based estimates of genome size vary greatly for Ambystoma (e.g., 2600–6276 cM in Armstrong 1984 and 7291 cM in Voss et al. 2001). This variation may be attributed to the large genome size of Ambystoma and the nonrobust nature of estimators; genotyping errors and missing data cause upward bias in size estimates and nonrandom distribution of markers with respect to recombinational distances causes downward bias (Chakravarti et al. 1991). We estimated genome size using linkage data from this study and the method of Hulbert et al. (1988). Analyses were performed separately for protein coding and anonymous marker classes and for the combined data set using several linkage thresholds (10, 15, 20, 25, and 30 cM; data not shown). Estimates of map size varied greatly depending on data set and linkage threshold: estimates based on protein-coding markers ranged from 3741 to 4320 cM (15 and 30 cM thresholds, respectively), estimates from anonymous markers ranged from 6925 to 10,782 cM (25 and 10 cM thresholds, respectively), and estimates based on the entire data set ranged from 7624 to 8824 cM (25 and 10 cM thresholds, respectively). Presumably, higher intrinsic error rates of AFLP markers (e.g., Isidore et al. 2003) (Figure 1, A and B) yield inflated estimates of map size in the anonymous and combined data sets.
Fortunately, a more direct and independent estimate of recombination frequency is available for A. mexicanum. Callan's (1966) counts of chiasmata in A. mexicanum oocyte nuclei convert to an estimated map size of 5650 cM. This estimate is only slightly higher than the sum of our 14 largest linkage groups (5251 cM). Several factors likely contribute to the relatively small difference between these two estimates, including incomplete coverage of the linkage map (especially near the telomeres), the degree to which the Kosambi (1944) mapping function models recombination in Ambystoma, variation in average recombination rate between the male F1's used in this study and the female A. mexicanum used by Callan (1966), and possibly small-scale differences in gene order between A. t. tigrinum and A. mexicanum (Sybengia 1992; True et al. 1996). Close agreement between the Callan (1966)-derived estimate and our recombination-based estimates of genome size suggest that the 14 large linkage groups that we identified frame the majority of the Ambystoma genome.
Some of the smaller linkage groups may represent distal portions of chromosomes that are represented by larger linkage groups. Recombination rates are known to increase toward the ends of chromosomal arms in a wide array of organisms, including mammals (e.g., Jensen-Semen et al. 2004), chickens (International Chicken Genome Sequencing Consortium 2005), and grasses (King et al. 2002; Anderson et al. 2004). In agreement with this pattern, Callan (1966) reported a higher-than-average recombination rate between the nucleolar organizing region (NOR) and the adjacent telomere in A. mexicanum. Alternately, some of these linkage groups may consist completely or partly of markers with genotyping error rates that prevent assignment to larger linkage groups at the LOD 4.0 threshold. Presumably as more loci are mapped, linkage groups that represent distal regions will be integrated into the framework map and spurious linkage groups will be excluded from the map.
Size of the tiger salamander genetic map:
The salamander genome is one of the largest genomes and our linkage map is the largest yet reported for any vertebrate. The tiger salamander genome is estimated to be 10–25× larger than other sequenced vertebrate genomes, yet the genetic map is only 1.5–5× larger (Table 1). Thus, in terms of genome size, the salamander linkage map appears at to be ∼5× smaller than expected. However, because physical and linkage distances do not scale linearly among organisms, variables in addition to physical size must be considered. Chromosome number contributes directly to the size of the genetic map because at least one chiasma must be formed per bivalent to ensure normal segregation of chromatids during meiosis in most species (Egel 1995; Roeder 1997; Moore and Orr-Weaver 1998), although achiasmate meiosis has evolved in several plant and invertebrate species (reviewed by John 1990). Therefore, the minimum map size of any eukaryotic genome is 50 cM × the haploid number of chromosomes. Furthermore, there is a strong correlation between chromosome arm number and genetic map size among mammals, suggesting that formation of at least one chiasma per chromosomal arm may be necessary in mammals (Durtilleaux 1986; Pardo-Manuel de Villena and Sapienza 2001). Map sizes for human, mouse, rat, chicken, and zebrafish are much closer to their theoretical obligatory minima, on the basis of chromosome arm number, than is the Ambystoma map (Table 1). Analyses that include multiple vertebrate taxa, especially those with large and intermediate genetic map lengths, are needed to fully elucidate the effect of chromosome arm number and other variables on genetic map size. However, it is apparent from the comparisons made here that linkage map size in Ambystoma is influenced by factors in addition to chromosome arm number, the most likely factor being the large physical genome size of Ambystoma.
Refining the positional estimate of white and tentative assignment of LG1 to the chromosome harboring the NOR:
The white phenotype has been a subject of several linkage analyses. Early tetrad mapping studies located d in the distal region of an unknown chromosome (Lindsley et al. 1955; Armstrong 1984) and several studies have observed an association between segregation of white and segregation of NOR variants (reviewed by Sinclair et al. 1978). The NOR is located subterminally on one of the four largest chromosomes (Paramenter 1919; Dearing 1934; Haschuka and Brunst 1965; Callan 1966; Cuny and Malacinski 1985). In our study we identified a single region of the genome that was significantly associated with white. The maximum inflection point of the LRS profile for association with white is located 95 cM from the end of the largest linkage group (LG1). Callan's (1966) chiasmata counts place the NOR at ∼44 cM from the end of a chromosomal arm. Localization of white to the distal portion of a large linkage group is consistent with previous studies that indicated linkage between white and the NOR. We therefore conclude that LG1 likely represents the NOR-containing chromosome, with marker E20A12 located near the distal portion of the arm harboring the NOR.
Identification of the genomic interval containing melanoid:
We have identified a single region within the smallest of our 14 linkage groups that shows strong association with segregation of the melanoid phenotype. Armstrong's (1984) tetrad analyses yielded an estimated distance of 59.1 cM between melanoid and its centromere. Assuming that LG14 corresponds to one of the smaller chromosomes, the maximum inflection point of the LRS profile for melanoid is consistent with the earlier gene-centromere mapping study. The size of LG14 relative to the rest of the genetic map appears to support the assignment of LG14 to the smallest chromosome. Precise chromosomal measurements have been made for A. tigrinum (Paramenter 1919) and A. mexicanum (Callan 1966); the proportion of the genome occupied by the smallest chromosome was estimated to be 2.65% for A. tigrinum and 2.4% for A. mexicanum. Our LG14 represents 2.4% of the current genetic map (LG1–14). Although we do not expect a linear relationship between genetic and physical distance, our results are consistent with melanoid being located on one of the smaller tiger salamander chromosomes.
The genetic basis of metamorphic failure in lab A. mexicanum:
It has been known for some time that expression of paedomorphosis in laboratory A. mexicanum is largely determined by a single genetic factor (Tompkins 1978; Voss 1995). A previous QTL analysis of the AxTg mapping panel using 234 AFLP markers identified a major-effect QTL (met) that is associated with expression of paedomorphosis vs. metamorphosis (Voss and Shaffer 1997); met was later shown to affect metamorphic timing in crosses using wild-caught A. mexicanum (Voss and Smith 2005). Our QTL analysis using all of the newly mapped markers did not identify statistically significant factors in addition to met; however, a second region of the genome yielded a statistically suggestive result. The relatively small number of individuals in the AxTg panel does not provide sufficient power to identify small-effect QTL. This second genomic region will be tested using the much larger WILD2 mapping panel (Voss and Smith 2005) in future work.
EST markers and Ambystoma research:
The collection of EST markers that constitute our linkage map are significant new resources for Ambystoma research. Because these markers correspond to polymorphic expressed sequences with known linkage relationships, they are especially informative as probes for developmental, populational, systematic, molecular, comparative, and functional studies (Putta et al. 2004). Using the PCR primer information provided in supplementary Table S1 at http://www.genetics.org/supplemental/, it will now be possible to develop probes for many protein-coding genes for A. mexicanum and A. t. tigrinum, as well as for other ambystomatid species (Riley et al. 2003; Fitzpatrick and Shaffer 2004; Putta et al. 2004). Primer sequences for protein-coding markers, their corresponding assembled and curated EST sequences, and BLAST alignments can also be obtained at the Salamander Genome Project website (http://www.ambystoma.org).
Footnotes
Communicating editor: A. Long
Acknowledgement
This work was supported by grants to S.R.V. from the National Science Foundation (IOB-0242833) and the National Center for Research Resources (NCRR; 5R24RR016344) at the National Institutes of Health (NIH). This research also utilized computing resources and facilities provided by the University of Kentucky subcontract from the NIH grant 2P20RR016481-04 from the NCRR.
References
Anderson, L. K., N. Salameh, H. W. Bass, L. C. Harper, W. Z. Cande et al.,
Armstrong, J. B.,
Bachvarova, R. F., T. Masi, M. Drum, N. Parker, K. Mason et al.,
Brown, D. M., T. C. Matise, G. Kioke, J. S. Simon, E. S. Winer et al.,
Callan, H. G.,
Chakravarti, A., L. K. Lasher and J. E. Reefer,
Chen, X., L. Levine and P-Y. Kwok,
Chichilnisky, E. J., and F. Reike,
Christensen, R. N., M. Weinstein and R. A. Tassava,
Collins, J. P., J. L. Brunner, J. K. Jancovich and D. M. Schock,
Cuny, R., and G. M. Malacinski,
Darvasi, A., and M. Soller,
Dearing, W. H.,
Denz, C. R., A. Narshi, R. W. Zajdel and D. K. Dube,
Dumeril, A. H. A.,
Durtilleaux, B.,
Egel, E. R.,
Ericsson, R., R. Cerny, P. Falck and L. Olsson,
Fankhauser, G., and R. R. Humphrey,
Fitzpatrick, B. M., and H. B. Shaffer,
Gardiner, A. F., and W. E. Jack,
Gornung, E., I. Gabrielli, S. Cataudella and L. Sola,
Groenen, M. A. M., H. H. Cheng, N. Bumstead, B. F. Benkel, W. E. Briles et al.,
Haberman, E. T., A-G. Bebin, S. Herklotz, M. Volkmer, K. Eckelt et al.,
Haley, C. S., and S. A. Knott,
Haschuka, T. S., and V. V. Brunst,
Hoffman, E. A., and D. W. Pfennig,
Hsu, T. M., X. Chen, S. Duan, R. D. Miller and P-Y. Kwok,
Hulbert, S., T. W. Ilott, E. J. Legg, S. E. Linclon, E. S. Lander et al.,
Humphrey, R. R., and J. T. Bagnara,
International Chicken Genome Sequencing Consortium,
International Human Genome Sequencing Consortium,
Irschick, D. J., and H. B. Shaffer,
Isidore, E., H. van Os, S. Andrzejewski, J. Bakker, I. Barrena et al.,
Jensen-Semen, M. I., T. S. Furley, B. A. Payseur, Y. Lu, K. M. Roskin et al.,
Kelly, P. D., F. Chu, I. G. Woods, P. Ngo-hazelett, T. Cardozo et al.,
King, J., L. A. Roberts, M. J. Kearsey, H. M. Thomas, R. N. Jones et al.,
Kong, A., D. F. Gubdjartsson, J. Sainz, G. M. Jonsdottir, S. A. Gudjonsson et al.,
Kosambi, D.D.,
Lander, E., and L. Kruglyak,
Licht, L. E., and L. A. Lowcock,
Lindsley, D. L., G. Fankhauser and R. R. Humphrey,
Malacinski, G. M.,
Marchand, J. E., X. H. Yang, D. Chikaraishi, J. Krieger, H. Breer et al.,
Martinez, O., and R. N. Curnow,
Masabanda, J. S., D. W. Burt, C. M. O'Brien, A. Vignal, V. Fillon et al.,
Meer, J. M., R. H. Cudmore, Jr. and K. F. Manly,
Moore, D. P., and T. L. Orr-Weaver,
Mouse Genome Sequencing Consortium,
Paramenter, C. L.,
Pardo-Manuel De Villena, F., and C. Sapienza,
Parichy, D. M.,
Parichy, D. M.,
Parichy, D. M., M. Stigson and S. R. Voss,
Park, D., J. M. McGuire, A. L. Majchrzak, J. M. Ziobro and H. L. Eisthen,
Powers, J. H.,
Putta, S., J. J. Smith, J. Walker, M. Rondet, D. W. Weisrock et al.,
Rat Genome Sequencing Project Consortium,
Reese, R. W.,
Riley, S. P. D., H. B. Shaffer, S. R. Voss and B. M. Fitzpatrick,
Rose, F. L., and D. Armentrout,
Schnapp, E., and E. M. Tanaka,
Shaffer, H. B.,
Shaffer, H. B., and M. L. McKnight,
Shaffer, H. B., and S. R. Voss,
Sinclair, J. H., C. R. Carrol and G. M. Malacinski,
Smith, H. M.,
Steen, R. G., A. E. Kitweck-Black, C. Glenn, J. Gullings-Handley, W. Van Etten et al.,
Sturtevant, A. H.,
Sybengia, J.,
Thoreson, W. B., K. Rabl, E. Townes-Anderson and R. Heilelberger,
True, J. R., B. S. Weir and C. C. Laurie,
Voss, S. R.,
Voss, S. R., and H. B. Shaffer,
Voss, S. R., and J. J. Smith,
Voss, S. R., J. J. Smith, D. M. Gardiner and D. M. Parichy,
Zeng, Z-B.,
Zhang, C., F. Meng, X. P. Huang, R. Zajdel, S. L. Lemanski et al.,
