


Abstract
Molecular population genetic investigation of Drosophila male reproductive genes has focused primarily on melanogaster subgroup accessory gland protein genes (Acp's). Consistent with observations from male reproductive genes of numerous taxa, Acp's evolve more rapidly than nonreproductive genes. However, within the Drosophila genus, large data sets from additional types of male reproductive genes and from different species groups are lacking. Here we report findings from a molecular population genetics analysis of male reproductive genes of the repleta group species, Drosophila arizonae and D. mojavensis. We find that Acp's have dramatically higher average pairwise Ka/Ks (0.93) than testis-enriched genes (0.19) and previously reported melanogaster subgroup Acp's (0.42). Overall, 10 of 19 Acp's have Ka/Ks > 1 either in nonpolarized analyses or in at least one lineage of polarized analyses. Of the nine Acp's for which outgroup data were available, average Ka/Ks was considerably higher in D. mojavensis (2.08) than in D. arizonae (0.87). Contrasts of polymorphism and divergence suggest that adaptive protein evolution at Acp's is more common in D. mojavensis than in D. arizonae.
MOLECULAR studies in a diverse array of animal taxa suggest that genes involved in reproduction evolve at an accelerated rate relative to other genes (reviewed in Swanson and Vacquier 2002). Positive selection has been inferred for some proteins (Swanson and Vacquier 1995; Metz and Palumbi 1996; Sutton and Wilkinson 1997; Wyckoff et al. 2000; Torgerson et al. 2002), although population genetic data are sufficiently sparse to leave unresolved the question of the relative importance of directional selection vs. genetic drift in reproduction-related proteins compared to other protein classes. In any case, rapid phenotypic/molecular evolution of reproductive characters/genes is consistent with the notion that male-male and male-female interactions may contribute to the rapid divergence between populations and the evolution of reproductive isolation (Eberhard 1996; Rice 1998).
Molecular evolutionary investigation of Drosophila reproduction has focused on male accessory gland protein genes (Acp's) of melanogaster subgroup species. The number of putative Acp's in these species is on the order of 83 (Swanson et al. 2001), although <20 have extensive experimental support (Schäfer 1986; DiBenedetto et al. 1987; Chen et al. 1988; Monsma and Wolfner 1988; Wolfner et al. 1997). Genetic analysis has shown that Acp's contribute to proper sperm storage (Neubaum and Wolfner 1999; Tram and Wolfner 1999; Chapman et al. 2000), normal ovulation and oviposition (Herndon and Wolfner 1995; Heifetz et al. 2000), increased egg-laying rates, and reduced female receptivity (Chen et al. 1988; Aigaki et al. 1991; Kalb et al. 1993; Chapman et al. 2003; Liu and Kubli 2003). Acp's show higher rates of protein divergence (Aguadé 1997, 1998, 1999; Tsaur and Wu 1997; Tsaur et al. 1998; Begun et al. 2000; Swanson et al. 2001) and protein polymorphism (Coulthart and Singh 1988; Begun et al. 2000) compared to “average” proteins in Drosophila melanogaster and D. simulans (e.g., Begun et al. 2000). Less energy has been devoted to population genetic investigation of male reproductive genes primarily expressed in testes (but see Duvernell and Eanes 2000; Parsch et al. 2001a). However, a few analyses suggest that Drosophila testis-expressed genes evolve quickly (Parsch et al. 2001b; Meiklejohn et al. 2004; Richards et al. 2005) and may sometimes be associated with evolution of novel function (Long and Langley 1993; Nurminsky et al. 1998; Betrán and Long 2003).
Because our current population genetic understanding of Drosophila is dominated by data from melanogaster subgroup species, we have no way of knowing whether the patterns of polymorphism and divergence or the functional biology of reproduction-related proteins will be similar in other Drosophila species (Wagstaff and Begun 2005). Given the hypothesis that the dynamics of certain male reproduction-related proteins may be driven by male-male and male-female postcopulatory interactions, one strategy for furthering our understanding of the evolution of these proteins is to investigate Drosophila species having different reproductive biology from D. melanogaster and D. simulans. D. arizonae and D. mojavensis are cactophilic fly species within the mulleri complex of the repleta group. As members of the subgenus Drosophila, these desert Drosophila are ∼40–60 million years diverged from D. melanogaster and other Sophophora subgenus flies (Powell and DeSalle 1995).
A major difference in the reproductive biology of desert Drosophila vs. D. melanogaster is that remating occurs more frequently in desert Drosophila. Within 24 hr of an initial mating, 95% of D. arizonae and D. mojavensis females tend to remate, while only 2% of D. melanogaster females remate in this same time period (Markow 1982, 1996). Frequent remating favors competition between male ejaculates, whereas infrequent remating would be more likely to favor genotypes successfully obtaining initial access to females (e.g., Markow 2002). Data from Drosophila species suggest that there is a positive correlation between high female remating rates and exaggerated ejaculates in the form of either sperm gigantism or excessive ejaculate donation to female tissues (Markow 2002). Although both desert Drosophila species discussed here contribute large ejaculate donations to ovaries, D. arizonae and D. mojavensis contribute small and large donations, respectively, to female somatic tissues (Pitnick et al. 1997). Experiments in D. melanogaster revealed no detectable incorporation of ejaculate-derived material into female somatic or ovarian tissues (Pitnick et al. 1997). While ejaculate donations are often perceived to be of nutritive value, a cost to remating has been observed in D. mojavensis females, suggesting the possibility of sexual conflict (Etges and Heed 1992). Another major difference in the reproductive biology of repleta group vs. melanogaster subgroup flies is that repleta group males require significantly more time to reach sexual maturity. For example, D. arizonae and D. mojavensis require 4–5 days posteclosion to reach maturity, compared to 1–2 days for D. melanogaster males (Pitnick et al. 1995).
Data on natural variation in reproductive traits suggest a more dynamic postmating interaction between the sexes in desert Drosophila compared to melanogaster subgroup flies. Immediately after mating, a pronounced insemination reaction occurs in the female reproductive tract of D. arizonae and D. mojavensis (Patterson 1947; Patterson and Stone 1952) but is absent in D. melanogaster (Wheeler 1947; Markow and Ankney 1988). The reaction manifests itself as a large mass within the vaginal pouch and acts as a barrier that prevents remating for the several hours that it persists (Patterson 1947; Knowles and Markow 2001). Seminal fluid proteins may be the primary male contributor to this phenotype, as it is triggered in the absence of live spermatozoa (Patterson 1947). Comparisons between desert Drosophila species, as well as between different populations within species, show that postcopulatory male-female interactions change across short evolutionary time periods. For example, heterospecific matings between D. arizonae and D. mojavensis trigger an exaggerated insemination reaction that is both harder and longer lasting than that of the respective conspecific matings of either species (Patterson 1947). Moreover, both D. arizonae and D. mojavensis show larger and longer insemination reactions in interpopulation vs. intrapopulation crosses (Knowles and Markow 2001) within species. Further evidence of rapid evolution of reproductive traits comes from the observation that D. mojavensis shows significant among-population variation in the correlated traits of male sperm size and female sperm-storage organ length (Pitnick et al. 2003).
These data support the idea that properties of ejaculates or ejaculate-female interactions evolve very quickly in desert Drosophila, possibly as a result of antagonistic coevolution between the sexes (Rice 1996, 1998) and/or cryptic female choice (Eberhard 1996). We should expect such elaboration of ejaculate characteristics to extend to the molecular level. The purpose of this study is to add a molecular framework to investigation of desert Drosophila reproduction. First, we report the composition of D. mojavensis male reproductive tract cDNA libraries relative to the gene annotations of D. melanogaster. Many of these data are presented as supplementary online material (http://www.genetics.org/supplemental). Second, we report results from molecular and evolutionary analyses of genes expressed in male reproductive tracts in D. mojavensis and D. arizonae and compare these results to those previously reported from D. melanogaster/D. simulans.
MATERIALS AND METHODS
D. mojavensis reproductive tract library:
Poly(A)-enriched mRNA was prepared with the MicroPoly(A)-Pure kit (Ambion, Austin, TX) from 50 whole reproductive tracts of adult male D. mojavensis flies. First-strand cDNA was reverse transcribed with the SMART PCR cDNA synthesis system reagents and protocol (CLONTECH, Palo Alto, CA). Second-strand product was produced with the Expand high-fidelity polymerase system (Roche Molecular Biochemicals, Indianapolis). Cycling parameters were programmed as instructed by the manufacturer, including a 4-min extension step for 10 total cycles. The second-strand product was cloned into the TOPO vector (Invitrogen, San Diego) and used for bacterial transformations according to the manufacturer's instructions. Colony PCR was carried out using cloning-vector-derived primers (M13 reverse and T7) on 480 colonies (i.e., five 96-well plates). The resulting PCR products were purified prior to sequencing with M13R and T7 primers on an Applied Biosystems (Foster City, CA) 377 automated sequencer (ABI, Columbia, MD). These sequences included 54 unique transcripts. Expressed sequence tags (ESTs) from this library can be found under accession nos. DR033184–DR033386 and DR033894–DR033895.
Preliminary expression analysis and D. mojavensis testis cDNA library production:
Dot blots prepared from PCR products of the 54 unique clones were hybridized separately to 32P-labeled cDNAs derived from D. mojavensis accessory glands and testes. Hybridizations were carried out at 65° in a buffer consisting of 0.5 m NaPi (pH 7.2), 7% SDS, 1 mm EDTA. Filters were washed at 60° with buffer at 40 mm NaPi, 1% SDS, and 1 mm EDTA. Comparison of signal intensities from hybridization of labeled accessory gland vs. testis cDNA suggested that the majority of the clones represented accessory gland transcripts.
To increase the sample size of testis-enriched transcripts we made a testis cDNA library. This library was produced as described above for whole reproductive tracts, but with 50 D. mojavensis dissected testes as the source tissue. This library was sequenced to the point of producing 118 unique ESTs. ESTs from the testis library can be found under accession nos. DR033387–DR033542.
BLAST methodology and characterization of amino acid sequences:
All unique ESTs were compared to D. melanogaster through a pipeline of BLAST analyses to one or more FlyBase Release 3.1 databases (Altschul et al. 1997). Default BLAST parameters were used except that the cutoff value for significance was set to E = 0.01. The pipeline started with BLASTp (protein to predicted D. melanogaster proteins) queries of all ESTs for which an open reading frame (ORF) was well established (as described below). ESTs that returned significant (E < 1e-8) D. melanogaster sequences were not queried further. The remaining ESTs were BLASTx (nucleotide to protein) queried to the same D. melanogaster database. Once again, ESTs that returned small E-values were not queried further. This pipeline continued through tBLASTx (nucleotide to nucleotide query, using all six possible protein translations of the sequences) and BLASTn (nucleotide to nucleotide) queries of predicted D. melanogaster genes and chromosome arms. For the ESTs that returned no D. melanogaster sequences at E < 0.0001, the NCBI whole-genome shotgun (wgs) database was tBLASTx queried with the same default parameters (Altschul et al. 1997). The NCBI wgs database includes many complete genomes, including D. pseudoobscura and the mosquito, Anopheles gambiae. All D. mojavensis ESTs were also tBLASTx or BLASTn queried (BLASTn was used only if tBLASTx failed to return sequences of E < 0.0001) to the D. melanogaster dbEST database using default BLAST parameters and an E-score cutoff of 0.01. Finally, we queried the SignalP 3.0 (Nielsen and Krogh 1998; Bendtsen et al. 2004) and NCBI CDD (Marchler-Bauer et al. 2003) servers with amino acid sequences corresponding to ESTs with identifiable ORFs to identify the presence of signal peptides and conserved domains, respectively.
A subset of genes isolated from both libraries was scrutinized in greater detail to winnow candidates for population genetic analysis. Each clone sequence was subjected to an ORF analysis by the GeneJockey software program (Biosoft, Ferguson, MO). If a putative initiation codon followed by an ORF covering at least 70% of the EST could not be identified, we used RACE to gather additional cDNA sequence data.
Reproductively mature D. mojavensis adults of both sexes served as the tissue source for RACE-ready template. mRNA was isolated using the MicroPoly(A)-Pure kit (Ambion, Austin, TX). RACE-ready cDNA was prepared and target molecules were PCR amplified and isolated using the GeneRacer (Invitrogen) protocol, which preferentially selects full-length transcripts for first-strand cDNA synthesis. RACE products derived from such a library should provide high-quality information on the 5′ ends of transcripts. Several criteria were used to identify the set of ORFs ultimately used in molecular evolutionary analysis: (i) size and position of candidate ORFs within an EST, (ii) presence of a predicted signal peptide sequence for putative Acp's (Wolfner et al. 1997; Swanson et al. 2001), (iii) tBLASTx homology to genes in public databases (e.g., D. melanogaster genome release 3.1), and (iv) presence/absence of INDEL mutations and/or premature termination codons in polymorphism data from genomic DNA. Only strongly supported ORFs were used in evolutionary analysis.
Quantitative PCR evaluation of ESTs:
Genes targeted for population genetic analyses as accessory gland vs. testis-enriched in expression on the basis of dot blots were subjected to more rigorous quantification of transcript distribution and abundance by real-time quantitative PCR. For the subset of genes in which a related D. melanogaster gene was identified, quantitative PCR was also carried out in D. melanogaster to provide comparisons of expression between lineages. The purpose of this analysis was to assign genes to three expression classes: Acp, testis enriched, and other tissues. A total of 58 and 33 genes were investigated in D. mojavensis and D. melanogaster, respectively.
Tissue dissections consisted of 80 D. mojavensis and 40 D. melanogaster male flies. All flies were reproductively mature and were dissected in RNAlater (Ambion) into three tissue categories: accessory glands, testes, and carcasses without the reproductive tracts. Each collection of dissected tissues was divided equally into two replicate samples for RNA isolation. Likewise, whole, reproductively mature female flies from each species (n = 40) were evenly split into two replicate RNA preps. Total RNA was extracted using Trizol Reagent (Invitrogen), purified through RNeasy (QIAGEN) columns, and treated with DNase according to manufacturer's instructions (QIAGEN). RNAs were then reverse transcribed at a concentration of 20 ng/μl using TaqMan reverse transcription (RT) reagents (Applied Biosystems). These first-strand cDNAs served as the templates for quantitative PCR analysis.
Quantitative PCR was performed using an ABI Prism 7700 sequence detector and SYBR green PCR core reagents (Applied Biosystems). Amplification primers were designed with Primer Express (Applied Biosystems). For every 20-μl PCR reaction, 0.5 μl of first-strand cDNA was used. Quantitative PCR conditions were 94° for 10 min followed by 40 cycles of 94° for 20 sec, 59° for 30 sec, and 72° for 30 sec. A dissociation step was added to the end of the run to ensure that only a single amplicon was produced in each reaction. All primer pairs produced a single product. A total of 13 quantitative PCRs were processed for each gene. Three reactions were run for each of the four tissues: one for each of the two replicate RT reactions as well as a single minus-RT reaction derived by drawing equally from the minus-RT templates of paired replicates. The 13th reaction was a no-template control. We found no evidence of genomic contamination or primer-by-reagent interactions.
Quantitative PCR quantification:
Quantification followed the
Our calculation of
Quantitative PCR statistics:
Replicate
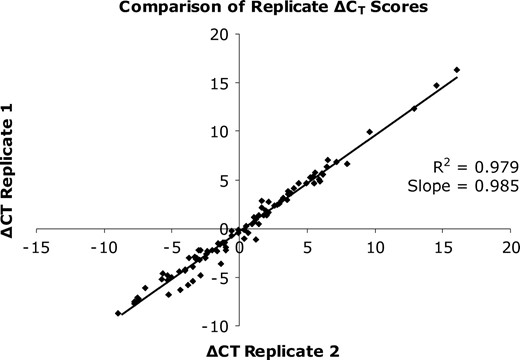
Comparison of replicate ΔCT scores. Each point represents a pair of replicates. Perfect replication would generate slope and R2 scores of 1.0.
We used our replicate
The different critical values for different subsets of the data support the idea that error variance of relative expression levels is greater for genes with the highest
D. mojavensis genomic library:
A genomic library was constructed to provide flanking data around gene sequences to help identify regions of homology between D. melanogaster and D. mojavensis (e.g., Wagstaff and Begun 2005; see supplementary material, http://www.genetics.org/supplemental). D. mojavensis genomic DNA was partially digested with Sau3A and size fractionated by electrophoresis through a 0.6% agarose gel. DNA fragments between 9 and 23 kb were selected via gel extraction (QIAGEN), ligated to λ-DASH II/BamHI vector (Stratagene, La Jolla, CA), and packaged using the Lambda DASH II/Gigapack II cloning kit (Stratagene). The resultant library consisted of ∼2.3 × 10⁶ plaque-forming units. Plaques were screened with 32P-labeled D. mojavensis target DNA. Lambda DNA was purified from selected plaques and D. mojavensis genomic inserts were amplified using T3/T7 vector primers and LA-Taq long PCR polymerase (TaKaRa, Shiga, Japan). The resulting PCR products were sheared by sonication and the fragments were blunt ended using Klenow fragment of DNA polymerase and T4 DNA polymerase. Fragments of 1–2 kb were isolated from a low-melting agarose electrophoresis gel and cloned into the pUC18/SmaI/BAP vector with a Ready-to-Go kit (Amerisham Biosciences, Piscataway, NJ). Sequencing of the phage through ∼7× coverage was performed on an ABI Prism 3700 sequencer. Consensus sequences were assembled using the SeqMan program of the DNASTAR software package (Lasergene, Madison, WI).
Nomenclature:
Unique ESTs were assigned numbers (1–54 for reproductive tract library ESTs, 100–217 for testis library ESTs). Genes from the quantitative PCR analysis showing at least fivefold greater expression (
Stocks and DNA sequencing:
A total of 15 fly stocks from the Drosophila Species Stock Center (Tucson, AZ) were used for collection of most population genetic data. D. arizonae (15081-1271.00, 15081-1271.04, 15081-1271.05, 15081-1271.08, 15081-1271.12, 15081-1271.13, and 15081-1271.14; various locations, mainland Mexico) and D. mojavensis were represented by seven lines each, while a single D. mulleri stock (15081-1371.00; Lake Travis, TX) provided outgroup data. Of the seven D. mojavensis stocks, four were D. mojavensis baja (15081-1351.03, 15081-1351.09, 15081-1351.12, and 15081-1351.14; various locations, Baja, Mexico) and three were D. mojavensis mojavensis (15081-1352.00, 15081-1352.01, and 15081-1352.02; various locations, southern California). Primers used for amplification of genomic DNA were designed from ESTs or from extended sequences identified by RACE analysis. Expand High-Fidelity polymerase (Roche Molecular Biochemicals) was used for PCR amplification. Single alleles for sequencing were isolated by cloning PCR products into the TOPO vector (Invitrogen) and selecting one bacterial colony for PCR amplification for each allele. Amplified colony-PCR products and their associated sequences were obtained using M13 reverse and T7 primers. A second collection of D. mojavensis mainland and Baja strains (kindly provided by W. Etges, University of Arkansas) was used for additional population sequencing of Acp7. PCR products from the Etges strains were directly sequenced. All sequencing was done on an Applied Biosystems 377 automated sequencer (ABI). Sequences were aligned and edited using the DNASTAR software package (Lasergene). Generally, the small, predicted size of most Acp's resulted in survey data for most codons. Compared to Acp's, testis-enriched genes, on average, provided lower coverage of codons on a per gene basis (see Table 1).
Polymorphism and divergence at individual Acp, Tes, and moj genes
Gene | No. alleles a, mo, mua | No. sites analyzed | ORF size | No. coding analyzed | Sample | θsyn | θrep | Ks | Ka | Ka/Ksb |
|---|---|---|---|---|---|---|---|---|---|---|
| Acp1 | 7, 7, 1 | 326 | 354 | 288 | ari | 0.0000 | 0.0131 | 0.0463 | 0.0636 | 1.3744 |
| moj | 0.0291 | 0.0056 | ||||||||
| Acp2 | 7, 7, 1 | 237 | 354 | 234 | ari | 0.0218 | 0.0000 | 0.0638 | 0.0619 | 0.9705 |
| moj | 0.0218 | 0.0184 | ||||||||
| Acp3 | 7, 5, 0 | 305 | 207 | 150 | ari | 0.0342 | 0.0036 | 0.0799 | 0.0744 | 0.9316 |
| moj | 0.0000 | 0.0168 | ||||||||
| Acp5a | 7, 7, 0 | 571 | 105 | 99 | ari | 0.0151 | 0.0057 | 0.1110 | 0.1099 | 0.9896 |
| moj | 0.0000 | 0.0170 | ||||||||
| Acp7 | 7, 7, 1 | 561 | 465 | 453 | ari | 0.0205 | 0.0086 | 0.0468 | 0.0378 | 0.8079 |
| moj | 0.0068 | 0.0086 | ||||||||
| Acp8 | 7, 7, 0 | 275 | 144 | 123 | ari | 0.0128 | 0.0179 | 0.1621 | 0.1214 | 0.7492 |
| moj | 0.0128 | 0.0179 | ||||||||
| Acp11 | 1, 1, 0 | 156 | 201 | 156 | — | — | 0.1600 | 0.0392 | 0.2450 | |
| Acp16a | 7, 6, 0 | 151 | 189 | 141 | ari | 0.0000 | 0.0159 | 0.0596 | 0.1315 | 2.2049 |
| moj | 0.0000 | 0.0299 | ||||||||
| Acp16b | 7, 4, 0 | 214 | 216 | 204 | ari | 0.0251 | 0.0184 | 0.0618 | 0.0499 | 0.8080 |
| moj | 0.0336 | 0.0070 | ||||||||
| Acp19 | 7, 7, 1 | 570 | 687+ | 510 | ari | 0.0107 | 0.0041 | 0.0267 | 0.0332 | 1.2424 |
| moj | 0.0107 | 0.0031 | ||||||||
| Acp21a | 6, 7, 0 | 228 | 207 | 180 | ari | 0.0092 | 0.0066 | 0.0552 | 0.2274 | 4.1209 |
| moj | 0.0086 | 0.0278 | ||||||||
| Acp22 | 1, 2, 0 | 78 | 81 | 78 | — | — | 0.0000 | 0.0000 | — | |
| Acp24 | 6, 7, 0 | 135 | 129 | 120 | ari | 0.0000 | 0.0094 | 0.0559 | 0.0325 | 0.5825 |
| moj | 0.0308 | 0.0175 | ||||||||
| Acp25 | 7, 7, 1 | 324 | 354 | 294 | ari | 0.0346 | 0.0018 | 0.0582 | 0.0314 | 0.5386 |
| moj | 0.0173 | 0.0018 | ||||||||
| Acp27a | 7, 7, 0 | 348 | 291 | 282 | ari | 0.0000 | 0.0019 | 0.0063 | 0.0135 | 2.1379 |
| moj | 0.0120 | 0.0076 | ||||||||
| Acp42 | 7, 7, 0 | 477 | 597+ | 363 | ari | 0.0104 | 0.0043 | 0.0724 | 0.0445 | 0.6146 |
| moj | 0.0260 | 0.0043 | ||||||||
| Acp45 | 1, 1, 0 | 372 | 408 | 372 | — | — | 0.0353 | 0.0323 | 0.9150 | |
| Acp48 | 7, 7, 0 | 516 | 630+ | 513 | ari | 0.0075 | 0.0040 | 0.1504 | 0.0861 | 0.5726 |
| moj | 0.0187 | 0.0051 | ||||||||
| Acp54 | 1, 1, 0 | 102 | 111 | 102 | — | — | 0.0000 | 0.0970 | Ka > Ks | |
| moj9 | 7, 7, 1 | 517 | 786+ | 447 | ari | 0.0228 | 0.0048 | 0.0495 | 0.0046 | 0.0938 |
| moj | 0.0228 | 0.0024 | ||||||||
| moj29 | 1, 1, 0 | 492 | 615 | 492 | — | — | 0.0374 | 0.0026 | 0.0695 | |
| moj30 | 7, 7, 1 | 631 | 621+ | 498 | ari | 0.0350 | 0.0043 | 0.0842 | 0.0056 | 0.0670 |
| moj | 0.0455 | 0.0064 | ||||||||
| moj32 | 1, 1, 0 | 180 | 429+ | 180 | — | — | 0.0000 | 0.0000 | — | |
| moj137 | 1, 1, 0 | 198 | 246+ | 198 | — | — | 0.0000 | 0.0000 | — | |
| moj152 | 1, 1, 0 | 303 | 396+ | 303 | — | — | 0.0893 | 0.0219 | 0.2452 | |
| Tes14 | 7, 7, 1 | 491 | 240 | 240 | ari | 0.0071 | 0.0000 | 0.0134 | 0.0000 | 0.0000 |
| moj | 0.0153 | 0.0000 | ||||||||
| Tes31 | 1, 1, 0 | 204 | 228 | 204 | — | — | 0.1280 | 0.0199 | 0.1555 | |
| Tes33 | 7, 7, 1 | 524 | 639+ | 468 | ari | 0.0606 | 0.0056 | 0.1169 | 0.0047 | 0.0401 |
| moj | 0.0404 | 0.0022 | ||||||||
| Tes39 | 1, 1, 0 | 210 | 219 | 210 | — | — | 0.0682 | 0.0000 | 0.0000 | |
| Tes40 | 1, 1, 0 | 393 | 505+ | 393 | — | — | 0.1217 | 0.0033 | 0.0271 | |
| Tes41 | 1, 1, 0 | 384 | 510 | 384 | — | — | 0.1274 | 0.0101 | 0.0793 | |
| Tes100 | 7, 7, 1 | 507 | 168 | 168 | ari | 0.0000 | 0.0153 | 0.0423 | 0.0273 | 0.6453 |
| moj | 0.0353 | 0.0061 | ||||||||
| Tes101 | 7, 7, 1 | 293 | 387 | 153 | ari | 0.0114 | 0.0000 | 0.0327 | 0.0012 | 0.0373 |
| moj | 0.0000 | 0.0035 | ||||||||
| Tes104 | 7, 7, 1 | 726 | 738+ | 663 | ari | 0.0239 | 0.0016 | 0.0725 | 0.0006 | 0.0077 |
| moj | 0.0159 | 0.0000 | ||||||||
| Tes105 | 7, 7, 1 | 363 | 234 | 231 | ari | 0.0145 | 0.0047 | 0.0206 | 0.0066 | 0.3185 |
| moj | 0.0145 | 0.0047 | ||||||||
| Tes106 | 7, 7, 1 | 368 | 207 | 207 | ari | 0.0184 | 0.0050 | 0.1611 | 0.0062 | 0.0383 |
| moj | 0.0368 | 0.0050 | ||||||||
| Tes107 | 7, 7, 1 | 501 | 126 | 126 | ari | 0.0389 | 0.0000 | 0.0815 | 0.0000 | 0.0000 |
| moj | 0.0260 | 0.0000 | ||||||||
| Tes109 | 7, 6, 0 | 234 | 927+ | 228 | ari | 0.0290 | 0.0132 | 0.0346 | 0.0311 | 0.8992 |
| moj | 0.0000 | 0.0094 | ||||||||
| Tes110 | 7, 7, 1 | 826 | 399 | 390 | ari | 0.0085 | 0.0014 | 0.0765 | 0.0029 | 0.0382 |
| moj | 0.0000 | 0.0028 | ||||||||
| Tes112 | 5, 7, 0 | 428 | 276 | 273 | ari | 0.0153 | 0.0000 | 0.0417 | 0.0048 | 0.1145 |
| moj | 0.0325 | 0.0000 | ||||||||
| Tes113 | 7, 7, 0 | 335 | 624 | 282 | ari | 0.0065 | 0.0037 | 0.0512 | 0.0072 | 0.1412 |
| moj | 0.0194 | 0.0019 | ||||||||
| Tes114 | 2, 7, 1 | 250 | 132+ | 96 | ari | 0.0000 | 0.0000 | 0.0633 | 0.0000 | 0.0000 |
| moj | 0.0193 | 0.0000 | ||||||||
| Tes115 | 6, 7, 1 | 321 | 204 | 207 | ari | 0.0000 | 0.0054 | 0.0448 | 0.0166 | 0.3706 |
| moj | 0.0000 | 0.0025 | ||||||||
| Tes118 | 4, 6, 0 | 729 | 936+ | 555 | ari | 0.0089 | 0.0076 | 0.0367 | 0.0151 | 0.4114 |
| moj | 0.0142 | 0.0020 | ||||||||
| Tes120 | 1, 1, 0 | 363 | 423+ | 363 | — | — | 0.0958 | 0.0106 | 0.1106 | |
| Tes122 | 1, 1, 0 | 267 | 267+ | 267 | — | — | 0.0172 | 0.0146 | 0.8488 | |
| Tes123 | 1, 1, 0 | 486 | 621+ | 486 | — | — | 0.1574 | 0.0768 | 0.4879 | |
| Tes124 | 1, 1, 0 | 159 | 651+ | 159 | — | — | 0.0277 | 0.0000 | 0.0000 | |
| Tes127 | 1, 1, 0 | 285 | 309+ | 285 | — | — | 0.0452 | 0.0282 | 0.6239 | |
| Tes129 | 1, 1, 0 | 405 | 525 | 405 | — | — | 0.0109 | 0.0032 | 0.2936 | |
| Tes130 | 1, 1, 0 | 150 | 174 | 150 | — | — | 0.0905 | 0.0125 | 0.1381 | |
| Tes131 | 1, 1, 0 | 528 | 603+ | 528 | — | — | 0.0407 | 0.0176 | 0.4324 | |
| Tes133 | 1, 1, 0 | 333 | 414+ | 333 | — | — | 0.0650 | 0.0160 | 0.2462 | |
| Tes134 | 7, 7, 1 | 805 | 609 | 558 | ari | 0.0238 | 0.0010 | 0.0540 | 0.0103 | 0.1897 |
| moj | 0.0030 | 0.0039 | ||||||||
| Tes140 | 1, 1, 0 | 240 | 240 | 240 | — | — | 0.0881 | 0.0169 | 0.1918 | |
| Tes154 | 7, 7, 1 | 696 | 579+ | 507 | ari | 0.0033 | 0.0011 | 0.0439 | 0.0019 | 0.0426 |
| moj | 0.0263 | 0.0021 |
ari, D. arizonae; moj, D. mojavensis; θsyn, synonymous heterozygosity; θrep, replacement heterozygosity.
Number of alleles corresponding to D. arizonae, D. mojavensis, and D. mulleri, respectively.
Ratios with positive Ka and zero Ks are designated by Ka > Ks.
Statistical analysis of aligned sequences:
The DnaSP program (Rozas and Rozas 1999) was used for most of the population genetic analyses. Average levels of polymorphism or divergence for different groups of genes (e.g., Acp vs. testis enriched) refer to means weighted according to sequence length. For genes sampled for multiple alleles, replacement and synonymous divergence represent the average pairwise difference. Fixations for polarized McDonald-Kreitman tests were assigned using parsimony. Only codons with single mutations that could be clearly assigned to either the D. arizonae or D. mojavensis lineage were considered.
Lineage-specific synonymous and replacement divergences were estimated using the free-ratio maximum-likelihood model of the PAML computer program (Yang 1997). For most of these analyses we used one randomly selected allele from each of three species: D. arizonae, D. mojavensis, and D. mulleri. In some cases for which D. mulleri data were unavailable, we used a duplicated gene that predated the D. arizonae/D. mojavensis speciation event (B. J. Wagstaff, unpublished data). We used only duplicated genes showing synonymous divergence that was comparable to or less than the average D. mulleri synonymous divergence (see Table 3). Hypothesis testing was carried out using likelihood-ratio tests (Goldman and Yang 1994; Yang 1998). To determine whether or not Ka significantly exceeds Ks in a particular lineage, the likelihood value for the null hypothesis (Ka = Ks; i.e., the one-ratio model) was also calculated. Twice the log-likelihood difference between the two models is then compared to a χ2-distribution with one d.f. to determine the level of significance.
RESULTS
Content and characterization of D. mojavensis male reproductive tract libraries
The content and basic characteristics of the D. mojavensis male reproductive tract (ESTs 1–54) and testis (ESTs 100–217) libraries are listed in supplementary Table S1 (see http://www.genetics.org/supplemental). Genes with measured accessory gland or testis tissue enrichment are given the Acp and Tes prefixes, respectively. Six moj genes (moj9, moj29, moj30, moj32, moj137, and moj152; see supplementary Table S2, http://www.genetics.org/supplemental) are expressed in multiple tissues. No relative expression analyses were performed on genes corresponding to the remaining moj ESTs (see quantitative PCR section below).
Library content:
Minimal sequencing of the D. mojavensis male reproductive tract library revealed that most of the ESTs corresponded to just a few genes. Preliminary dot blot analysis of an initial set of clones revealed that most ESTs were accessory gland rather than testis derived. Of the first 139 sequenced clones, 35 corresponded to Acp1, 27 to Acp5, and 18 to Acp17. The 139 clones also contained 13 singletons and 10 transcripts represented by 2–9 clones each. The preponderance of Acp's in the reproductive tract library cannot be easily explained by size differences between accessory glands and testes, as D. mojavensis testes appear to be considerably larger than accessory glands (B. J. Wagstaff, personal observation). Thus, per unit of tissue, accessory glands likely produce much more mRNA than the testis. We conclude that the D. mojavensis accessory gland transcriptome has low complexity and high transcript abundance relative to that of the testis transcriptome. To increase the discovery rate of new transcripts, additional clones were screened by multiplexed PCR reactions that included primer pairs specific to Acp1, Acp5, and Acp17. Clones not corresponding to any of these three genes were then sequenced. This multiplex PCR strategy revealed 28 new ESTs from only 66 additional sequencing reactions. In total, 54 unique ESTs were revealed from the reproductive tract library. The average length of all 205 ESTs was 438 bp.
We constructed and screened a D. mojavensis testis cDNA library to increase our sample size of testis-expressed genes. The distribution of replicate ESTs differs dramatically from the original reproductive tract library (supplementary Table S1, http://www.genetics.org/supplemental). The testis library has a much higher complexity than the reproductive tract library, with 105 of 156 clones present as single-copy sequences. Similarly high complexity of a testis cDNA library was previously observed in D. melanogaster (Andrews et al. 2000), suggesting that this might be a general property of the Drosophila testis transcriptome. In total, 156 sequencing reactions returned an average EST length of 451 bp and produced 118 unique ESTs.
The whole reproductive tract library contains a higher percentage of unique ESTs with potential signal peptide sequences, which is to be expected of a library derived primarily from accessory gland transcripts (Wolfner et al. 1997; Swanson et al. 2001). Of library sequences subjected to SignalP analysis, 64% (32/50) of whole reproductive tract-derived unique sequences and 10.3% (7/68) of testis-derived unique sequences contain putative signal sequences (those with hidden Markov model P > 0.75, supplementary Table S1, http://www.genetics.org/supplemental).
Library quality:
Completeness of 5′ cDNA ends was assessed by two methods on a total of 155 ESTs. First, for transcripts represented by more than one clone, we compared the similarity of 5′ ends among clones, with the assumption that the longest clone is likely to include the complete 5′ end of a gene. Second, several transcripts were subjected to 5′ RACE verification. RACE analysis showed that all 20 of the Tes100 ESTs were truncated products, each ∼113 bp shorter than the reference 5′ sequence. Thus, Tes100 clones appear to be outliers in terms of assessment of library quality. Using the multiple-clone method, we estimate 79.7% (63/79) of our ESTs to be complete at the 5′ end. For ESTs compared to a reference 5′ RACE sequence, ∼62.5% (60/96) contain the complete 5′ end. However, removing the Tes100 outliers increases the estimate to 78.9% (60/76), a ratio that is consistent with the multiple-clone estimate. Therefore, our estimates suggest that approximately four-fifths of cDNA clones were complete at the 5′ end.
BLAST analyses vs. D. melanogaster:
Results of D. mojavensis EST BLAST analyses to D. melanogaster databases, including the closest-matching genes and secondary E-scores, are listed in supplementary Table S1 (http://www.genetics.org/supplemental; E < 0.01 was the BLAST score threshold for inclusion). None of the ESTs that failed to match D. melanogaster sequences matched any other NCBI database sequences. Approximately 61% (33/54) and 58% (68/118) of whole reproductive tract and testis library unique ESTs, respectively, showed BLAST similarity to D. melanogaster sequences. However, there were major differences between accessory gland- vs. testis-derived sequences, with Acp's showing a much lower level of conservation between species than testis-enriched genes. Only 33% (8/24) of Acp's generated significant hits, compared to 82% (27/33) for testis-enriched genes. A 2 × 2 contingency table is significantly heterogeneous (P ≪ 0.01). Furthermore, the median E-value of the eight Acp's with E < 0.01 (E = 1e-3, a value too high to reliably indicate orthology) is much greater than the median for testis-enriched genes (E = 2e-21). The six genes that are more ubiquitously expressed on the basis of quantitative PCR data (moj9, moj29, moj30, moj32, moj137, and moj152) had highly significant BLAST matches to D. melanogaster sequences (median E = 5e-42). The remaining moj sequences are similar to the testis-enriched genes, with 55% (59/108) returning E < 0.01 vs. D. melanogaster (median E = 1e-27). This is not surprising, given that most moj sequences are from the testis cDNA library.
Twenty of the 27 D. mojavensis testis-enriched genes that appear to have D. melanogaster homologs have BLAST hits to the D. melanogaster testis EST collection (Andrews et al. 2000), suggesting that testis expression patterns between species are generally conserved. Our quantitative PCR data from 6 of the remaining 7 genes isolated from the D. mojavensis testis library (see below) suggest that they too show testis-enriched expression in D. melanogaster in spite of their absence from the D. melanogaster testis EST collection, further supporting the notion for a generally conserved Drosophila testis transcriptome.
Certain biochemical functions, including proteases, protease inhibitors, and lipases, appear to be common in melanogaster subgroup Acp's, as inferred from sequence similarity to protein databases (Swanson et al. 2001). This is in contrast to our results from the 54 unique D. mojavensis reproductive tract ESTs (most of which are likely Acp's), which revealed evidence for two protease inhibitors, Acp36 and Acp48, and a single lipase gene, moj37. None of the predicted 54 proteins contain putative protease domains. The proportion of known D. mojavensis Acp's (2/24) that contain any of these three domains is significantly different from the proportion (21/57) from the Swanson et al. (2001) set of melanogaster subgroup Acp's (G-test, P = 0.026). This is suggestive of a fundamental, functional divergence in seminal fluid function in the two species, although more work, including direct biochemical assays, would be necessary to put this conclusion on firmer ground.
D. melanogaster-D. mojavensis orthology:
The existence of gene families and shared protein domains can yield small BLAST E-scores, yet obscure inferences regarding orthology between D. melanogaster and D. mojavensis. Alternatively, conserved intron-exon structure is expected for genes of shared ancestry (Meyer and Durbin 2004) but not for unrelated genes that share only a particular protein domain. For example, human-mouse orthologs have the same number of coding exons ∼86% of the time (Mouse Genome Sequencing Consortium 2002). Thus, genes showing conserved intron-exon structure and large E-score differences (e.g., E > 1e-10) between primary and secondary BLAST hits are probably orthologs.
Comparison of genomic sequence from our population genetic data to our EST sequences allowed us to determine intron-exon structure for a subset of D. mojavensis genes (i.e., genes from Table 1). We used this information in concert with comparisons of primary vs. secondary BLAST E-values and protein size, to investigate putative D. melanogaster orthologs for many of our D. mojavensis genes (indicated by an asterisk, supplementary Table S1; http://www.genetics.org/supplemental). For the remaining ESTs we have data only on primary vs. secondary BLAST E-values, many of which are suggestive of orthology.
Acp's:
Of the eight Acp's that show BLAST similarity to D. melanogaster genes (E < 0.01), only Acp36 and CG16713 (supplementary Table S1; http://www.genetics.org/supplemental) are likely orthologs. Both consist of 82 residues and possess a Kunitz domain that covers 59 of those residues. The aligned predicted proteins are 57.3% identical (47/82) and require no gaps. Although Acp36 also returns a significant BLAST hit to another protein with a Kunitz domain (CG16712), its amino acid sequence is more similar to CG16713. Three additional Acp's (Acp1, Acp2, and Acp25) are part of a gene family and are clearly homologous to the Acp53 gene family (Holloway and Begun 2004) in D. melanogaster (supplementary Table S1; http://www.genetics.org/supplemental). However, a protein distance tree clusters the three D. mojavensis genes together, rather than generating the three interspecific pairs expected under one-to-one orthology and homogeneous rates of protein evolution. Thus, although the proteins appear homologous, orthology is uncertain. The remaining Acp's show no compelling evidence for orthology for several reasons, including poor BLAST scores, radically different protein lengths or intron-exon organization, or very different expression patterns between species (described below).
Testis-enriched and moj genes from the population genetics survey:
Most testis-enriched and all six moj genes from the population genetics survey have clear D. melanogaster orthologs on the basis of primary and secondary BLAST E-scores and gene organizations inferred from comparison of cDNA and genomic sequence (supplementary Table S1; http://www.genetics.org/supplemental). However, there are some exceptions. Tes33 and Tes104 are part of an SCP-related gene family and have no obvious orthologs among the many D. melanogaster SCP-related genes. Tes114, Tes120, and Tes123, are also part of gene families that obscure interspecific relationships. Finally, Tes101 and Tes109 are too dissimilar to their D. melanogaster primary BLAST hits (E = 6e-03 and E = 7e-04, respectively) to conclude that they represent orthologous pairs.
Of the 41 genes in our quantitative PCR analyses (see below) that return significant BLAST matches to D. melanogaster sequences, only Tes14 and Tes118 correspond to putative unannotated genes. This supports the observation that the D. melanogaster genome annotation is of high quality (Misra et al. 2002; Drysdale 2003; Yandell et al. 2005). Details regarding Tes14, Tes118, and other data bearing on D. mojavensis-D. melanogaster orthology are presented as supplementary material (http://www.genetics.org/supplemental).
Relative quantification of D. mojavensis gene expression:
Supplementary Table S2 (http://www.genetics.org/supplemental) summarizes the expression quantification results for all D. mojavensis genes surveyed, as well as several D. melanogaster genes that are discussed in the next section. Of the 58 total D. mojavensis genes selected for quantitative PCR, 19 are expressed primarily in the accessory glands, 33 are expressed primarily in the testis, and the remaining six (moj9, moj29, moj30, moj32, moj137, and moj152) are more evenly expressed, as indicated by
Figure 2 depicts the relationship between ΔCT and
![Correlation between absolute levels of expression and degree of tissue specificity. The more tissue-specific genes (high $\batchmode \documentclass[fleqn,10pt,legalpaper]{article} \usepackage{amssymb} \usepackage{amsfonts} \usepackage{amsmath} \pagestyle{empty} \begin{document} \(2^{{-}\mathrm{{\Delta}{\Delta}}C_{\mathrm{T}}}\) \end{document}$) also tend to show higher absolute levels of expression (low ΔCT). Testis-enriched genes are indicated by solid diamonds, Acp's by open triangles, and moj genes by open circles.](https://oup.silverchair-cdn.com/oup/backfile/Content_public/Journal/genetics/171/3/10.1534_genetics.105.043372/4/m_1083fig2.jpeg?Expires=1716408727&Signature=OBR91M4Z7O8CvgXg1fus~26mIA4Kg3W2PxhM0rUFBP1WVpaKQ1-SJyEIfK5QvXf0c-dT4h3jwdU470hj-1S2EUMHqAK5LJazEl3nRUjOcaR2aO4~~yOWuBpUUU6OFr1ZmgodG5pYGf~FsFuatk7aIs37rA0lcMMgPzT1Lwx8hvZ28dDwOG~L3XntinVv9aqS4veOPzHVHuPd7F9PjzlFwsRerfyF8w~ISFdoWk9lUX9oEtk2NSRlwt7HjbEBosfFTYBkup1B3ASUWOD0jVbSvOKlU~wVSyZCcW1TAxLgOBr5qNbrAqicinLRHOLFSLLVLUzjELZHCNZpneyATLCMCg__&Key-Pair-Id=APKAIE5G5CRDK6RD3PGA)
Correlation between absolute levels of expression and degree of tissue specificity. The more tissue-specific genes (high
Comparison of D. melanogaster and D. mojavensis expression patterns:
Our quantitative PCR data suggest that putative orthologs of D. mojavensis testis-enriched genes are also testis enriched in D. melanogaster. Nevertheless, the relative amount of testis specificity varies across genes. At the most extreme, D. melanogaster CG3708 is ∼164-fold more testis specific than Tes129. There are also large fold differences between Tes106/CG30334 (97-fold), Tes110/CG15219 (24-fold), and Tes127/CG10090 (53-fold). These comparisons reflect significant differences between D. mojavensis-D. melanogaster expression profiles at these genes (P < 0.05). Several additional testis-enriched genes are borderline significant with fold differences >5. These conclusions are all based on the premise that the housekeeping ribosomal protein gene used as an internal standard has not evolved substantial gene expression differences in D. melanogaster vs. D. mojavensis. Moreover, fold differences can be dramatically different between orthologous pairs solely because of regulatory changes in the secondary tissue and, as such, misrepresent actual differences between species in primary tissues. In this sense, ΔCT scores are more revealing because they are correlated with absolute expression levels. Five moj and eight Tes orthologous gene pairs have sizable differences between ΔCT scores (>4), with Tes124-CG14079 at the most extreme (11.35) (supplementary Table S2; http://www.genetics.org/supplemental). Because of the uncertainty associated with housekeeping gene regulation and primer efficiency (see materials and methods), strong, individual gene pairwise D. melanogaster vs. D. mojavensis conclusions are not warranted beyond the rank order of tissue enrichment. However, these data suggest that there have been gene regulation changes between lineages. Further discussion of expression differences between individual D. melanogaster-D. mojavensis pairs can be found in the supplementary material (http://www.genetics.org/supplemental).
Genome-wide assays of expression differences between melanogaster subgroup species suggest that male-biased genes show greater interspecific expression differences compared to other genes (Meiklejohn et al. 2003; Ranz et al. 2003; Rifkin et al. 2003). Our data, although consistent with these reports, suggest that despite rapid evolution of male-biased expression, wholesale shifts in tissue specificity are uncommon. A potential caveat is that the apparent interspecific conservation of tissue specificity could be inflated by the fact that we focused on genes coding for more highly conserved proteins. If more highly conserved orthologs are less likely to change tissue specificity, then we have clearly underestimated the frequency of such changes. Comparative genomic analyses of more highly diverged orthologous genes will help address this question (Wagstaff and Begun 2005).
Molecular population genetics analysis
We surveyed a total of 56 genes (19 Acp's, 31 testis enriched, and 6 ubiquitously expressed) for our molecular population genetics analysis (see Table 1). Up to seven lines each of D. arizonae and D. mojavensis were analyzed for several genes. However, many genes are represented by only a single allele each from D. arizonae and D. mojavensis. A D. mulleri allele was sequenced whenever possible as an outgroup. An average of 9.3 alleles and 376 bp were sequenced for each gene surveyed.
Evidence of D. m. baja-D. m. mojavensis population substructure:
Our D. mojavensis data consist of up to four alleles of D. m. baja and three alleles of D. m. mojavensis from various locations of Baja, Mexico and southern California, respectively. Supplementary Table S3 (http://www.genetics.org/supplemental) shows our analysis of population substructure between D. m. baja and D. m. mojavensis. We use the fixation index, FST, to estimate genetic differentiation between subspecies. The small size of most surveyed regions and the small number of alleles make inferences from individual genes unreliable. A more accurate view of differentiation can be obtained by examining average FST-values, weighted according to sequence length. The average for all genes is 0.150, with the Acp subset of genes slightly higher at 0.168. These results are within the observed range for genetic differentiation between African and non-African D. melanogaster populations (Caracristi and Schlötterer 2003; Baudry et al. 2004). Acp7 appeared to be something of an outlier with estimated FST of 0.864. Therefore, we included additional D. m. baja (n = 5) and D. m. mojavensis (n = 7) Acp7 alleles to the analysis. Our revised estimate showed that differentiation (FST = 0.429) at this locus, although at the high end compared to most loci, was not an obvious outlier.
We also investigate genetic differentiation by estimating divergence between subspecies (Ka and Ks) and comparing those values to nucleotide diversity (π) within subspecies (supplementary Table S3; http://www.genetics.org/supplemental). Since both measurements represent the probability that a particular nucleotide site drawn from two individuals is different, they can be directly compared. Again, our analysis shows some evidence of population substructure. Averaged across all genes, Ka (0.006) is higher than both replacement D. m. baja (0.005) and D. m. mojavensis (0.004) nucleotide diversities. However, there are no significant differences between sets of Ka and replacement π measurements (Mann-Whitney U-test, P = 0.77 and P = 0.41 for D. m. baja and D. m. mojavensis, respectively). There is also no evidence for differentiation at synonymous sites, with D. m. baja synonymous π at 0.016, Ks at 0.015, and D. m. mojavensis synonymous π at 0.013.
Given these results, we do not distinguish between D. m. baja and D. m. mojavensis alleles in our population genetics analyses. Although our estimates of polymorphism may be slightly inflated relative to those measured from a single population, our tests of adaptive evolution compare nucleotide substitution patterns at synonymous vs. replacement sites. Under neutrality, population substructure is expected to have little effect on rejecting the null in the direction of adaptive protein evolution.
Levels of synonymous and replacement polymorphism and divergence:
Summary statistics for heterozygosity and divergence for individual genes and for gene categories are presented in Tables 1–3. As suggested by previously published molecular population genetics data from these species (e.g., Begun 1997; Begun and Whitley 2002; Matzkin and Eanes 2003), they are highly variable (Table 1). Average synonymous heterozygosities for D. mojavensis and D. arizonae are 0.0181 and 0.0170, respectively (Table 2). Synonymous heterozygosity for D. mojavensis and D. arizonae is marginally lower for Acp's (0.0156 and 0.0135, respectively) compared to testis-enriched genes (0.0170 and 0.0175, respectively). Synonymous divergence between D. arizonae and D. mojavensis is similar across gene categories as well (Table 2, but see the polarized analysis below for between-species differences). Testis-enriched genes are the most divergent at 0.0682, followed by Acp's at 0.0643 and moj genes at 0.0518. None of the variation statistics are significantly different between gene classes or species by Mann-Whitney U-tests.
Polymorphism and divergence of gene classes
Polymorphism | Divergencea | ||||||
|---|---|---|---|---|---|---|---|
| Gene class | Sample | θsyn | θrep | θrep/θsyn | Ks | Ka | Ka/Ks |
| Acp's | ari | 0.0135 | 0.0066 | 0.4866 | 0.0643 | 0.0595 | 0.9257 |
| moj | 0.0156 | 0.0093 | 0.5991 | ||||
| Tes | ari | 0.0175 | 0.0037 | 0.2095 | 0.0682 | 0.0128 | 0.1873 |
| moj | 0.0170 | 0.0025 | 0.1476 | ||||
| moj | ari | 0.0292 | 0.0045 | 0.1553 | 0.0518 | 0.0060 | 0.1164 |
| moj | 0.0346 | 0.0045 | 0.1308 | ||||
| All genes | ari | 0.0170 | 0.0049 | 0.2851 | 0.0650 | 0.0250 | 0.3842 |
| moj | 0.0181 | 0.0053 | 0.2935 | ||||
| sim Acp'sb | 0.0280 | 0.0074 | 0.2643 | 0.1170 | 0.0497 | 0.4248 | |
| sim 3Rb | 0.0350 | 0.0013 | 0.0371 | 0.1080 | 0.0107 | 0.0991 | |
D. simulans genes divergence estimates are with respect to D. melanogaster.
Data are from Begun et al. (2000).
Patterns for replacement variation are quite different. First, mean replacement heterozygosity of Acp's in both species is greater than that of testis-enriched or moj genes (Table 2). This is especially striking for Acp vs. testis-enriched genes of D. mojavensis, with Acp's ∼3.7 times more variable than testis-enriched genes in D. mojavensis compared to 1.8 times more variable than testis-enriched genes in D. arizonae. D. mojavensis Acp's have the highest ratio of replacement to synonymous heterozygosity (0.5991), followed by D. arizonae Acp's at 0.4866 (Table 2). This observation is not attributable to population substructure in D. mojavensis, as the ratios of replacement to synonymous Acp nucleotide diversity (π) are 0.6429 and 0.6667 in D. m. baja and D. m. mojavensis, respectively (see supplementary Table S3; http://www.genetics.org/supplemental). The ratios of replacement to synonymous heterozygosity for testis-enriched genes (D. arizonae, 0.2095; D. mojavensis, 0.1476) and moj genes (D. arizonae, 0.1553; D. mojavensis, 0.1308) are much lower in both species. Average Acp replacement divergence between D. arizonae and D. mojavensis is also considerably higher (0.0595) than that observed at testis-enriched (0.0128) or moj genes (0.0060). The ratio of replacement to synonymous divergence for Acp's (0.9257) is 4.9 times greater than the corresponding Tes genes ratio (0.1873). Six genes, all Acp's, have Ka/Ks > 1 (Table 1). Several other pairwise Acp divergence estimates revealed unusually high Ka/Ks values (i.e., >0.5). In contrast, the highest Ka/Ks ratio among nonpolarized Tes and moj genes is 0.8992 for Tes109, with that of most genes being considerably lower (i.e., <0.5). A survey of Acp polymorphism and divergence in D. simulans and D. melanogaster also suggested that these genes evolve unusually quickly at replacement sites relative to other genes (Begun et al. 2000). However, the relative amount of replacement to synonymous variation at Acp's in D. arizonae and D. mojavensis is much greater than that observed in D. simulans and D. melanogaster. For example, the ratio of replacement to synonymous polymorphism for desert Drosophila Acp's (0.5991 for D. mojavensis, 0.4866 for D. arizonae; Table 2) is about twofold greater than the corresponding ratio in D. simulans (0.2643). The same is true for replacement to synonymous divergence—the Ka/Ks ratio for desert Drosophila (0.9257) is more than twofold greater than the Ka/Ks ratio for D. melanogaster/D. simulans (0.4248). Thus, levels of both protein polymorphism and divergence are considerably greater at Acp's in D. arizonae/D. mojavensis than in D. melanogaster/D. simulans. Although ratios of replacement to silent Acp polymorphism appear to be heterogeneous across melanogaster subgroup species (Begun et al. 2000; Kern et al. 2004), we observed no such heterogeneity for D. mojavensis vs. D. arizonae Acp polymorphism (see Table 6; G-test, P = 0.574).
Polarized divergence:
The divergence estimates presented in Tables 1 and 2 result from pairwise comparisons and so provide no insight into evolution along the D. arizonae vs. D. mojavensis lineage. We investigated evolution along these two lineages using both parsimony and likelihood-based approaches. Table 3 shows the results for all genes for which an outgroup sequence was available. As one might expect from previous analyses, the rank order of Ka/Ks ratios is Acp > Tes > moj in each of the three lineages. Eight of nine Acp's have Ka/Ks > 1 in at least one of the three lineages in polarized analyses (Table 3). Tes genes contain just two examples of Ka/Ks > 1, Tes105 along the D. mojavensis lineage and Tes114 along the D. mulleri lineage. In each case, however, Ka/Ks > 1 is largely due to negligible Ks divergence (zero in both cases) rather than unusually rapid protein divergence. Ka/Ks ratios for polarized Acp's vs. Tes genes are highly significantly different (Mann-Whitney U-test, P ≪ 0.01).
Polarized D. arizonae vs. D. mojavensis divergence
D. arizonae | D. mojavensis | Outgroup | ||||||||
|---|---|---|---|---|---|---|---|---|---|---|
| Gene/group | Ka | Ks | Ka/Ks | Ka | Ks | Ka/Ks | Ka | Ks | Ka/Ks | Outgroup? |
| Acp1 | 0.0226 | 0.0139 | 1.6269 | 0.0480 | 0.0406 | 1.1808 | 0.1429 | 0.1616 | 0.8839 | D. mulleri |
| Acp2 | 0.0366 | 0.0221 | 1.6559 | 0.0247 | 0.0300 | 0.8232 | 0.1513 | 0.2932 | 0.5160 | D. mulleri |
| Acp5a | 0.0714 | 0.0962 | 0.7426 | 0.0391 | 0.0000 | Ka > Ks | — | — | — | 5b duplicate |
| Acp7 | 0.0159 | 0.0245 | 0.6483 | 0.0275 | 0.0000 | Ka > Ksa | 0.2560 | 0.1200 | 2.1337 | D. mulleri |
| Acp16a | 0.0095 | 0.0244 | 0.3868 | 0.1538 | 0.0169 | 9.1017a | — | — | — | 16c duplicate |
| Acp16b | 0.0406 | 0.0396 | 1.0248 | 0.0000 | 0.0000 | — | — | — | — | 16a duplicate |
| Acp19 | 0.0184 | 0.0167 | 1.0981 | 0.0163 | 0.0000 | Ka > Ks | 0.0953 | 0.0842 | 1.1313 | D. mulleri |
| Acp25 | 0.0125 | 0.0458 | 0.2732 | 0.0207 | 0.0250 | 0.8265 | 0.1627 | 0.4233 | 0.3842 | D. mulleri |
| Acp27a | 0.0144 | 0.0000 | Ka > Ks | 0.0000 | 0.0134 | 0.0001 | — | — | — | 27b duplicate |
| moj9 | 0.0029 | 0.0440 | 0.0653 | 0.0000 | 0.0298 | 0.0001 | 0.0145 | 0.0955 | 0.1516 | D. mulleri |
| moj30 | 0.0000 | 0.0336 | 0.0001 | 0.0027 | 0.0498 | 0.0540 | 0.0109 | 0.1928 | 0.0564 | D. mulleri |
| Tes14 | 0.0000 | 0.0152 | 0.0001 | 0.0000 | 0.0000 | — | 0.0186 | 0.1485 | 0.1254 | D. mulleri |
| Tes33 | 0.0028 | 0.1064 | 0.0259 | 0.0028 | 0.0492 | 0.0574 | 0.0084 | 0.2142 | 0.0391 | D. mulleri |
| Tes100 | 0.0000 | 0.0430 | 0.0001 | 0.0141 | 0.0420 | 0.3365 | 0.0219 | 0.2624 | 0.0836 | D. mulleri |
| Tes101 | 0.0000 | 0.0000 | — | 0.0000 | 0.0191 | 0.0001 | 0.0102 | 0.0859 | 0.1191 | D. mulleri |
| Tes104 | 0.0000 | 0.0302 | 0.0001 | 0.0000 | 0.0327 | 0.0001 | 0.0125 | 0.1529 | 0.0817 | D. mulleri |
| Tes105 | 0.0000 | 0.0000 | 0.0000 | 0.0060 | 0.0000 | Ka > Ks | 0.0305 | 0.2418 | 0.1259 | D. mulleri |
| Tes106 | 0.0122 | 0.1532 | 0.0796 | 0.0000 | 0.0192 | 0.0001 | 0.0060 | 0.3648 | 0.0165 | D. mulleri |
| Tes107 | 0.0000 | 0.0181 | 0.0001 | 0.0000 | 0.0179 | 0.0001 | 0.0000 | 0.0832 | 0.0001 | D. mulleri |
| Tes110 | 0.0000 | 0.0000 | — | 0.0035 | 0.0630 | 0.0548 | 0.0139 | 0.0640 | 0.2173 | D. mulleri |
| Tes114 | 0.0000 | 0.0611 | 0.0001 | 0.0000 | 0.0000 | — | 0.0264 | 0.0000 | Ka > Ks | D. mulleri |
| Tes115 | 0.0162 | 0.0164 | 0.9889 | 0.0058 | 0.0166 | 0.3508 | 0.0702 | 0.0880 | 0.7979 | D. mulleri |
| Tes134 | 0.0023 | 0.0356 | 0.0649 | 0.0098 | 0.0354 | 0.2760 | 0.0474 | 0.1407 | 0.3367 | D. mulleri |
| Tes154 | 0.0000 | 0.0251 | 0.0001 | 0.0000 | 0.0233 | 0.0001 | 0.0082 | 0.1278 | 0.0640 | D. mulleri |
| All Acp's | 0.0220 | 0.0253 | 0.8715 | 0.0273 | 0.0131 | 2.0776 | 0.1525 | 0.1798 | 0.8484 | D. mulleri |
| All Tes | 0.0020 | 0.0345 | 0.0578 | 0.0034 | 0.0306 | 0.1096 | 0.0199 | 0.1501 | 0.1326 | D. mulleri |
| All moj | 0.0014 | 0.0348 | 0.0407 | 0.0014 | 0.0382 | 0.0375 | 0.0130 | 0.1364 | 0.0951 | D. mulleri |
Ka/Ks ratios significantly >1 (P < 0.05). Ratios with positive Ka and zero Ks are designated by Ka > Ks.
The D. mojavensis lineage has a considerably greater average Acp Ka/Ks ratio than either the D. arizonae or D. mulleri lineage. Across all nine Acp's, the Ka/Ks ratio for D. mojavensis (2.0776) is 2.4 times greater than the ratio for D. arizonae (0.8715). Although Acp replacement divergence is higher in D. mojavensis (0.0273) than in D. arizonae (0.0220), the much lower Ks in D. mojavensis vs. D. arizonae Acp's makes a significant contribution to the higher D. mojavensis Acp Ka/Ks ratio. One possible reason for the low D. mojavensis Ks relative to the D. arizonae Ks could be different intensities of selection for codon bias between lineages. However, our estimates of effective number of codons (ENC) (Wright 1990) show no major differences between lineages. The average ENCs for D. mojavensis Acp's and testis-enriched genes, weighted according to size, are 51.8 and 50.8, respectively. The corresponding values for D. arizonae are 50.7 and 51.6, respectively. Thus, codon bias of D. mojavensis Acp's is actually slightly lower than that of D. arizonae Acp's, contrary to expectations if stronger selection at synonymous sites in D. mojavensis were contributing to the lower D. mojavensis Ks values.
Unfortunately, we have D. mulleri data from only five Acp's (Table 3). This limits our ability to directly compare Acp Ka/Ks across the three lineages in a comparable set of analyses. For these five genes the Ka/Ks average ratio is similar for D. arizonae and D. mulleri (0.8273 and 0.8484, respectively), while the D. mojavensis Ka/Ks ratio (1.7163) is roughly twofold greater. Note that the D. mulleri data are potentially biased because genes that are evolving more quickly would tend to be underrepresented as a result of PCR failure using primers designed from D. mojavensis sequence.
Two Acp's, Acp7 and Acp16a, have Ka/Ks significantly >1 in the D. mojavensis lineage, while neither gene is significant in the D. arizonae lineage. The significant Ka/Ks for D. mojavensis Acp7 reflects a contribution from low synonymous divergence (0.0000), as replacement divergence is similar in D. mojavensis (0.0275) to the Acp mean (0.0273) for the D. mojavensis lineage (Table 3). On the other hand, the high Ka/Ks ratio for D. mojavensis Acp16a is primarily attributable to the atypically high replacement divergence (0.1538) relative to the lineage mean (0.0273). D. mulleri provides a solitary example, Acp7, of Ka/Ks significantly >1 (P < 0.05).
Joint analysis of polymorphism and divergence:
The neutral theory of molecular evolution predicts that the ratio of replacement to synonymous substitutions should be similar to the ratio of replacement to synonymous polymorphisms (Kimura 1983). The McDonald-Kreitman (MK) test uses a 2 × 2 contingency table to detect differences in these ratios (McDonald and Kreitman 1991). Table 4 shows the polymorphism and fixation data for individual genes at synonymous and replacement sites. For cases in which an outgroup sequence was available (outgroups identical to those in Table 3), fixed differences between D. arizonae and D. mojavensis were polarized using parsimony. None of the 54 tests are significant after Bonferroni correction of critical values. The small sizes and large number of genes motivate analysis of pooled data (Table 5). The 2 × 2 table for Acp's is significantly heterogeneous in a direction consistent with adaptive protein evolution and remains marginally significant if Acp25 (the single Acp with P < 0.05) is removed from the analysis. Another individual gene that warrants mention is Acp48. With a total of 60 mutations to contribute to the 2 × 2 contingency table, one might speculate that it has a major effect on the overall conclusion. However, removing the Acp48 data increases the significance of the heterogeneity of the remaining Acp's. Overall, the analysis of pooled polymorphic and fixed mutations supports the notion that directional selection plays a role in accessory gland protein divergence. Data from testis-enriched and moj genes show no significant deviations from neutral expectation in 2 × 2 contingency tables.
Individual gene MK tests
Polymorphic | Fixed | ||||
|---|---|---|---|---|---|
| Gene | Syn | Repl | Syn | Repl | Pa |
| Acp1 | 5 | 10 | 1 | 10 | 0.130 |
| arizonae | 0 | 7 | 1 | 3 | 0.364 |
| mojavensis | 5 | 3 | 0 | 6 | 0.031* |
| Acp2 | 6 | 8 | 1 | 8 | 0.090 |
| arizonae | 3 | 0 | 0 | 5 | 0.018* |
| mojavensis | 3 | 8 | 0 | 2 | 1.000 |
| Acp3 | 3 | 5 | 2 | 6 | 0.589 |
| arizonae | 3 | 1 | — | — | — |
| mojavensis | 0 | 4 | — | — | — |
| Acp5a | 1 | 4 | 3 | 6 | 0.590 |
| arizonae | 1 | 1 | 3 | 3 | 1.000 |
| mojavensis | 0 | 3 | 0 | 2 | — |
| Acp7 | 8 | 14 | 4 | 7 | 1.000 |
| arizonae | 6 | 7 | 2 | 3 | 0.813 |
| mojavensis | 2 | 7 | 0 | 3 | 1.000 |
| Acp8 | 2 | 8 | 4 | 8 | 0.481 |
| arizonae | 1 | 4 | — | — | — |
| mojavensis | 1 | 4 | — | — | — |
| Acp16a | 0 | 11 | 2 | 7 | 0.189 |
| arizonae | 0 | 4 | 1 | 1 | 0.333 |
| mojavensis | 0 | 7 | 1 | 4 | 0.417 |
| Acp16b | 6 | 9 | 1 | 6 | 0.207 |
| arizonae | 3 | 7 | 1 | 4 | 0.675 |
| mojavensis | 3 | 2 | 0 | 0 | — |
| Acp19 | 5 | 7 | 2 | 11 | 0.139 |
| arizonae | 3 | 4 | 2 | 7 | 0.377 |
| mojavensis | 3 | 3 | 0 | 4 | 0.200 |
| Acp21a | 1 | 11 | 2 | 21 | 0.971 |
| arizonae | 1 | 2 | — | — | — |
| mojavensis | 1 | 9 | — | — | — |
| Acp24 | 2 | 6 | 1 | 1 | 0.504 |
| arizonae | 0 | 2 | — | — | — |
| mojavensis | 2 | 4 | — | — | — |
| Acp25 | 8 | 2 | 2 | 6 | 0.017* |
| arizonae | 6 | 1 | 1 | 2 | 0.103 |
| mojavensis | 3 | 1 | 1 | 3 | 0.148 |
| Acp27a | 2 | 5 | 0 | 1 | 1.000 |
| arizonae | 0 | 1 | 0 | 1 | — |
| mojavensis | 2 | 4 | 0 | 0 | — |
| Acp42 | 7 | 6 | 3 | 11 | 0.078 |
| arizonae | 2 | 3 | — | — | — |
| mojavensis | 5 | 3 | — | — | — |
| Acp48 | 7 | 9 | 14 | 30 | 0.396 |
| arizonae | 2 | 4 | — | — | — |
| mojavensis | 5 | 5 | — | — | — |
| moj9 | 12 | 6 | 3 | 0 | 0.526 |
| arizonae | 6 | 4 | 1 | 0 | 1.000 |
| mojavensis | 6 | 2 | 1 | 0 | 1.000 |
| moj30 | 21 | 10 | 3 | 0 | 0.539 |
| arizonae | 10 | 4 | 1 | 0 | 1.000 |
| mojavensis | 13 | 6 | 2 | 0 | 1.000 |
| Tes14 | 3 | 0 | 0 | 0 | — |
| arizonae | 1 | 0 | 0 | 0 | — |
| mojavensis | 2 | 0 | 0 | 0 | — |
| Tes33 | 24 | 7 | 3 | 0 | 0.589 |
| arizonae | 15 | 5 | 1 | 0 | 1.000 |
| mojavensis | 10 | 2 | 2 | 0 | 1.000 |
| Tes100 | 3 | 7 | 1 | 1 | 0.592 |
| arizonae | 0 | 5 | 1 | 0 | — |
| mojavensis | 3 | 2 | 0 | 1 | — |
| Tes101 | 1 | 1 | 1 | 0 | — |
| arizonae | 1 | 0 | 0 | 0 | — |
| mojavensis | 0 | 1 | 1 | 0 | — |
| Tes104 | 14 | 2 | 7 | 0 | 0.557 |
| arizonae | 9 | 2 | 3 | 0 | 1.000 |
| mojavensis | 6 | 0 | 4 | 0 | — |
| Tes105 | 4 | 4 | 0 | 0 | — |
| arizonae | 2 | 2 | 0 | 0 | — |
| mojavensis | 2 | 2 | 0 | 0 | — |
| Tes106 | 6 | 4 | 5 | 0 | 0.231 |
| arizonae | 2 | 2 | 3 | 0 | 0.429 |
| mojavensis | 4 | 2 | 2 | 0 | 1.000 |
| Tes107 | 5 | 0 | 1 | 0 | — |
| arizonae | 3 | 0 | 0 | 0 | — |
| mojavensis | 2 | 0 | 1 | 0 | — |
| Tes109 | 3 | 10 | 1 | 4 | 0.887 |
| arizonae | 3 | 6 | — | — | — |
| mojavensis | 0 | 4 | — | — | — |
| Tes110 | 2 | 3 | 6 | 0 | 0.061 |
| arizonae | 2 | 1 | 0 | 0 | — |
| mojavensis | 0 | 2 | 6 | 0 | — |
| Tes112 | 7 | 0 | 0 | 1 | — |
| arizonae | 2 | 0 | — | — | — |
| mojavensis | 5 | 0 | — | — | — |
| Tes113 | 3 | 3 | 2 | 1 | 0.633 |
| arizonae | 1 | 2 | — | — | — |
| mojavensis | 3 | 1 | — | — | — |
| Tes114 | 1 | 0 | 1 | 0 | — |
| arizonae | 0 | 0 | 1 | 0 | — |
| mojavensis | 1 | 0 | 0 | 0 | — |
| Tes115 | 0 | 3 | 2 | 2 | 0.429 |
| arizonae | 0 | 2 | 1 | 1 | — |
| mojavensis | 0 | 1 | 1 | 1 | — |
| Tes118 | 6 | 8 | 2 | 4 | 0.688 |
| arizonae | 2 | 6 | — | — | — |
| mojavensis | 4 | 2 | — | — | — |
| Tes134 | 9 | 5 | 5 | 2 | 0.742 |
| arizonae | 8 | 1 | 2 | 0 | 1.000 |
| mojavensis | 1 | 4 | 3 | 2 | 0.189 |
| Tes154 | 9 | 3 | 4 | 0 | 0.529 |
| arizonae | 1 | 1 | 2 | 0 | — |
| mojavensis | 8 | 2 | 1 | 0 | 1.000 |
Syn, synonomous; Repl, replacement.
P-values are from G-tests; Fisher's exact test is used when zero values are present. An asterisk indicates a significant result (P < 0.05). Tests were not carried out for loci with very few observations.
MK tests for gene classes
Synonymous | Replacement | Probability | |
|---|---|---|---|
| moj genes | |||
| Polymorphic (ari:moj) | 33 (16:19) | 16 (8:8) | Fisher's exact test: |
| Fixed | 6 | 0 | P = 0.165 |
| All testis-enriched genes | |||
| Polymorphic (ari:moj) | 100 (52:51) | 60 (35:25) | G = 2.162 |
| Fixed | 41 | 15 | P = 0.142 |
| All Acp's | |||
| Polymorphic (ari:moj) | 63 (31:35) | 115 (48:67) | G = 6.474 |
| Fixed | 42 | 139 | P = 0.011 |
| All Acp's except Acp25 | |||
| Polymorphic (ari:moj) | 55 (25:32) | 113 (47:66) | G = 3.91 |
| Fixed | 40 | 133 | P = 0.047 |
Probability is determined by a G-test when all cells contain nonzero values; Fisher's exact test is shown otherwise. Individual species polymorphisms are included in parentheses (which are not guaranteed to add up to the total number of polymorphisms since polymorphic sites can overlap).
Further evidence for different evolutionary processes among gene classes can be found in the ratios of replacement fixations to polymorphisms (Tables 4 and 5). While a total of seven Acp's have more replacement fixations than polymorphisms, no Tes or moj genes do, with the exception of Tes112, which has no replacement polymorphisms and just a single fixation. The ratio of fixed to polymorphic replacement mutations for Acp's (139:115) is highly significantly different from the ratio for testis-enriched genes (15:60; G-test, P ≪ 0.01), a result that cannot be explained by different neutral mutation rates for the two protein classes. The moj genes ratio (0:16) is more testis-like, although with so few data, strong conclusions are unwarranted.
Polarized McDonald-Kreitman analyses:
Investigation of polarized fixations provides more insight into evolutionary process in the D. arizonae vs. D. mojavensis lineages, although at a cost of reduced number of loci and substitutions included in the analysis (numbers of polarized vs. nonpolarized individual gene tests are 9:15, 13:17, and 2:2 for Acp's, Tes genes, and moj genes, respectively). The data for different gene classes, polarized using parsimony, are presented in Table 6. D. mojavensis Acp's show a highly significant (P = 0.004) deviation from neutral expectations. It is formally possible that the D. mojavensis data could be explained by too few silent fixations. However, such an explanation would require a change in silent neutral mutation at precisely the correct moment in time. Moreover, since the ratio of silent to replacement substitutions is similar in the two lineages in other gene categories, this explanation would require a bizarre perturbation of silent neutral mutation rate only in Acp's, which seems highly improbable. Thus, the D. mojavensis Acp data are more easily interpreted as a large excess of replacement fixations. Interestingly, however, the D. arizonae Acp data are not significantly heterogeneous (P = 0.181). The lineage differences in polarized MK tests, which are consistent with the greater Ka/Ks ratio in D. mojavensis Acp's noted earlier, support the idea that directional selection has greater effects on Acp divergence in D. mojavensis than in D. arizonae. Note that the number of fixed replacement vs. synonymous mutations (24:2) in D. mojavensis corresponds to a Ka/Ks ratio for fixed sites of ∼4 (assuming a ratio of replacement to silent sites of ∼3:1), providing additional support for the interpretation that the 2 × 2 table for D. mojavensis Acp's can plausibly be explained only by adaptive protein evolution. Polarized data from moj genes in both lineages and testis-enriched genes in D. mojavensis are not significantly heterogeneous. Data from D. arizonae testis-enriched genes are marginally significant (Fisher's exact test, P = 0.056; G-test, P = 0.026), but not in the direction of excess replacement fixations. Additional population genetic data will be required to investigate this pattern.
Polarized MK tests for gene classes
Synonymous | Replacement | Probability | |
|---|---|---|---|
| D. mojavensis moj genes | |||
| Polymorphic | 19 | 8 | Fisher's exact test: |
| Fixed | 3 | 0 | P = 0.545 |
| D. mojavensis testis-enriched genes | |||
| Polymorphic | 39 | 18 | G = 2.295 |
| Fixed | 21 | 4 | P = 0.130 |
| D. mojavensis Acp's | |||
| Polymorphic | 21 | 38 | G = 8.329 |
| Fixed | 2 | 24 | P = 0.004 |
| D. arizonae moj genes | |||
| Polymorphic | 16 | 8 | Fisher's exact test: |
| Fixed | 2 | 0 | P = 0.557 |
| D. arizonae testis-enriched genes | |||
| Polymorphic | 44 | 21 | G = 4.967 |
| Fixed | 14 | 1 | P = 0.026 |
| D. arizonae Acp's | |||
| Polymorphic | 22 | 32 | G = 1.792 |
| Fixed | 11 | 29 | P = 0.181 |
Probability is determined by a G-test when all cells contain nonzero values; Fisher's exact test is shown otherwise.
DISCUSSION
Population genetic investigation of accessory gland protein genes has previously focused on D. melanogaster and D. simulans (Aguadé 1997, 1998, 1999; Tsaur and Wu 1997; Tsaur et al. 1998; Begun et al. 2000; Swanson et al. 2001; Kern et al. 2004). Our study of Acp's and testis-enriched genes of desert Drosophila from the repleta group was motivated by our interest in understanding whether the highly diverged mating system of these flies (relative to D. melanogaster and D. simulans) is associated with different population genetic patterns and mechanisms for male reproduction-related genes. This question may be especially germane to the issue of Acp's (rather than testis-enriched genes).
Desert Drosophila from the repleta group remate much more frequently than do D. melanogaster or D. simulans, opening up the possibility for stronger or fundamentally different selection on male-male and male-female interactions in the repleta group. Previous results from within- and between-species matings of desert Drosophila (Patterson and Stone 1952; Knowles and Markow 2001; Pitnick et al. 2003) support the idea of rapid evolution of ejaculate-female interactions. The fact that D. mojavensis males make detectable postmating donations to females whereas D. melanogaster and D. simulans do not (Markow and Ankney 1984; Pitnick et al. 1997) is another interesting biological difference. If Acp's are major players in postcopulatory male-male and male-female interactions (Wolfner 1997, 2002; Chapman 2001), we might expect to observe different functions and patterns of evolution in desert Drosophila Acp's compared to melanogaster subgroup Acp's.
Our data do not directly address functional divergence of D. mojavensis/D. arizonae vs. D. melanogaster/D. simulans seminal fluid. However, our BLAST results to protein databases for D. mojavensis vs. D. melanogaster/D. simulans Acp's are suggestive of divergent functional biology (e.g., Wagstaff and Begun 2005), with D. mojavensis proteins enriched for unknown functions and depauperate of lipases, proteases, and protease inhibitors compared to those of D. melanogaster. Additional support for this inference and its possible connections to mating system variation await future investigation.
The population genetics of desert Drosophila Acp's showed some similarities and several important differences with respect to D. melanogaster/D. simulans. D. melanogaster and D. simulans Acp's are highly polymorphic and divergent at replacement sites compared to “typical” genes in these two species (Begun et al. 2000; Swanson et al. 2001). Acp's from D. arizonae and D. mojavensis showed a similar pattern in that they were much more polymorphic and divergent at replacement sites, at least compared to the non-Acp genes (mostly testis-enriched genes) surveyed here. However, D. arizonae/D. mojavensis Acp's are proportionally much more polymorphic and divergent in terms of protein variation compared to D. melanogaster/D. simulans Acp's (Table 2). One interpretation is that Acp's tend to be under less functional constraint in desert Drosophila compared to melanogaster subgroup flies. Alternatively, Acp's could be under stronger directional selection in desert Drosophila.
Two types of results support the idea that Acp's experience directional selection in desert Drosophila. First, the Ka/Ks ratio is significantly >1 for two of nine D. mojavensis Acp's. Given the small number of bases surveyed per gene and the fact that the Ka/Ks test is an extremely conservative test for directional selection, observing two of nine genes as individually significant is remarkable. The mean Ka/Ks for D. mojavensis Acp's is 2.078, an extremely high value for any class of genes. Second, the MK tests provide strong evidence for adaptive protein evolution in Acp's, but not in other genes.
Interestingly, Acp data strongly deviate from neutral expectations in D. mojavensis, but not in D. arizonae. Moreover, Table 4 suggests that the highly significant result from the pooled polymorphic and fixed mutations presented in Table 6 is attributable to a consistent excess of replacement fixations across most D. mojavensis Acp's rather than to unusual observations from one or two genes. In fact, almost all D. mojavensis Acp substitutions are amino acid changes. Note that polarized analyses of polymorphic and fixed, synonymous and replacement variation have not been carried out for the D. melanogaster/D. simulans comparison, as outgroup data are generally lacking. In this respect, the population genetic inferences for desert Drosophila are more incisive than those for D. melanogaster and D. simulans. These results support the notion that lineage differences in sexual selection may have detectable effects on patterns of protein evolution (Tsaur et al. 2001; Dorus et al. 2004).
Given their close evolutionary relationship and similar mating systems, the inference of directional selection on D. mojavensis Acp's and the lack of such an inference for D. arizonae are interesting. A notable distinction between mating systems is that the D. mojavensis ejaculate donation to female somatic tissues is three- to fourfold higher than that in D. arizonae, representing a far greater absolute difference than that observed for other sister species pairs from a large phylogenetic survey (Pitnick et al. 1997). This suggests the possibility that this difference should be a focus of our attempts to understand effects of mating system variation on protein variation. Perhaps large somatic donations are correlated with more or stronger Acp-mediated postcopulatory male-female interactions. An intriguing possibility is that the somatic donation from the male is associated with mechanisms that provide males with direct access to the female soma, thereby allowing more direct manipulation of female physiology. In this sense, donation to the female soma could be a Trojan horse that exposes females to exploitation by males, thereby driving male-female conflict and associated Acp divergence. Data from other species pairs with differences in ejaculate donation will shed light on the role of variation in male somatic donations to females in Acp evolution.
An alternative explanation of the differences between D. arizonae and D. mojavensis Acp protein evolution is that our sampling of Acp loci has compromised our ability to make an unbiased comparison between lineages. Because our Acp's were isolated from a D. mojavensis accessory gland cDNA library, we are biased toward isolating genes that are more abundantly expressed in D. mojavensis than in D. arizonae. Therefore, a possible explanation for the differential importance of adaptive protein evolution in D. arizonae vs. D. mojavensis is that more abundantly expressed Acp's are under stronger directional selection. This possibility is easily addressed through additional quantitative analysis (for both expression and population genetics) of larger numbers of Acp's in both species.
There has been much speculation regarding the potential importance of adaptive protein evolution for male-reproduction-related genes. However, the data presented here are the first molecular population genetic analysis of a sample of Drosophila genes expressed primarily in testes. Our results show that in D. arizonae/D. mojavensis, testis-enriched genes evolve much more slowly than Acp's and show no evidence of adaptive protein divergence. Why might Acp's experience more directional selection than testis-enriched genes? Spermatogenesis requires several genes (Fuller 1993; Poccia 1994; Eddy 1998), many of which are unlikely to function directly in male-male and male-female postcopulatory interactions. This is in contrast to Acp's, which are more likely to regulate postcopulatory male-male and male-female interactions (Wolfner 1997, 2002; Chapman 2001; Birkhead and Pizzari 2002). Our contrasting population genetic data for Acp's vs. testis-enriched genes support the idea that proteins controlling postcopulatory, prefertilization phenotypes are more likely to be under directional selection compared to proteins controlling sperm phenotypes per se. However, we predict that proteins controlling sperm phenotypes directly involved in male-male or male-female interactions will show evolutionary patterns similar to those observed at Acp's. Our results suggest, not surprisingly, that the functional categorization of genes as male reproduction related or male biased (e.g., Zhang et al. 2004) obscures a great deal of heterogeneity regarding mechanisms of evolution. More nuanced treatments of male reproduction-related genes with respect to expression and other aspects of biological annotation will likely add great additional insight into the factors explaining variance of protein evolution for such genes (e.g., Good and Nachman 2005).
Footnotes
Footnotes
Communicating editor: A. D. Long
Acknowledgement
We thank A. Long and two anonymous reviewers for useful comments. This work was supported by a National Institutes of Health grant (GM55298 to D.J.B.), a National Science Foundation grant (DEB-0327049 to D.J.B.), and a National Science Foundation doctoral dissertation improvement grant.
References
Aguadé, M.,
Aguadé, M.,
Aguadé, M.,
Aigaki, T., I. Fleischmann, P. S. Chen and E. Kubli,
Altschul, S. F., T. L. Madden, A. A. Schäffer, J. Zhang, Z. Zhang et al.,
Andrews, J., G. G. Bouffard, C. Cheadle, J. Lü, K. G. Becker et al.,
Baudry, E., B. Viginier and M. Veuille,
Begun, D. J.,
Begun, D. J., and P. Whitley,
Begun, D. J., P. Whitley, B. L. Todd, H. M. Waldrip-Dail and A. G. Clark,
Bendtsen, J. D., H. Nielsen, G. von Heijne and S. Brunak,
Betrán, E., and M. Long,
Birkhead, T. R., and T. Pizzari,
Caracristi, G., and C. Schlötterer,
Chapman, T.,
Chapman, T., D. M. Neubaum, M. F. Wolfner and L. Partridge,
Chapman, T., J. Bangham, G. Vinti, B. Seifried, O. Lung et al.,
Chen, P. S., E. Stumm-Zollinger, T. Aigaki, J. Balmer, M. Bienz et al.,
Coulthart, M. B., and R. S. Singh,
DiBenedetto, A. J., D. M. Lakich, W. D. Kruger, J. M. Belote, B. S. Baker et al.,
Dorus, S., P. D. Evans, G. J. Wyckoff, S. S. Choi and B. T. Lahn,
Drysdale, R.,
Duvernell, D. D., and W. F. Eanes,
Eberhard, W. G.,
Eddy, E. M.,
Etges, W. J., and W. B. Heed,
Fuller, M. T.,
Goldman, N., and Z. Yang,
Good, J. M., and M. W. Nachman,
Heifetz, Y., O. Lung, E. A. Frongillo, Jr. and M. F. Wolfner,
Herndon, L. A., and M. F. Wolfner,
Holloway, A., and D. J. Begun,
Kalb, J. M., A. J. DiBenedetto and M. F. Wolfner,
Kern, A. D., C. D. Jones and D. J. Begun,
Kimura, M.,
Knowles, L. L., and T. A. Markow,
Liu, H., and E. Kubli,
Livak, K. J., and T. D. Schmittgen,
Long, M., and C. H. Langley,
Marchler-Bauer, A., J. B. Anderson, C. DeWeese-Scott, N. D. Fedorova, L. Y. Geer et al.,
Markow, T. A.,
Markow, T. A.,
Markow, T. A., and P. F. Ankney,
Markow, T. A., and P. F. Ankney,
Matzkin, L., and W. F. Eanes,
McDonald, J. M., and M. Kreitman,
Meiklejohn, C. D., J. Parsch, J. M. Ranz and D. L. Hartl,
Meiklejohn, C. D., Y. Kim, D. L. Hartl and J. Parsch,
Metz, E. C., and S. R. Palumbi,
Meyer, I. M., and R. Durbin,
Misra, S., M. A. Crosby, C. J. Mungall, B. B. Matthews, K. S. Campbell et al.,
Monsma, S. A., and M. F. Wolfner,
Mouse Genome Sequencing Consortium,
Neubaum, D. M., and M. F. Wolfner,
Nielsen, H., and A. Krogh,
Nurminsky, D. I., M. V. Nurminskaya, D. De Aguiar and D. L. Hartl,
Parsch, J., C. D. Meiklejohn and D. L. Hartl,
Parsch, J., C. D. Meiklejohn, E. Hauschteck-Jungen and D. L. Hartl,
Patterson, J. T.,
Pitnick, S., T. A. Markow and G. S. Spicer,
Pitnick, S., G. S. Spicer and T. A. Markow,
Pitnick, S., G. T. Miller, K. Schneider and T. A. Markow,
Powell, J. R., and R. DeSalle,
Ranz, J. M., C. I. Castillo-Davis, C. D. Meiklejohn and D. L. Hartl,
Rice, W. R.,
Rice, W. R.,
Richards, S., Y. Liu, B. R. Bettencourt, P. Hradecky, S. Letovsky et al.,
Rifkin, S. A., J. Kim and K. P. White,
Rozas, J., and R. Rozas,
Schäfer, U.,
Sutton, K. A., and M. F. Wilkinson,
Swanson, W. J., and V. D. Vacquier,
Swanson, W. J., and V. D. Vacquier,
Swanson, W. J., A. G. Clark, H. M. Waldrip-Dail, M. F. Wolfner and C. F. Aquadro,
Torgerson, D. G., R. J. Kulathinal and R. S. Singh,
Tram, U., and M. F. Wolfner,
Tsaur, S. C., and C.-I Wu,
Tsaur, S. C., C. T. Ting and C.-I Wu,
Tsaur, S. C., C. T. Ting and C.-I Wu,
Wagstaff, B. J., and D. J Begun,
Wheeler, M. R.,
Wolfner, M. F.,
Wolfner, M. F.,
Wolfner, M. F., H. A. Harada, M. J. Bertram, T. J. Stelnick, K. W. Kraus et al.,
Wyckoff, G. J., W. Wang and C.-I Wu,
Yandell, M., A. M. Bailey, S. Misra, S. Shu, C. Wiel et al.,
Yang, Z.,
Yang, Z.,
Zhang, Z., T. M. Hambuch and J. Parsch,
