


Abstract
Histone H1 is an abundant component of eukaryotic chromatin that is thought to stabilize higher-order chromatin structures. However, the complete knock-out of H1 genes in several lower eukaryotes has no discernible effect on their appearance or viability. In higher eukaryotes, the presence of many mutually compensating isoforms of this protein has made assessment of the global function of H1 more difficult. We have used double-stranded RNA (dsRNA) silencing to suppress all the H1 genes of Arabidopsis thaliana. Plants with a >90% reduction in H1 expression exhibited a spectrum of aberrant developmental phenotypes, some of them resembling those observed in DNA hypomethylation mutants. In subsequent generations these defects segregated independently of the anti-H1 dsRNA construct. Downregulation of H1 genes did not cause substantial genome-wide DNA hypo- or hypermethylation. However, it was correlated with minor but statistically significant changes in the methylation patterns of repetitive and single-copy sequences, occurring in a stochastic manner. These findings reveal an important and previously unrecognized link between linker histones and specific patterns of DNA methylation.
IN eukaryotes, the complex structural organization of chromatin fibers is critical for the regulation of gene expression (Kornberg and Lorch 1999). The role of core histones (H2A, H2B, H3, H4) in the modulation of chromatin structure and gene expression is now relatively well understood (Kornberg and Lorch 1999; Jenuwein and Allis 2002). In contrast, little is known about the biological function of linker (H1) histones. Despite their evolutionary conservation (Kasinsky et al. 2001; Jerzmanowski 2004) and binding at a critical location on the nucleosome surface (Zhou et al. 1998), the linker histones have been shown to be nonessential in both protista and fungi (Shen et al. 1995; Barra et al. 2000; Ramon et al. 2000). However, a recent reexamination of the functional consequences of the deletion of Hho1p, a yeast homolog of H1, demonstrated that it is responsible for inhibition of DNA repair by homologous recombination (Downs et al. 2003). A reduced life span as well as global DNA hypermethylation of previously methylated DNA has also been observed upon deletion of H1 in the fungus Ascobolus immersus (Barra et al. 2000). The in vivo examination of global linker histone function in plants and animals is difficult due to the occurrence of several mutually compensating variants. Reversal of the normal ratio of major to minor H1 variants was achieved in tobacco by antisense silencing of the former. Although this had no effect on growth and development of the plant, it did lead to disturbances in male gametogenesis and ultimately produced a male sterility phenotype (Prymakowska-Bosak et al. 1999). In Caenorhabditis elegans a double-stranded RNA (dsRNA)-mediated decrease in H1.1, one of the eight variants of H1 occurring in this invertebrate, led to derepression of a normally silenced reporter transgene in germ-line cells without affecting the expression of this reporter in somatic cells (Jedrusik and Schulze 2001).
Gene knock-out mice have been extensively used to study the effects of the elimination of different H1 variants on mammalian growth and development. Surprisingly, individual variants, including terminal differentiation-specific H10 and testis-specific H1t, were shown to be dispensable for mouse development. Moreover, the individual somatic subtypes are dispensable even in mice lacking the H10 variant (Fan et al. 2001). This is due to highly efficient compensation for the loss of individual variants by other variants, reflecting a strong pressure to maintain a normal H1-to-nucleosome ratio in chromatin. However, mice lacking three main somatic H1 variants and showing a 47% reduction in H1/nucleosome ratio die at around embryonic day 10, demonstrating that linker histones are essential for mouse development (Fan et al. 2003). In contrast to mammals, the developmental phenotypes in plants can be easily studied. Plants are also particularly amenable to specific and heritable genetic interference by double-stranded RNA silencing (Chuang and Meyerowitz 2000; Waterhouse and Helliwell 2003). We therefore decided to use this approach to generate Arabidopsis thaliana plants with maximally silenced H1 genes. We show that plants with a >90% reduction in H1 expression exhibit pleiotropic phenotypic defects, which segregate independently of the anti-H1 dsRNA transgene. The phenotypic defects are correlated with minor but statistically significant changes in the methylation patterns of repetitive and single-copy sequences.
MATERIALS AND METHODS
Sequence analysis:
The database of annotated Arabidopsis genes was searched with Blastp (http://www.ncbi.nlm.nih.gov/BLAST/) for similarity to the H1 globular domain. Nonredundant sequences were selected and globular domains were analyzed as described (Przewloka et al. 2002). Lysine content of terminal domains was calculated with ProtParam (http://us.expasy.org/tools/protparam.html). Genomic duplications were analyzed in the data set of Blanc et al. (2003).
Plasmid construction:
Fragments of histone H1 cDNAs were amplified from A. thaliana Col-0 cDNA using primers with added restriction sites. The fragment of H1-1 corresponds to positions 181–1040 in AF428314, H1-2 corresponds to positions 75–1002 in X62459, and H1-3 corresponds to positions 82–692 in U73781. Primer sequences are available upon request. Amplified cDNA fragments were cloned into vector pBluescript II and then linked in one plasmid construct. The linked cDNAs were then introduced into the binary vector pFGC1008 (http://www.chromdb.org/fgc1008.html) in the sense orientation using AscI and SwaI sites and in the antisense orientation using BamHI and SpeI sites. In the final plasmid, the sense and antisense sequences were separated by a spacer originating from the uidA gene. Expression in Arabidopsis was controlled by the CaMV 35S promoter (Figure 2A).
Transgenic plants:
Transformation of A. thaliana Col-0 plants was performed as described by Desfeux et al. (2000). Transformants were selected with 75 μg ml−1 hygromycin B (Sigma, St. Louis). Plants were grown in soil in a growth chamber with a 16-hr day at 20°–25° or in a greenhouse with supplemental light for 16 hr.
For transgene detection, genomic DNA was isolated from leaves and PCR was performed with primers to the hygromycin phosphotransferase gene. Primers to a single-copy Arabidopsis gene At2g47620 (provided by S. Swiezewski) or At3g55440 were included in each reaction as a DNA concentration control. Amplified products were resolved on 1% TBE agarose gels and detected by staining with ethidium bromide. Hygromycin-resistant T0 plants were assumed to be transgenic.
RT-PCR gene expression analysis:
Total RNA was extracted from rosette leaves using an RNeasy Plant Mini Kit (QIAGEN, Chatsworth, CA) and digested with RNase-free DNase I (Roche). cDNA was synthesized with a Superscript first strand synthesis kit (Invitrogen, San Diego) and stored in TE buffer. cDNA concentration was standardized in a PCR reaction with primers for actin (Ratcliffe et al. 2001) using 26–28 cycles. Primer pairs specific for the H1 histones were designed in such a way that one primer was outside the region included in the transgene. The following primer sequences were used: H1-1 AGACTGCTGCTGCTAAGAAAGT and GTTTGCTTCATTGATGAAATCT, H1-2 GCTAAGGCTAAGGTTACTGCTAAA and AACCAAAACTTACAAAGAAGAAAAA, and H1-3 CCACCACTCATCCTCCATACTTTC and TTTATCAACCCAAGTAAAAATCTATC. For each reaction a PCR linearity control was performed using different amounts of added control cDNA. PCR products were resolved on 1% TBE agarose gels and ethidium-bromide-stained band intensities were measured using ImageJ image analysis software (http://rsb.info.nih.gov/ij/).
DNA methylation analysis:
A Southern blot was performed with genomic DNA digested with restriction endonucleases HpaII or MspI and probed with a 180-bp centromeric repeat fragment (Simoens et al. 1988). Positive control plants were grown for 3 weeks on MS medium containing 25 μg ml−1 5′-Aza-2′deoxycytidine (Sigma).
Genomic bisulfite sequencing was performed as described by Jacobsen et al. (2000). Primer sequences for the FWA promoter (Soppe et al. 2000), MEA-ISR (Cao and Jacobsen 2002a), and AtSN1 (Zilberman et al. 2003) were provided by S. E. Jacobsen. PCR products were cloned using an Advantage PCR cloning kit (CLONTECH, Palo Alto, CA) or TOPO TA cloning kit (Invitrogen). A total of 6–10 clones were sequenced using vector-specific primers. For statistical analysis, methylation intensity was calculated for individual cytosines in the sequence or, alternatively, for individual clones. Student's t-test was applied for both approaches and data were considered statistically significant if both calculations gave P ≤ 0.05. For verification of the clone sequencing data, converted DNA was PCR amplified, gel purified, digested with MnlI or BsaJI, and resolved on 3% agarose gels. The intensity of bands indicating digestion was densitometrically measured and an average for two independent amplifications and three independent digestions was calculated.
The DNA methylation status of 5.8S ribosomal DNA and gene At3g45140 was examined by PCR after cleavage with methylation-sensitive restriction endonucleases. Genomic DNA was isolated using a Genelute plant genomic DNA miniprep kit (Sigma) and digested with 20 units μg−1MspI, HpaII, or AluI. PCR primers were designed to flank four to nine MspI/HpaII or AluI cleavage sites. The control primers do not flank any cleavage sites for these endonucleases. The following primer sequences were used: for At3g45140 (flanking MspI/HpaII sites), CAGAACCAATACCATCGACAGTTGTTCCTC and ACAATCTCTTATTCTTTAGAGCCTGCATACAAA; for 5.8S rDNA (flanking MspI/HpaII sites), GCCTCGGGAAGAGTTATCTTTTCTGT and GACCATCGCAATGCTTTGTTTTAAT; for 18S rDNA (flanking AluI sites), GTTGAAATCTCGGATGCGGAAAAG and TGTGTACAAAGGGCAGGGACGTAG; for control flanking no MspI/HpaII sites (in At3g55440), CCTTCACAGGATGTTGTAGGTATGTGTAGCATCT and AAGCACCTCCTTTCTTAACCCAACAGTTTT; and for control flanking no AluI sites (in rDNA) GTTTTGTTGCCTTTTTCCGAGTTTTCTCAG and TCAATTAACTCAAAATCATCAATCGTTCCA.
As a PCR linearity control, reactions were performed with different amounts of control DNA with a twofold concentration increase in each lane. For densitometric analyses, gels were photographed and band intensities were measured. For the single-copy sequence At3g45140, both methylation-sensitive and control reactions were performed in one tube in a multiplex PCR. The relative intensity of bands corrected for size difference gave the methylation rate. The average and standard deviation for three independent amplifications was calculated. Independent digestions were also tested and gave similar results (data not shown). For ribosomal DNA, methylation-sensitive and control reactions were performed in parallel but separate reactions and thus methylation could be measured only relative to one of the controls. Band intensities were corrected for control intensity and the average and standard deviations for three independent amplifications were calculated.
RESULTS
Identification of genes encoding canonical histone H1 in Arabidopsis:
We performed a homology search of the whole Arabidopsis genome that identified 13 Arabidopsis proteins containing domains with similarity to the conserved H1 globular domain (GH1). However, only proteins At1g06760, At2g30620, and At2g18050 contained lysine-rich N- and C-terminal tails (Figure 1A)
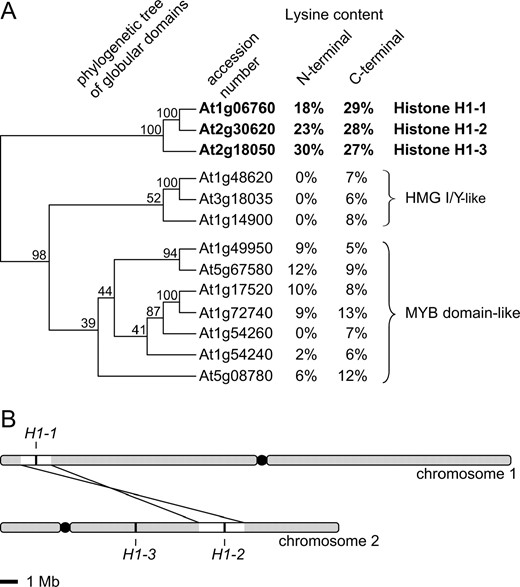
Identification of the entire complement of Arabidopsis histone H1 genes. (A) Phylogenetic analysis based on results of sequence homology searches and calculation of lysine content. The Arabidopsis genome encodes only three proteins that contain both the histone H1 central globular domain and the lysine-rich terminal domains. (B) Histone H1-1 and H1-2 genes are the result of a recent duplication event.
. The same three proteins have previously been identified by cloning and molecular and biochemical analyses as Arabidopsis linker histones H1-1, H1-2, and H1-3 (Gantt and Lenvik 1991). The remaining 10 proteins belong to HMG I/Y and MYB domain-like classes of DNA-binding factors, which are also known to contain winged-helix GH1-type domains (Jerzmanowski et al. 2000). Two of the identified H1 variants, H1-1 and H1-2, share extensive similarity at both amino acid and nucleotide levels and have probably resulted from a recent genomic duplication (Figure 1B). Histone H1-3 is more divergent and belongs to a conserved class of drought-inducible variants (Ascenzi and Gantt 1999; Jerzmanowski et al. 2000). Thus, a genome-wide homology search confirmed that Arabidopsis has only three isoforms of the canonical H1.
Silencing of the entire complement of Arabidopsis linker histone genes:
To silence all three Arabidopsis H1 genes, we applied a dsRNA approach. Gene-specific DNA fragments for H1-1, H1-2, and H1-3 were fused to form a continuous sequence and placed in both antisense and sense orientations in a binary plasmid under control of a constitutive promoter (Figure 2A)
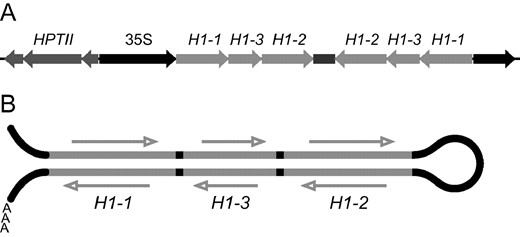
Strategy for silencing three histone H1 genes. (A) T-DNA of a binary plasmid constructed to silence H1 genes. Fragments of histone H1 cDNAs, 600–900 bp long, are joined together in the pFGC1008 binary vector in both sense and antisense orientations under the control of the 35S constitutive promoter. The hygromycin phosphotransferase (HPTII) gene is used as a selectable marker. (B) dsRNA directed against Arabidopsis H1 genes transcribed from the binary plasmid.
. An RNA molecule transcribed from the fused fragments is capable of forming a dsRNA stem with a single-stranded terminal loop (Figure 2B), a structure that can potentially induce silencing of all three H1 genes by the RNAi mechanism. The H1-dsRNA construct was used to transform Arabidopsis plants via Agrobacterium. From two independent transformation experiments, 62 primary transformants (T0) were obtained. The plants were assayed for expression of the three H1 genes using quantitative RT-PCR. The total amount of histone H1 mRNA in H1-dsRNA-transformed plants was found to be significantly reduced (Figure 3A)
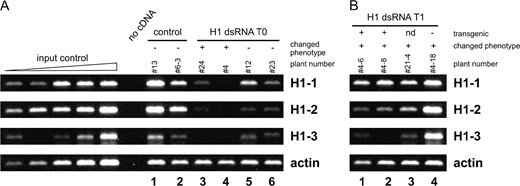
H1 expression in transgenic plants assayed by quantitative RT-PCR. (A) In primary transformants (T0) total expression of genes encoding H1 variants was reduced to <5% of controls in plants displaying phenotypic defects (lanes 3 and 4) and to ∼50% of the control value in T0 plants with a normal phenotype (lanes 5 and 6). (B) T1 plants showed intermediate H1 expression (lanes 1–3) compared to parental and control plants. A T1 plant without the transgene showed no reduction in H1 expression (lane 4). For input control reactions, control cDNAs were used with the concentration increasing twofold in each lane. To normalize band intensities to the cDNA concentration present in the reactions, actin primers were used in control reactions. Above the lanes, the numbers refer to individual plants and indicate the generation (x, T0; x–y, T1); in A, the phenotype is indicated by + (changed) or − (unchanged); in B, transgene presence is indicated by + (transgenic), − (nontransgenic), or nd (no data).
with expression levels ranging from 50% to <5% of that in transformed control plants. Thus, the dsRNA strategy was effective in simultaneously silencing the expression of all genes encoding variants of histone H1 in Arabidopsis.
Plants transformed with H1-dsRNA display pleiotropic developmental abnormalities that correlate with reduced expression of genes encoding H1 variants:
About 18% of the 62 primary transformants (T0H1 dsRNA plants) had notable developmental defects compared to plants transformed with empty plasmids (controls). The altered T0 plants displayed several different defects occurring independently or sometimes in parallel. In vegetative growth these were reduced size (Figure 4C)
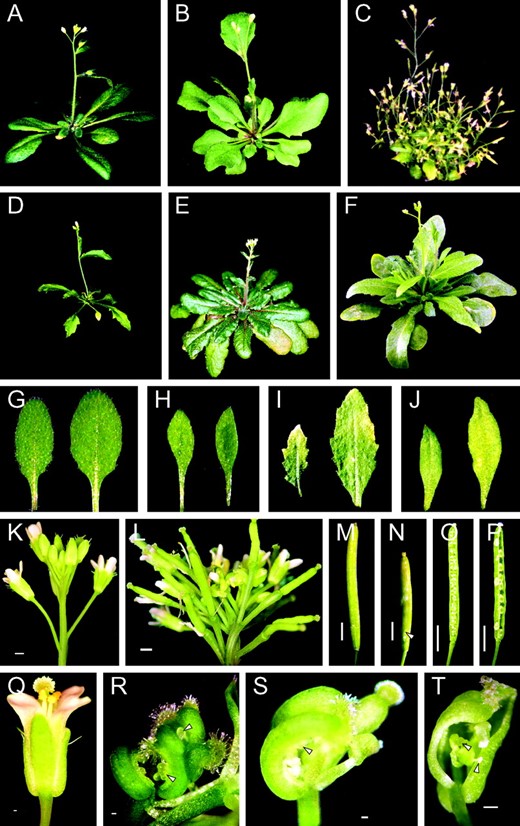
Phenotypic defects caused by reduced expression of H1. (A, G, K, M, O, and Q) Control plants transformed with empty plasmid. (B) T0 plant 22 with serrated leaves. (C) T0 plant 7 with reduced size, disturbed apical dominance, and small elongated leaves. (D) T1 plant 4-6 with reduced size and serrated leaves. (E) T1 plant 21-4 with late-flowering phenotype. (F) T2 plant 27-15-3 with delayed flowering, elongated leaves, and reduced apical dominance. (H) Elongated leaves of T1 plant 27-1. (I) Small serrated leaves of T1 plant 4-6. (J) Small elongated leaves of T0 plant 7. (L) Disturbed inflorescence of T1 plant 4-22. (N) Additional carpels in T1 plant 27-15 (arrowhead). (P) Embryonic lethality in T1 plant 27-15. (R) Flower abnormalities in T0 plant 16. (S) Flower abnormalities in T1 plant 4-21. (T) Flower abnormalities in T1 plant 27-15. Bars: K–P, 2 mm; Q–T, 0.2 mm. Annotation of plants as described for Figure 3.
; increased size; serrated (Figure 4B) or small, elongated (Figure 4, C and J) leaves; and reduced apical dominance (resulting in more inflorescence stems, more inflorescence branching, or a bushy appearance; Figure 4C). In the generative phase the changes were delayed flowering, infertility or reduced fertility, smaller siliques (not shown), and, in one case, flower abnormalities (separated carpels, partial transformations of lower parts, ectopic ovules; Figure 4R). Plants with aberrant phenotypes had a considerably greater reduction in H1 expression than plants with no visible changes (Figure 3A; compare lanes 3 and 4 with lanes 5 and 6). Thus, the interference with H1 gene expression is linked to pleiotropic changes of the phenotype and the extent of change is correlated with the percentage of downregulation of the H1 genes.
Developmental abnormalities observed in T0 plants with downregulation of H1 genes increase in subsequent generations and do not strictly cosegregate with the H1-dsRNA transgene:
To analyze the consequence of downregulation of H1 genes in subsequent generations, we selected from the 62 primary transformants (T0) a group of 31 plants, which included all those with changed phenotypes and some randomly picked plants with unchanged phenotype. These plants were allowed to self-pollinate and the resulting seeds were germinated without antibiotic selection, yielding 31 T1 lines, each consisting of 10–63 plants. One-third of the analyzed T1 lines showed noticeably increased phenotypic changes. New abnormalities occurred in the progeny of phenotypically changed T0 plants with a high level of H1 mRNA depletion as well as in the progeny of T0 plants with a normal phenotype and intermediate H1 mRNA depletion. No phenotypic changes occurred in the progeny of controls transformed with empty plasmids. The phenotypic changes in the T1 generation were also pleiotropic. They were reduced size (Figure 4D), serrated (Figure 4I) or elongated (Figure 4, F and H) leaves, delayed flowering (Figure 4, E and F), aberrant inflorescence morphology (Figure 4L), flower and generative phase abnormalities such as separated carpels (Figure 4, S and T), siliques with additional carpels (Figure 4N), embryonic lethality (Figure 4P), and maternally inherited increase in seed size (not shown).
To study the relationship between silencing of H1 genes and the observed pleiotropic defects, we examined the cosegregation of the transgene (the H1-dsRNA construct) and the phenotypic changes in selected T1 and T2 lines. In the first analyzed line (a plant from this line is shown in Figure 4D), among >30 F1 plants, 77% were transgenic and 23% nontransgenic. However, all plants found to be nontransgenic still displayed phenotypic abnormalities. For a second round of tests, we used a heterozygous T1 plant obtained after self-pollination of a different transformed T0 plant. This was allowed to self-pollinate and the segregation in the T2 generation (a plant from this T2 line is shown in Figure 4F) was analyzed. Among 17 T2 plants ∼65% were transgenic and 35% nontransgenic. Half of the nontransgenic plants exhibited abnormalities. Thus, in both the T1 and T2 generations, there was no strict cosegregation of the transgene causing suppression of H1 genes and the phenotypic changes.
To rule out the possibility that the T1 plants with developmental abnormalities but no H1-dsRNA transgene retained a reduced level of H1 expression due to silencing of the endogenous H1 loci, we analyzed the T1 plants by quantitative RT-PCR. While the transgenic T1 plants displayed reduction of H1 expression to different extents (Figure 3B, lanes 1–3), the expression of H1 genes in a nontransgenic and phenotypically changed plant was found to be normal (Figure 3B, lane 4). This is in agreement with previous reports that in plants gene silencing caused by dsRNA against coding sequence cosegregates with the transgene (Chuang and Meyerowitz 2000).
We further analyzed the subsequent generations of plants selected from T1 lines with changed phenotypes (Table 1)
Phenotypes of the progeny of three independent histone H1-deficient T0 plants
Transgenic line phenotypic changes | No. 21a | No. 4b | No. 27c | ||||
|---|---|---|---|---|---|---|---|
| Generation | Phenotype
severityd | No. of
plants | Nontransgenic | No. of
plants | Nontransgenic (%) | No. of
plants | Nontransgenic (%) |
| T0 | − | 1 | 1 | 1 | |||
| + | |||||||
| T1 | − | 4 | ND | 2 | 0 | 0 | |
| + | 7 | ND | 8 | 38 (n = 3) | 14 | ND | |
| +++ | 21 | 19 (n = 4) | |||||
| T2 | − | 0e | 7i | 100 (n = 4)j | 10k | 30 (n = 3) | |
| + | 115e | 0%f | 21i | 100 (n = 14)j | 25k | 12 (n = 3) | |
| +++ | 17i | 100 (n = 13)j | |||||
| T2 × WT F1 | − | 54g | ND | ||||
| + | 0g | ||||||
| T3 | − | 0h | |||||
| + | 60h | ND | |||||
| T2 × WT F2 | − | 22 | ND | ||||
| + | 2 | ND | |||||
| T4 | − | 0 | |||||
| + | 11 | ND | |||||
Late flowering.
Serrated leaves, reduced growth, reduced fertility.
Elongated leaves, changed flowering time, additional carpels, embryo lethality.
(−) normal phenotype; (+) affected phenotype; (+++) severely affected phenotype.
Progeny of two T1 plants with affected phenotype.
All analyzed plants transgenic (n = 63).
Progeny of two T2 plants with affected phenotype crossed to Col-0.
Self-pollination of two T2 plants with affected phenotype.
Progeny of three T1 plants with affected phenotype, one of which was nontransgenic.
All analyzed plants nontransgenic; progeny of nontransgenic plant was assumed to be nontransgenic.
Progeny of two T1 plants with affected phenotype.
Number of plants displaying normal, affected, or severely affected phenotype as well as the percentage of nontransgenic individuals among assayed plants in each generation is indicated. For line 21, backcross to Col-0 is analyzed.
. In three separate lines the phenotypic changes were maintained in T2 generation. In one of the lines (4), the T2 plants displayed a spectrum of phenotypes similar to that observed in plants of the T1 generation. However, all T2 plants of this line were nontransgenic, indicating that a continuous accumulation of defects in the presence of the H1-dsRNA construct leads to lethality. In a second analyzed T2 line (27), the observed phenotypes were more severe compared to those in the parental plants; however, in contrast to the T1 plants, some of the T2 plants had no visible phenotypic abnormalities. The third analyzed line (21) showed a continuous presence of altered phenotypes in all T2, T3, and T4 plants. Backcross to wild-type Col-0 revealed that the phenotype is caused by a recessive trait as all F1 plants were normal and the same phenotype reappeared in F2.
Taken together, the above results are consistent with the interpretation that downregulation of the H1 genes is not the direct cause of the observed developmental abnormalities. Rather, it permits some secondary changes to occur, probably at multiple loci, which in turn affect development. These changes are heritable and can accumulate in subsequent generations. This is reminiscent of the situation in Arabidopsis mutants with disturbed epigenetic mechanisms (Finnegan et al. 1996; Kakutani et al. 1996; Tian and Chen 2001).
Downregulation of H1 genes does not cause global DNA demethylation in constitutive heterochromatin but stochastically affects methylation patterns:
Since it has been previously shown that aberrant DNA methylation in Arabidopsis correlates with heritable and pleiotropic phenotypic changes (Finnegan et al. 1996; Kakutani et al. 1996; Ronemus et al. 1996; Richards 1997), we decided to check the status of DNA methylation in T0 plants transformed with the H1-dsRNA construct and their progeny.
To examine how the downregulation of H1 genes affects DNA methylation in constitutive heterochromatin, we analyzed the methylation status of the highly repetitive 180-bp centromeric sequence. These repeats represent several percents of the genome and are heavily methylated at the 5′-CCGG-3′ sites and recognized by the methylation-sensitive isoschizomers HpaII and MspI. The methylation can occur on both cytosines, i.e., in the CpG and CpNpG contexts. Cleavage by HpaII is blocked by methylation in CpG and CpNpG contexts and cleavage by MspI by methylation in the CpNpG context. Methylation at CpG sites is dramatically reduced in wild-type Arabidopsis plants treated with the cytosine methylation inhibitor 5-azacytidine (see Figure 5A
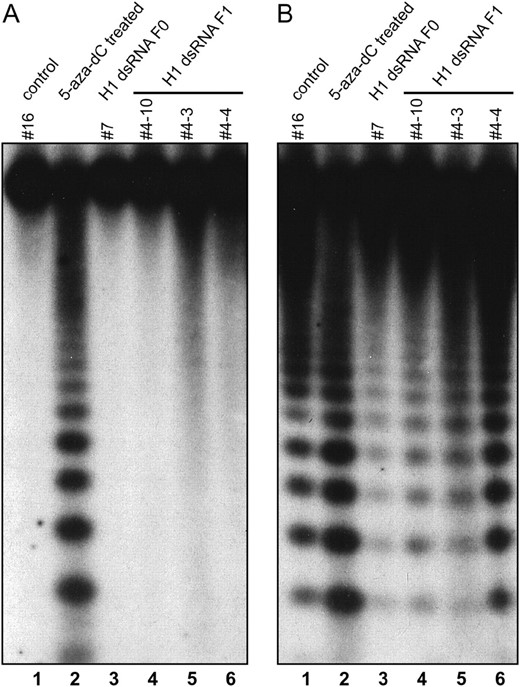
DNA methylation of 180-bp centromeric repeats assayed by Southern blot analysis of genomic DNA digested with HpaII and MspI (isoschizomers cleaving CCGG). (A) Methylation blocking cleavage by HpaII (CpG plus CpNpG) is almost 100% and is not reduced in plants with suppression of histone H1 genes. (B) Methylation of CpNpG sites, which prevents cleavage by MspI, is significantly increased in one analyzed T0 plant (7). Annotation of plants as described for Figure 3. Plants 4-10 and 4-3 were transgenic; plant 4-4 was nontransgenic.
, lane 2) as well as in mutants in the CpG-specific maintenance methyltransferase MET1 and in a chromatin remodeling ATPase (DDM1; Vongs et al. 1993; Finnegan et al. 1996). Southern blot analysis after digestion of DNA with HpaII and MspI revealed that the CpG methylation in centromeres (detected mostly by HpaII), which in the control is almost 100% (Figure 5A, lane 1), was not reduced in an T0 transformant (H1-dsRNA T0) or in T1 plants (Figure 5A, lanes 3–6). However, the CpNpG methylation (detected by MspI) was shown to be significantly increased in one T0 plant, which displayed the most severe morphological changes (Figure 5B, lane 3).
Next, methylation of ribosomal DNA was analyzed using digestion with HpaII, MspI, and additionally with AluI (5′-AGCT-3′ to detect methylation at asymmetric CpNpN sites) and quantitative PCR to assay the digestion rate (Figure 6)
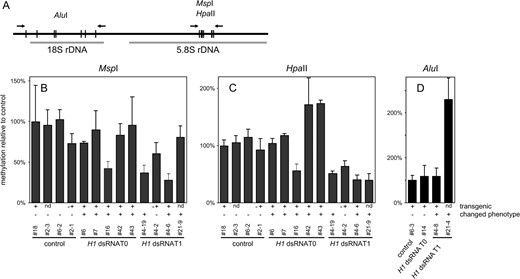
DNA methylation of ribosomal DNA. Genomic DNA was digested with MspI, HpaII, or AluI (20× overdigestion) and rDNA was amplified with primers flanking digestion sites. (A) Diagram of the analyzed sequence with PCR primers and relevant restriction sites for AluI and MspI/HpaII marked. (B) Densitometric analysis of the results of MspI digestion (average from three independent amplifications; error bars represent SD) showing CpNpG methylation on 5.8S rDNA; primers flanked nine digestion sites. Methylation is significantly reduced in three plants with H1 suppression (plants 16, 4-19, and 4-6). (C) Densitometric analysis of the results of HpaII digestion (average from three independent amplifications; error bars represent SD) showing CpG and CpNpG methylation on 5.8S rDNA; primers flanked nine digestion sites. Methylation is significantly increased in two plants (plants 42 and 43) and reduced in five plants with H1 suppression (plants 16, 4-19, 4-2, 4-6, and 21-9). (D) Densitometric analysis of the results of AluI digestion (average from three independent amplifications; error bars represent SD) showing asymmetric methylation (CpNpN) on 18S rDNA; primers flanked six digestion sites. Methylation is significantly increased in one plant with H1 suppression (21-4). Primers flanking a sequence with no cleavage sites (At3g55440) were used as a control. Annotation of plants as well as indication of phenotype and transgene presence as described for Figure 3.
. In some of the tested T0 and T1 plants the rDNA methylation in both CpG and CpNpG contexts was indistinguishable from that observed in four analyzed controls. However, two plants showed significantly increased and five significantly reduced methylation detected by HpaII (Figure 6C). Three plants showed reduced methylation detected by MspI (Figure 6B) and one plant had increased asymmetric methylation (Figure 6D). There was no clear correlation between changes in rDNA methylation in different contexts. Using RT-PCR, we also determined the occurrence of transcripts of transposons that are subject to reactivation in the hypomethylated ddm1 background. No reactivation of AtMu1, F14I23, F21A20_a (Singer et al. 2001), or Athila (Steimer et al. 2000) could be detected (data not shown). The observed pattern of DNA methylation at repetitive sequences and the lack of transposon reactivation indicate that downregulation of H1 genes in Arabidopsis did not cause substantial genome-wide hypo- or hypermethylation of DNA. However, it was correlated with minor changes in the methylation patterns of repetitive sequences, both positive and negative, occurring in a stochastic manner.
The status of DNA methylation at specific loci:
To assess the effect of suppression of H1 genes on methylation of genomic sequences located outside centromeres and rDNA arrays, we examined sequences known to be regulated by methylation in Arabidopsis as well as a randomly selected sequence. The FWA gene promoter is regulated by DNA methylation and its demethylation causes late flowering (Soppe et al. 2000), similar to that observed in some of the plants with downregulation of the H1 genes (Figure 4E). To examine whether downregulation of H1 causes demethylation of the FWA promoter, genomic bisulfite sequencing was used. We found a few plants with significantly reduced CpG methylation (Figure 7A
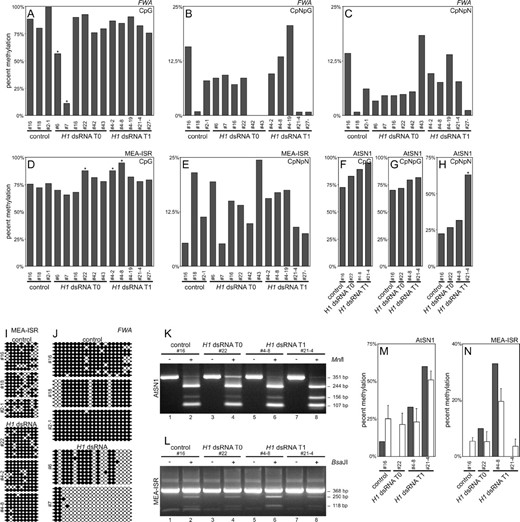
Genomic bisulfite sequencing of the FWA promoter, MEA-ISR, and AtSN1. (A) At the FWA promoter there was significant reduction of CpG methylation in two plants with reduced expression of H1 (plants 6 and 7). Asterisk indicates statistical significance. (B and C) CpNpG and asymmetric (CpNpN) methylation of the FWA promoter is highly variable even in control plants. (D) At the MEA-ISR sequence there was a small but significant increase in CpG methylation in three plants with reduced expression of H1 (22, 4-2, and 4-8). Asterisk indicates statistical significance. (E) Asymmetric methylation of MEA-ISR is highly variable even in control plants. (F–H) At the AtSN1 retrotransposon locus some increase in CpG and asymmetric methylation was detected, which was statistically significant for one plant (21-4). (I) CpG methylation of cytosines in individual clones in MEA-ISR. Solid circles indicate methylated and open circles indicate nonmethylated cytosines. (J) CpG methylation of cytosines in the FWA promoter in individual clones. Solid circles indicate methylated and open circles indicate nonmethylated cytosines. (K) Verification of bisulfite sequencing of AtSN1 locus with MnlI digestion. The 351-bp band represents the uncleaved PCR fragment, the 244- and 107-bp bands indicate digestion at a site that has no cytosines on the converted strand and thus is always cleaved, and the 156-bp band (plus an additional 88-bp band not visible on 3% agarose gel) indicates digestion of the second site and thus methylation of all cytosines in the CCTC restriction site. (L) Verification of bisulfite sequencing of MEA-ISR with BsaJI digestion. The 368-bp band represents an uncleaved PCR fragment, the 250- and 118-bp bands indicate digestion and thus methylation of both cytosines in the CCNNGG restriction site. (M and N) Comparison of digestion rate (open bars represent the average from three independent digestions; error bars represent SD) with bisulfite sequencing data for cytosines recognized by the restriction enzyme (solid bars). For both AtSN1 and MEA-ISR, sequencing and digestion data are in agreement. Annotation of plants as described for Figure 3. Plant 4-2 is transgenic with normal phenotype, plant 4-8 is transgenic with changed phenotype, and plant 4-19 is nontransgenic with changed phenotype.
, plants 6 and 7; Figure 7J). One of the affected plants (6) had an intermediate late-flowering phenotype that could be caused by ectopic FWA expression. However, a T1 plant from another group, which had a fully pronounced and heritable late-flowering phenotype (>30 leaves at the time of flowering; Figure 4E), had a normal level of CpG methylation at the FWA promoter (Figure 7A, plant 21-4) and no detectable expression of FWA in leaves (data not shown). The levels of CpNpG and asymmetric methylation at the FWA promoter were highly variable in the T0 and T1 plants analyzed, although a similar extent of variability was also seen in controls (Figure 7, B and C). We conclude that suppression of histone the H1 genes caused sporadic CpG demethylation at the FWA gene promoter.
The medea intergenic subtelomeric repeat (MEA-ISR), a sequence of ∼183 bp occurring in seven direct repeats between the imprinted medea (MEA) gene and the aldehyde oxidase gene as well as at several other subtelomeric locations, is often used to monitor changes in DNA methylation status (Cao and Jacobsen 2002a). Using bisulfite genomic sequencing, we observed slight but statistically significant CpG hypermethylation of this sequence in some of the H1-dsRNA F0 and F1 plants, compared with controls (Figure 7D, plants 22, 4-2, and 4-8; Figure 7I). The level of asymmetric methylation at MEA-ISR was highly variable in controls, making it impossible to assess the significance of the changes observed in the T0 and T1 plants (Figure 7E). CpNpG methylation occurred at only one cytosine within the analyzed sequence and thus was not suitable for analysis. Bisulfite sequencing of the retrotransposon AtSN1 sequence revealed some increase in CpG methylation in T0 and T1 plants compared to the controls and significant hypermethylation at asymmetric sequences in one of the T1 plants (Figure 7, F–H).
To verify the results obtained by bisulfite genomic sequencing, we used digestion with restriction endonucleases MnlI and BsaJI, which recognize sequences with differentially methylated cytosines. In this assay, if DNA is methylated, it is not converted by bisulfite and can be cleaved by the enzymes. If DNA is not methylated, it is converted and becomes resistant to digestion by these restriction enzymes. For both AtSN1 and MEA-ISR sequences, the levels of DNA methylation measured by this assay corresponded with the data from bisulfite sequencing, confirming the validity of these findings (Figure 7, K–N).
By digestion with HpaII and MspI and quantitative PCR assay we also analyzed the effect of H1 suppression on the methylation of a randomly chosen gene, At3g45140, which is expressed but highly methylated within its coding sequence. A strong reduction in the digestion by HpaII in some of the T0 and T1 plants compared to controls (Figure 8C
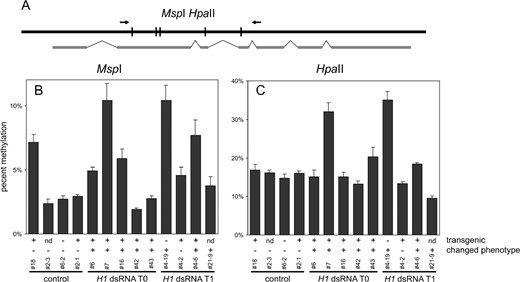
DNA methylation of At3g45140. (A) Diagram of the analyzed sequence with PCR primers and relevant restriction sites of MspI/HpaII as well as exon/intron organization of the locus marked. (B) Densitometric analysis of the results of MspI digestion (20× overdigestion; the average from three independent amplifications; error bars represent SD) showing CpNpG methylation; primers flanked five digestion sites. A primer pair for locus At3g55440 flanking a sequence with no cleavage sites for MspI and HpaII was used as a control. Methylation is significantly increased in two plants with H1 suppression (7 and 4-19). (C) Densitometric analysis of the results of HpaII digestion (20× overdigestion; average from three independent amplifications; error bars represent SD) showing CpG and CpNpG methylation; primers flanked five digestion sites. The primer pair for locus At3g55440 was used as a control. Methylation is significantly increased in two plants with H1 suppression (7 and 4-19). Annotation of plants as well as indication of phenotype and transgene presence as described for Figure 3.
, plants 7 and 4-19) indicates significant hypermethylation at CpG sites. As revealed by digestion with MspI, the same plants had increased DNA methylation at CpNpG sites (Figure 8B). These changes seem to be significant when compared to the natural variability of DNA methylation at this sequence. Thus, in some plants with decreased expression of H1 genes, the At3g45140 locus was subjected to coordinated hypermethylation at CpG and CpNpG sequences. It is important to point out that the T1 plant 4-19 (Figure 8, B and C) has lost the H1-dsRNA transgene due to Mendelian segregation. Thus, the changed DNA methylation pattern is inherited even when the expression of H1 genes has been restored. This could explain the lack of strict cosegregation of the H1-dsRNA transgene and the observed phenotypic defects.
In total, we assayed DNA methylation in 17 individual plants, analyzing seven different loci and using four different methodological approaches. Among 56 independent plant/locus combinations, a considerable percentage were shown to have an altered DNA methylation pattern.
DISCUSSION
Phenotypic consequences of the downregulation of H1 genes:
The suppression by a dsRNA strategy of the entire complement of linker histone genes in Arabidopsis resulted in a surprising variety of developmental abnormalities, which occurred in almost 20% of the T0 plants. The observed correlation between the extent of the decrease in H1 expression and the occurrence of changed phenotypes (Figure 3A) strongly suggests a cause-and-effect relationship. However, analysis of the inheritance of phenotypic changes in subsequent generations revealed an unusual pattern. First, the altered phenotypes occurred in the progeny of T0 plants that already exhibited phenotypic changes as well as in the progeny of those T0 plants with decreased H1 expression that appeared phenotypically normal. In addition, the severity of changes in T1 and T2 plants seemed greater than that in the T0 parents (Table 1). Second, the phenotypic changes in the T1 and T2 generations did not strictly cosegregate with the suppression of the H1 genes. In T1 and T2 progeny of the T0 plants with decreased H1 expression and altered phenotype, the developmental abnormalities were maintained even in plants that fully reverted to a wild-type level of H1 gene expression. Thus, there was a general tendency for subsequent generations to accumulate the changes initiated by downregulation of H1 in T0, independently of whether or not the initial suppression of H1 was maintained. Such effects could result from a two-stage process. The first stage would be a decrease in the available linker histone pool in the nuclei caused by downregulation of H1 genes. This is turn could initiate a secondary mechanism, presumably self-perpetuating (a second stage), which would result in heritable changes in gene expression and altered phenotype.
Possible causes of the heritable developmental abnormalities:
A causal mechanism consistent with the above scenario would be an epigenetic change in chromatin induced by downregulation of H1 genes. Such a change should affect different aspects of plant development and be transmissable through meiosis. In addition, the developmental abnormalities that it causes should become progressively more extreme upon inbreeding of the mutants. In Arabidopsis, these requirements are best fulfilled by changes in DNA methylation. In flowering plants, as in mammals, this modification has a key role in heterochromatin formation and repression of gene activity. In mouse, mutants in the major mammalian CpG methyltransferase Dnmt1 die after 9 days of development (Li et al. 1992), similar to mice lacking the three main somatic H1 variants (Fan et al. 2003). In contrast, Arabidopsis mutants in MET1 methyltransferase, responsible for the majority of CpG methylation, are viable but show various developmental defects, which increase in severity upon inbreeding. Similar defects linked with progressive loss of CpG methylation are observed in mutants in DDM1 (Finnegan et al. 1996; Kakutani et al. 1996), an SNF2-type ATP-dependent chromatin remodeler (Brzeski and Jerzmanowski 2003). In addition to methylation in the CpG context, Arabidopsis DNA is also methylated in CpNpG and asymmetric (CpNpN) contexts, probably by the concerted action of different DNA methyltransferases: DRM1, DRM2, and CMT3 (Cao and Jacobsen 2002a,b). The majority of DNA methylation in Arabidopsis is at CpG sites and occurs in constitutive heterochromatin at centromeric tandem repeats, ribosomal DNA arrays, and transposon- or retrotransposon-derived sequences (Fransz and deJong 2002).
The developmental abnormalities that we observed, with the exception of the extreme late flowering, did not include the characteristic flower defects commonly seen in DNA methylation mutants met1 and ddm1, e.g., clavata-like or sup-like flowers. Such changes were also absent in mutants in Arabidopsis DNA methyltransferases responsible for CpNpG and asymmetric methylation (Cao and Jacobsen 2002a).
The assays used to examine the status of DNA methylation in transformed T0 plants and in their progeny were based on different methods and were applied to study constitutive heterochromatin and other types of sequence. Using Southern blot analysis with the methylation-sensitive enzymes HpaII and MspI, we found no indication that downregulation of H1 genes was correlated with global demethylation of CpGs within highly redundant centromeric repeats, like that seen upon inbreeding of met1 or ddm1 mutants or caused by the DNA methylation inhibitor 5-azacytidine. This was confirmed by the lack of activity of transposons known to be reactivated in the hypomethylated ddm1 background.
When analyzing DNA methylation at specific sites it is vital to distinguish between systemic, biologically important changes and changes resulting from natural variation, i.e., differences from plant to plant in the percentage of methylation at any given site. To gain insight into natural variation of this type, we assayed methylation in several control plants. The changes occurring in plants exposed to downregulation of H1 genes were taken as significant only when they exceeded the level of natural variation observed in controls.
The analysis of rDNA arrays by quantitative PCR demonstrated that in T0 and T1 plants with reduced expression of H1 genes there was a statistically significant increase in the extent of fluctuations in the level of DNA methylation (hyper- or hypomethylation) within CpG and CpNpG contexts, compared to control plants. The analysis by bisulfite sequencing of three specific sequences (FWA promoter, MEA-ISR, and retrotransposon AtSN1), widely used to monitor DNA methylation in Arabidopsis, confirmed that in plants exposed to decreased expression of the H1 genes there is a stochastic hyper- or hypomethylation, mostly in the CpG context, which is significantly in excess of the natural variability in methylation levels observed in control plants. The same is true for a randomly picked sequence.
Collectively, the results of our analysis of DNA methylation in plants exposed to downregulation of H1 genes, examining several types of DNA sequence located in different genomic subdomains, suggest that while the overall level of DNA methylation was not considerably changed, the methylation patterns of particular sequences could be significantly altered both positively and negatively in a stochastic manner. Given the fact that DNA methylation controls many aspects of plant growth and development, as documented by the effects of mutations in different DNA methyltransferases and DDM1, the impact of H1 depletion on Arabidopsis DNA methylation appears to correlate well with the pleiotropic and stochastic character of the observed morphological abnormalities.
Possible function of linker histones in chromatin:
In our analyses we examined the effects of the suppression of H1 genes only in surviving plants. In some of these plants the detectable amount of H1 mRNA was negligible (see, for example, Figure 3A, lane 4) compared to the normal physiological level. However, the turnover rate of H1, although significantly higher than that of the core histones (Rechsteiner et al. 1987), is still much lower than that of many enzymatic proteins or transcription factors. Thus, even a considerably reduced mRNA level may be sufficient to maintain a limited pool of H1 protein in the nucleus. Therefore, it cannot be excluded that an even greater reduction in H1 mRNA or a complete suppression of H1 genes, if it occurred in some of the embryos derived from the transformed germ-line cells, may have resulted in embryo lethality. Such an effect of a complete elimination of H1 appears to be quite plausible, given the severity of the phenotypes of some of the T0 transformants with strongly reduced H1 gene expression.
Both the pleiotropic character and the non-Mendelian pattern of inheritance of the phenotypic changes as well as the observed effects on DNA methylation suggest that downregulation of H1 interferes with mechanisms involving epigenetic phenomena. In Ascobolus the elimination of H1 resulted in hypermethylation of previously methylated DNA, although, unlike the situation described here, this change was not heritable and was strictly correlated with the lack of H1 (Barra et al. 2000). How can the effects observed in Arabidopsis be linked with the chromatin role of H1? While the presence of linker histones is not essential for chromatin folding into the 30-nm compact fiber, it seems that H1 may influence the intrinsic folding pathway of the chromatin filament by stabilizing a single ordered conformation (see Jerzmanowski 2004 for review). The H1-dependent higher-order chromatin structures have been shown to interfere with Swi/Snf-mediated nucleosome remodeling (Horn et al. 2002). Studies using reconstituted multi-nucleosome templates suggest that DNA methylation causes compaction of the chromatin fiber only in conjunction with the binding of linker histones to the fiber (Karymov et al. 2001). It is possible that an H1-stabilized ordered chromatin conformation is required for correct targeting of DNA and core histone modifications. Linker histones would thus act on the level of higher-order chromatin structures to maintain the precision of the epigenetic system. The nonallelic H1 variants, characteristic for chromatin of all higher eukaryotes, could provide this system with another level of subtle regulation.
Footnotes
Communicating editor: S. Henikoff
Acknowledgement
We thank John Gittins and Jan Brzeski for reading the manuscript and for comments; R. A. Martienssen, S. E. Jacobsen, and S. Swiezewski for PCR primers; and E. Richards for the DNA probe. This work was supported by Howard Hughes Medical Institute grant no. 55000312, the Polish Committee for Scientific Research grants no. 6PO4A 00320 and PBZ 089/P06/2003 and the Foundation for Polish Science grant no. 2/2000. A.T.W. is the recipient of a Warsaw University grant. The laboratory is supported by the Center of Excellence in Molecular Biotechnology.
References
Cao, X., and S. E. Jacobsen,
Chuang, C.-F., and E. M. Meyerowitz,
Fan, Y., T. Nikitina, E. M. Morin-Kensicki, J. Zhao, T. R. Magnuson et al.,
Finnegan, E. J., W. J. Peacock and E. S. Dennis,
Jerzmanowski, A., 2004 The linker histones, pp. 75–102 in Chromatin Structure and Dynamics: State-of-the-Art, edited by J. Zlatanova and S. H. Leuba. Elsevier, Amsterdam/New York.
Jerzmanowski, A., M. R. Przewloka and K. D. Grasser,
Kakutani, T., J. A. Jeddeloh, S. K. Flowers, K. Munakata and E. J. Richards,
Rechsteiner, M., S. Rogers and K. Rote,
Tian, L., and Z. J. Chen,
