


Abstract
Selection in which fitnesses vary with the changing genetic composition of the population may facilitate the maintenance of genetic diversity in a wide range of organisms. Here, a detailed theoretical investigation is made of a frequency-dependent selection model, in which fitnesses are based on pairwise interactions between the two phenotypes at a diploid, diallelic, autosomal locus with complete dominance. The allele frequency dynamics are fully delimited analytically, along with all possible shapes of the mean fitness function in terms of where it increases or decreases as a function of the current allele frequency in the population. These results in turn allow possibly the first complete characterization of the dynamical behavior by the mean fitness through time under frequency-dependent selection. Here the mean fitness (i) monotonically increases, (ii) monotonically decreases, (iii) initially increases and then decreases, or (iv) initially decreases and then increases as equilibrium is approached. We analytically derive the exact initial and fitness conditions that produce each dynamic and how often each arises. Computer simulations with random initial conditions and fitnesses reveal that the potential decline in mean fitness is not negligible; on average a net decrease occurs 20% of the time and reduces the mean fitness by >17%.
Avast amount of genetic variation is a striking hallmark of natural populations, whether we examine this variation at the level of proteins or DNA base pairs (see, e.g., Nevo 1978; Nei and Graur 1984; Graur and Li 2000; Hedrick 2000). It is often suggested that this variation is actively maintained by frequency-dependent selection, because in many empirical situations rare genetic types have higher fitnesses (Endler 1986; Clarke and Partridge 1988) and thus are protected from loss (Hamilton and Howard 1997; Hedrick 2000). In predator-prey situations, for instance, an uncommon form may be overlooked because it does not fit the predator's search image (e.g., Allen and Clarke 1968; Bantock et al. 1975; Allen et al. 1998) or avoided because it is a Batesian mimic of an unpalatable form that few others mimic (Mallet and Joron 1999). Similar advantages accrue to competitors when rare if they can use an underexploited resource (e.g., Benkman 1996). More generally, such negative frequency dependence arises in populations of many plants and animals simply because the performance of an individual is affected by its neighbors: individuals often have lower fitness when in association with conspecifics of the same or similar genotype (e.g., Antonovics and Ellstrand 1984; Cosmidis et al. 1999; Williams et al. 2000). Even the ability to find mates may be greater for rare types (e.g., Terzic et al. 1996). In short, frequency-dependent selection is ubiquitous.
Moreover, the potential of frequency-dependent selection to maintain genetic variability is in fact realized in many situations. For instance, pollinator-induced frequency-dependent selection is implicated in the maintenance of a two-allele flower-color polymorphism in natural populations of the morning glory (Ipomoea purpurea; Subramaniam and Rausher 2000). And the huge number of alleles in the self-incompatibility systems of many flowering plants (Clarke and Newbigin 1993) and the MHC complex in humans (Apanius et al. 1997) are the direct consequences of the advantage of being rare.
Nevertheless, the link between the frequency-dependent selection and genetic variation found in natural and experimental populations can be equivocal. For example, although the pathogenic stripe-rust fungus, Puccinia striiformis, induces frequency-dependent selection favoring rarer cultivars of wheat (Triticum aestivum), theoretical models imply that it is not sufficient to maintain this polymorphism (Brunet and Mundt 2000). And for both birds and fish, species subject to greater parasite pressure (and presumably stronger frequency-dependent selection) may not display greater levels of allozyme variation (Poulin et al. 2000a,b). Conversely, rarer types are sometimes at a disadvantage, as when passerine predators prefer rarer prey types at high artificial prey densities, which is the wrong sort of frequency dependence to maintain variation (Allen et al. 1998). There is thus still much to learn, both empirically and theoretically, about the true role of frequency-dependent selection in shaping the genetic structure of natural populations.
The theoretical understanding of frequency-dependent selection has been greatly advanced by the development of the “pairwise-interaction model” (hereafter PIM; Schutz et al. 1968; Allard and Adams 1969; Cockerham and Burrows 1971; Huang et al. 1971; Cockerham et al. 1972; Hedrick 1972, 1973; Asmussen and Basnayake 1990). This model considers a phenotype's (or genotype's) fitness to be the linear combination of its viability in pairwise interactions with each of the different phenotypes in the population, these interactions being weighted by the frequencies of the phenotypes. Crucially, this formulation encompasses a complete range of frequency-dependent selection schemes, from selection for rarity to selection for common types, as well as much more complex schemes and even, as a special case, constant selection. This completeness allows some valuable general statements to be made about frequency-dependent selection. Computer simulations by Asmussen and Basnayake (1990), for instance, showed that the general diallelic PIM has a significantly larger portion of parameter space leading to stable polymorphisms than does the constant-selection model (43% vs. 33%) and elucidated the extent to which various types of pairwise interactions enhance or reduce the potential to maintain variation. They also were able to confirm many of their key qualitative conclusions analytically for the special case of the symmetric PIM, in which the fitness of interacting individuals is determined primarily by their degree of genetic similarity.
In this article we continue this approach, examining the subclass of the general diallelic PIM in which one allele is completely dominant over the other. This model is a special case of the “general dominance” PIM considered by Cockerham et al. (1972), which merits detailed analysis in its own right due to its valuable biological and theoretical properties. It is also a limiting case of Lessard's (1984) one-locus multiple-allele two-phenotype model of frequency-dependent selection, in which each genotype can give rise to just one phenotype. (This case was not explicitly considered by Lessard 1984.) Indeed, the population-genetic PIM has a number of strong parallels with game-theoretic matrix models such as the prisoner's dilemma (Lessard 1984; Yi et al. 1999). The pairwise viabilities arising from the interaction between two phenotypes in the PIM are simply the payoffs of the different strategies of a matrix game model. However, although Mendelian inheritance may be incorporated into a game theoretic approach (Lessard 1984; Cressman 1988a), standard matrix game models are defined solely in terms of phenotypes and ignore the segregational effects of Mendelian inheritance. Consequently, as Yi et al. (1999) pointed out, the formal equivalence between these two classes of evolutionary models is restricted to haploid or autogamous populations.
Because of the ubiquity of frequency-dependent selection and the abundance of loci in which one allele is dominant over another, the dominant PIM has considerable biological relevance. First, in contrast to constant viability selection, where even partial dominance leads to fixation, the fully dominant PIM leads to a stable polymorphism for a wide range of selection parameters. Second, its convenient mathematical properties allow us to significantly extend our understanding of the effects of this important type of selection. As we show, this model permits a complete analytic characterization of both the allele frequency and mean fitness dynamics under frequency-dependent selection, including exactly when and how often the mean fitness has a net decrease through time and on average how large such changes are. The results represent the first formal assessment of the significance of the decline in mean fitness possible under ecologically realistic forms of selection.
THE DOMINANT PAIRWISE-INTERACTION MODEL
Note that this formulation includes classical constant viability selection with dominance as a special case (i.e., when di1 = di2 for i =1 and 2), as well as selection in favor of either rare or common types or even more general forms of frequency-dependent selection. Moreover, the allele-frequency dynamics in (1-6) are invariant to the use of relative or absolute fitnesses for the two phenotypes, and so we can assume without loss of generality that 0 ≤ dij ≤ 1 for all i and j.
EQUILIBRIUM STRUCTURE
Performing a local stability analysis (as in Asmussen and Basnayake 1990; see appendix a), we find that, despite the inherent asymmetry arising from dominance, fixation for either allele is locally stable when its phenotype has a higher fitness in the presence of an individual of its own phenotype than the alternate phenotype has in its presence (i.e., dii > dji). Conversely, when d12 > d22 and d21 > d11, each allele is protected from loss and the internal equilibrium given by (8) exists in (0, 1) and is locally stable. The PIM formulation of frequency-dependent selection thus not only can maintain diallelic genetic variation with complete dominance, but also ensures a stable polymorphism in a full 25% of the admissible parameter space for the four pairwise fitnesses. This finding is in sharp contrast to classical constant viability selection, which has no polymorphic equililibria, either stable or unstable, when one of the alleles is fully, or even partially, dominant. Altogether there are four possible equilibrium structures (SU, US, SUS, USU; U, unstable; S, locally stable), where, as in Asmussen and Basnayake (1990), the leftmost entry refers to the stability of p̂ = 0 and the rightmost to the stability of p̂ = 1. When present, the intermediate entry indicates the existence and stability of the polymorphic equilibrium p̂ defined in (8). The conditions under which each structure occurs are summarized in Table 1.
ALLELE-FREQUENCY DYNAMICS
Clearly, when d12 ≤ d22 and d21 ≥ d11 with at least one of the inequalities strict, Δp < 0 for all 0 < p < 1, ensuring that the allele frequency, pt, in generation t, monotonically decreases to 0 as t → ∞, after starting from any initially polymorphic value, p0. Similar reasoning shows that pt always monotonically increases to 1 as t → ∞ when both these pairwise fitness inequalities are reversed.
Allele-frequency behavior under the dominant PIM
| Fitness condition | Equilibrium patterna | Pattern incidence | Allele-frequency dynamicsb |
|---|---|---|---|
| d12 ≤ d22, d21 ≥ d11c | SU | 0.25 | pt ↓ 0 all 0 < p0 < 1 |
| d12 ≥ d22, d21 ≤ d11c | US | 0.25 | pt ↑ 1 all 0 < p0 < 1 |
| d12 < d22, d21 < d11 | SUS | 0.25 | |
| d12 > d22, d21 > d11 | USU | 0.25 |
Results are for the general model where d12 ≠ d21.
The leftmost entry refers to the stability of p̂ = 0 (U, unstable; S, locally stable), the rightmost to the stability of p̂ = 1. When present, the intermediate entry indicates the existence and stability of the polymorphic equilibrium p̂ defined in (8).
↑(↓) denotes a monotonically increasing (decreasing) sequence as t → ∞.
With at least one inequality strict.
The full range of qualitative dynamics for the allele frequency under the dominant PIM is summarized in Table 1. An immediate observation is that in all four possible cases, the allele frequency either monotonically increases or decreases to a locally stable equilibrium, just as in the classical constant viability selection model. Thus, although allele frequencies can cycle under other diallelic frequency-dependent models (Cressman 1988b; Altenberg 1991; Gavrilets and Hastings 1995), not even transient cycling occurs under the dominant PIM (or indeed the symmetric PIM; Asmussen and Basnayake 1990). Table 1 also shows that a locally stable equilibrium will also always be globally stable (i.e., reached from all initial allele frequencies), whenever there is only one such stable equilibrium, as with constant selection. In particular, an internal polymorphic equilibrium is globally stable whenever one exists and is locally stable. Last, this complete dynamical analysis shows that genetic variation will be maintained under the dominant PIM if and only if each phenotype has a higher fitness in unlike interactions than the other phenotype has when interacting with like individuals (dij > djj for i ≠j).
The dominant PIM is thus also similar to the codominant constant viability selection model in its ability to maintain a diallelic polymorphism, doing so in 25% vs. 33% of the respective parameter spaces. But, although this relatively small difference, along with the other strong parallels, might suggest that this form of frequency-dependent selection is equivalent in its effects to constant selection, we need to remember that these are comparisons between a dominant and a codominant model. Our results demonstrate that the frequency-dependent PIM actually has a considerably greater ability to maintain a diallelic polymorphism than does constant selection, since the latter with complete dominance inevitably leads to fixation for the phenotype with the higher fitness and the elimination of all genetic variation.
THE MEAN FITNESS FUNCTION
The dominant PIM is also one of the few diploid selection models, perhaps the only one other than the classical, constant viability selection model, for which the dynamical behavior of the mean fitness w̄t = w̄(pt) through time can also be fully characterized analytically. The detailed analysis possible here is especially valuable, as it has been realized for some time that the behavior of the mean fitness under frequency-dependent selection can be distinctly different from the simple, monotonic increase through time produced by constant selection (Cockerham et al. 1972). The complexity of such models, however, has hindered the ability to predict the full range of behavior and when each arises. The dominant PIM now allows us to do so for a general class of frequency-dependent models.
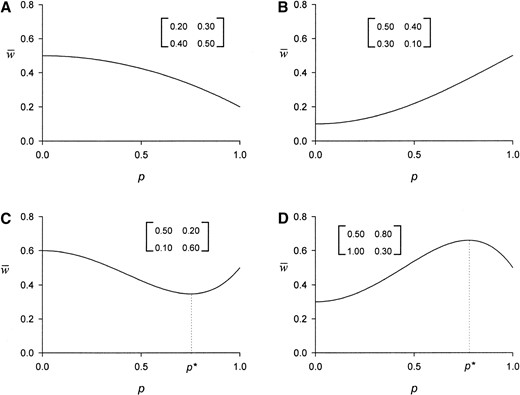
—Mean fitness, w̄(p), as a function of the frequency, p, of the recessive allele, A1, for four sets of pairwise fitnesses (dij) shown in the associated matrices. We characterize these respective shapes as (A) \, (B) /, (C) ∪, and (D) ∩. The critical point, p*, shown in C and D is defined in (11).
Shape of w(p): The full dynamical analysis in the subsequent section hinges on delimiting the possible shapes for the graph of w̄(p) as a static function of the current allele frequency p, in terms of where it increases and decreases over the interval [0, 1]. Combining this information with the known dynamics of the allele frequency (Table 1) then allows us to predict the dynamical behavior of the mean fitness in the population for each combination of pairwise fitnesses and initial conditions.
These shapes are the same as those for the codominant classical model, but the conditions under which they arise are significantly different for the two models. With constant viabilities the conditions for the four mean fitness graphs coincide with those that produce the four possible allele-frequency dynamics: \ occurs only with SU, / only with US, ∪ only with SUS, and ∩ only with USU, where in the last two cases w̄(p) has, respectively, an internal minimum or maximum at the polymorphic equilibrium. This direct, one-to-one correspondence ensures that for constant selection the mean fitness w̄t = w̄(pt) always steadily increases through time as the allele frequency pt monotonically increases or decreases to its final, equilibrium value.
The much more complicated dynamics with frequency-dependent selection arise in the dominant PIM because this simple link between allele-frequency dynamics and mean fitness graphs is absent. The first reason for this disassociation is that the critical value, p* in (11), for the mean fitness function w̄(p), if such exists, is not a polymorphic allele-frequency equilibrium for the population (except in the symmetrical case where d12 = d21). Thus, as for the general PIM without dominance (Cockerham et al. 1972), the allele frequency that maximizes the mean fitness when it has an internal maximum (Figure 1D) is not usually an equilibrium value, let alone a stable equilibrium. Since a population will always move away from a nonequilibrium value, this basic fact alone ensures that the mean fitness will decrease through time, at least transiently and at least for some initial conditions, under this form of frequency-dependent selection.
The second source of the more complicated mean fitness dynamics found here arises from the deviation between the pairwise fitness conditions for the four allele-frequency dynamics and those that determine the four shapes of w̄(p). The former depend on the relative fitness of each phenotype in unlike interactions vs. that of the other phenotype in like interactions (d12 vs. d22 and d21 vs. d11), whereas the latter are determined by the relative order of the two fitnesses in like interactions, d11 and d22, and the average fitness for the two phenotypes in unlike interactions, ½(d12 + d21).
If the average fitness in unlike interactions is intermediate between the two like × like fitnesses, w̄(p) will be a monotonic function over [0, 1]. The mean fitness steadily decreases as p increases from 0 to 1 (\) when interactions between two individuals of phenotype A1 have the lower fitness (i.e., d11 ≤ 1/2(d12 + d21) ≤ d22, with d11 < d22) and steadily increases (/) when two phenotype A1 individuals have the higher fitness (i.e., d22 ≤ 1/2(d12 + d21) ≤ d11, with d22 < d11). If, on average, unlike interactions instead confer either the strictly highest or lowest fitness, w̄(p) has a unique, critical point inside (0, 1) at the allele frequency p* defined in (11). The mean fitness decreases to a local and global minimum at p* (∪) if the average fitness in unlike interactions is less than both like × like fitnesses (i.e., 1/2(d12 + d21) < min{d11, d22}), and increases to a local and global maximum at p* (∩) if unlike interactions, on average, yield a higher fitness than like interactions (i.e., 1/2(d12 + d21) > max{d11, d22}).
Incidence of w(p) shapes: The new fitness conditions giving the four possible shapes for the graph of w̄(p) over [0, 1] do not occur equally often, in contrast to classical constant selection. The exact size of the region in pairwise fitness space producing each graph is calculated analytically in appendix c, assuming the four pairwise fitnesses are independently and uniformly distributed over [0, 1]. The two monotonic graphs (\ and /) are least frequent (with each produced by 21% of the pairwise fitness sets), and the two mean fitness graphs with an internal minimum or maximum are most frequent (with each produced by 29% of the fitness sets). We see in the subsequent section that this fairly small skew from equal frequencies nonetheless yields a substantive potential for “nonstandard” dynamical behavior.
The disassociation between the conditions that determine the allelic dynamics and those that govern the shapes of the mean fitness graph as a function of the current allele frequency allows 14 of the 16 possible combinations of allele-frequency trajectories and mean fitness graphs to occur under the dominant PIM form of frequency-dependent selection. The only combinations that do not exist are SUS with ∩ and USU with ∪. The fraction of pairwise fitness sets that produce each possible combination under the dominant PIM is readily calculated analytically via multiple integrals ( appendix c) and reported in Table 2. The most common combinations by far are the (only) four under the classical model (the diagonal entries of Table 2), which are each produced by 15-21% of the pairwise fitness sets (vs. 25% of the time each for constant viabilities). Moreover, for each allele-frequency behavior (each row of Table 2), the unique mean fitness graph under the classical model is also the most common one under the dominant PIM, occurring 58% of the time when a fixation equilibrium is globally stable (SU or US) and 83% of the time when there is either a stable or an unstable polymorphic equilibrium (SUS or USU). However, the 10 new “nonclassical” combinations still arise with substantive frequency, totaling nearly one-third (29%) of the overall fitness space, with individual frequencies ranging from 2 to 4%. Moreover, for every allele-frequency dynamic, between 8 and 17% of the possible pairwise fitnesses lead to nonstandard mean fitness graphs.
DYNAMICS OF THE MEAN FITNESS
We can now predict the precise qualitative dynamics for w̄t = w̄(pt) through time for every combination of pairwise fitnesses and initial conditions of the dominant PIM by overlaying the expected allele-frequency dynamics from Table 1 on each allowed graph of the mean fitness as a function of the current allele frequency p (Figure 1). Suppose, for instance, that the allele frequency pt steadily decreases to 0 through time (i.e., pt 0 as ↓ t → ∞) and that the mean fitness function w̄(p) increases as a function of p as p increases across [0, 1] (i.e., fl); then from every initially polymorphic allele frequency (p0), w̄t = w̄(pt) necessarily steadily decreases in every subsequent generation as it approaches its equilibrium value, w̄(0) = d22. This combination of allelic and mean fitness behaviors arises whenever the mean fitness is monotonically increasing as a function of p (/) and either (i) fixation for the recessive allele (p̂ = 0) is globally stable (SU) or (ii) both fixation equilibria are locally stable (SUS) and the frequency of the dominant allele is initially below its unstable polymorphic equilibrium value (p0 < p̂).
Both multiple and more complicated mean fitness dynamics are possible under the dominant PIM when the mean fitness in the population is minimized (∪) or maximized (∩) at a polymorphic allele frequency. Consider, for example, a population whose pairwise fitnesses are such that pt steadily decreases to 0 through time, and w̄(p) has the shape ∪ and a minimum at the polymorphic critical point p* in (11). In this situation, the dynamics of w̄t = w̄(pt) through time will depend on the initial allele frequency p0. If p0 is at or below p*, w̄t will monotonically increase to w̄(0) = d22 as pt ↓ 0; if, however, the allele frequency is initially above the critical point p*, w̄t will instead first decrease to w̄* = w̄(p*) and then increase to w̄(0) = d22 as equilibrium is approached. Similar reasoning yields the dynamical
Incidence of each combination of allele-frequency dynamics and graph of the mean fitness function w̄(p) under the dominant PIM
| Shape of w̄(p) as a function of p across [0, 1] | ||||
|---|---|---|---|---|
| Allele dynamics | \ | / | ||
| SU (pt ↓ 0) | 0.146 (58%) | 0.021 (8%) | 0.042 (17%) | 0.042 (17%) |
| US (pt ↑ 1) | 0.021 (8%) | 0.146 (58%) | 0.042 (17%) | 0.042 (17%) |
| SUS (pt ↓ 0 or ↑ 1) | 0.021 (8%) | 0.021 (8%) | 0.208 (83%) | 0 |
| USU (pt → p̂) | 0.021 (8%) | 0.021 (8%) | 0 | 0.208 (83%) |
| Total | 0.208 | 0.208 | 0.292 | 0.292 |
The fraction of the pairwise fitness space producing each combination of allele-frequency dynamics and mean fitness graph, followed by the percentage of time each mean fitness graph occurs for the allele behavior in that row, for the general model where d12 ≠ d21 is shown. The four possible shapes of w̄(p) are represented schematically, corresponding to graphs that steadily decrease (\), steadily increase (/), first decrease and then increase (), or first increase and then decrease () as p increases from 0 to 1. These shapes occur, respectively, when d11 ≤ (d12 + d21)/2 ≤ d22 and d11 ≠ d22, d22 ≤ (d12 + d21)/2 ≤ d11 and d11 ≠ d22, (d12 + d21)/2 < min(d11, d22), and (d12 + d21)/2 > max(d11, d22). Each allele-frequency pattern occurs in 25% of the pairwise fitness space.
behavior of the mean fitness for all other possible combinations of allele-frequency trajectories and mean fitness graphs and thus for all possible pairwise fitnesses and initial conditions, as summarized in Table 3.
This full dynamical analysis shows that the mean fitness has exactly four possible dynamical behaviors under the dominant PIM: w̄t can (i) increase in every generation as with constant selection (which we denote as ↑), (ii) first increase to a transient maximum and then decrease until equilibrium is reached (↑, ↓), (iii) first decrease a transient minimum and then increase (↓, ↑), or (iv) decrease in every generation (↓). Moreover, all four mean fitness dynamics are possible in populations converging to fixation for either the recessive or the dominant allele, and all but that with an initial decrease followed by an increase (↓, ↑) are possible in populations converging to a stable polymorphism.
Incidence of wt behaviors: The existence of nonstandard mean-fitness behavior under the dominant PIM is now clearly established, but how often may it actually occur? A first, tantalizing indicator is that only 2 of the 14 admissible combinations of allele-frequency dynamics and mean fitness graph in Table 3 ensure a “classical” monotonic increase in the mean fitness in every generation from every initial allele frequency: SU with \ and US with /. Returning to Table 2, we see that together these behaviors occur in just 29% of the parameter space. Hence, for 71% of the possible sets of pairwise fitness values, at least some initial allele frequencies allow the mean fitness to decrease for at least one generation. Interestingly, such nonstandard behavior is possible for just 42% of the pairwise fitness sets for which fixation for the recessive or dominant allele is globally stable (SU or US), but for all of the pairwise fitness sets that produce either a stable or an unstable polymorphic equilibrium (SUS or USU). Populations going to a stable polymorphism thus have a higher potential for at least a temporary decrease in mean fitness than those in which genetic variation is being eliminated by selection.
A second, more precise measure of the potential for nonstandard mean fitness dynamics in the dominant PIM is given by the overall fraction of fitness sets and initial allele frequencies giving rise to each of the four possible mean fitness dynamics. These key statistics can also be calculated analytically by decomposing those combinations of allele-frequency dynamics and mean fitness graphs whose mean fitness dynamics depend on the initial conditions, as outlined in appendix c. The results for each of these partitions are reported in Table 3.
The compilation of the four potential dynamics of w̄t in Table 4 shows that in fact each occurs significantly often. Overall, the “standard” behavior, where the mean fitness increases each generation, is still the most common, occurring for ∼65% of initial conditions and pairwise fitness parameters. Nonetheless, in over one-third of trajectories, the mean fitness decreases for at least one generation. Indeed, the mean fitness decreases in every generation 14% of the time. The two nonmonotonic dynamics together occur 21% of the time, but with a final decrease (↑, ↓) more than twice as likely as an initial decrease (↓, ↑). Populations going to fixation have fairly similar distributions of mean fitness dynamics and, in keeping with their relative potentials for nonstandard mean fitness graphs, are most likely to have a steady increase in mean fitness along the way (73%). Populations approaching a stable polymorphism are much less likely to have a steady increase of their mean fitness (43%) and are the most likely to show a steady decline (20%).
Dynamical behavior of the mean fitness w̄t = w̄(pt) through time under the dominant PIM
| Shape of w̄(p) as a function of p across [0, 1] | ||||||
|---|---|---|---|---|---|---|
| Allele dynamics | \ | / | ||||
| SU | ||||||
| pt ↓ 0 | ↑ 0.146 | ↓ 0.021 | ↑ 0.033a | ↓ 0.023a | ||
| ↓, ↑ 0.009b | ↑, ↓ 0.019b | |||||
| US | ||||||
| pt ↑ 1 | ↓ 0.021 | ↑ 0.146 | ↓, ↑ 0.023c | ↑, ↓ 0.033c | ||
| ↑ 0.019d | ↓ 0.009d | |||||
| SUS | d12 > d21 | d12 < d21 | ||||
| p0 < p̂:pt ↓ 0 | ↑ 0.016 | ↓ 0.012 | ↑ 0.060 | ↑ 0.066a | N/A | |
| ↓, ↑ 0.015e | ||||||
| p0 > p̂:pt ↑ 1 | ↓ 0.005 | ↑ 0.009 | ↑, ↓ 0.017f | ↑ 0.023 | N/A | |
| ↑ 0.028d | ||||||
| USU | d12 > d21 | d12 < d21 | ||||
| ↑, ↓ 0.066c | ||||||
| p0 < p̂:pt ↑ p̂ | ↓ 0.012 | ↑ 0.016 | N/A | ↑ 0.060 | ||
| ↓ 0.015g | ↓ 0.0l7h | |||||
| p0 > p̂:pt ↓ p̂ | ↑ 0.009 | ↓ 0.005 | N/A | ↑ 0.023 | ||
| ↑, ↓ 0.028b | ||||||
The dynamical behavior of w̄t through time is delimited for each possible combination of allele-frequency dynamics and mean fitness graph (represented as in Table 2) when d12 ≠ d21, where ↑ indicates that w̄t monotonically increases as t → ∞; and ↑, ↓ indicates w̄t first monotonically increases, then monotonically decreases as t → ∞, etc. Numerical entries give the fraction of random pairwise fitnesses and initial conditions with the specified dynamics for pt and w̄t. The mean fitness w̄t ultimately reaches d22 when pt ↓ 0, d11 when pt ↑ 1, and in (10) when pt → p̂, where p̂ is the polymorphic equilibrium in (8). The minimum of w̄t through time when w̄t ↓, ↑ and the maximum when w̄t ↑, ↓ are w̄* = w̄(p*), where p = p* is the polymorphic critical point defined in (11).
p0 ≤ p*.
p0 > p*.
p0 < p*.
p0 ≥ p*.
p* < p0 < p̂.
p̂ < p0 < p*.
p* < p0 < p̂.
p̂ < p0 ≤ p*.
Quantifying the change in wt: Our model of frequency-dependent selection clearly has a fairly high potential for nonstandard dynamics by the mean fitness, especially when pairwise interactions serve to maintain the genetic variation in the population. Another practical issue is the fraction of fitness sets and initial allele frequencies for which the mean fitness shows a net increase or decrease over time and how large on average such changes are. These final calculations are complicated by the need to predict the net change in those trajectories where the mean fitness has a nonmonotonic dynamic. Because the many subcases make it impractical to set up the necessary integrals analytically, we instead used computer simulations with 107 sets of pseudorandom pairwise fitnesses (dij) and initial allele frequencies (p0), all generated from a uniform distribution over [0, 1] via the algorithm of Marsaglia et al. (1990). The net change in mean fitness at equilibrium was assessed by comparing the initial value, w̄0 = w̄(p0), to that at the analytically predicted allele-frequency equilibrium, with results shown in Table 5.
On average, the mean fitness shows a net increase 80% of the time. Paralleling their relative potential for nonstandard dynamics, a net increase is most likely in populations going to fixation (83%) and least likely in populations in which genetic variation is maintained (69%). The mean fitness tends to double (100% gain) by equilibrium when it shows a net gain, and the biggest average increase is found when the recessive allele is ultimately fixed (170% gain) and the smallest when the dominant allele is fixed (40% gain). This difference arises because, with random initial allele frequencies, fixation of the recessive allele leads to a greater change in the frequency of the two phenotypes, and, since the mean fitness (6) is essentially a function of the phenotype frequencies, it changes more. Populations converging to a polymorphic equilibrium will, on average, have an intermediate, net increase of 108% in their mean
Incidence of each mean fitness dynamic under the dominant PIM
| Qualitative dynamics for the mean fitness w̄t = w̄(pt)a | |||||
|---|---|---|---|---|---|
| Equilibrium reached | w̄t ↑ | w̄t ↑, ↓ | w̄t ↓, ↑ | w̄t ↓ | Total |
| Fixation for dominantb | 0.321 (77%) | 0.019 (5%) | 0.024 (6%) | 0.055 (13%) | 0.419 |
| Fixation for recessivec | 0.224 (68%) | 0.033 (10%) | 0.040 (12%) | 0.035 (11%) | 0.331 |
| Fixationd | 0.545 (73%) | 0.052 (7%) | 0.063 (8%) | 0.090 (12%) | 0.750 |
| Polymorphisme | 0.107 (43%) | 0.094 (38%) | 0 | 0.049 (20%) | 0.250 |
| Total | 0.652 | 0.146 | 0.063 | 0.139 | 1.0 |
Entries represent the fraction of random pairwise fitnesses and initial conditions with the specified behavior by the allele frequency and mean fitness in the population when d12 ≠ d21. Percentages are the relative incidence of each mean fitness dynamic for the allelic equilibrium in that row.
↑(↓) denotes a monotonically increasing (decreasing) sequence as t → ∞; ↑, ↓ denotes a sequence that first monotonically increases and then monotonically decreases as t → ∞, etc.
All cases in Table 1 with an SU pattern, plus those with an SUS pattern and p0 < p̂.
All cases in Table 1 with a US pattern, plus those with an SUS pattern and p0 > p̂.
All cases in Table 1 with a US, SU, or SUS pattern.
All cases in Table 1 with a USU pattern.
fitness. By comparison, the mean fitness always increases in the classical constant viability selection model and, on average, has a smaller net increase of just 69% at equilibrium, with populations going to fixation again having the highest net gain (84%) and populations going to a polymorphic equilibrium the lowest (39%).
Although the standard outcome of a net increase in mean fitness is still also the norm for the dominant PIM, net decreases in mean fitness nonetheless occur with reasonably substantive frequency and magnitudes. On average, the mean fitness shows a net decrease 20% of the time, and when this occurs the equilibrium mean fitness is ∼17% below the initial value in the population. This smaller proportional change with a net loss is not directly comparable to the average net gains and is to be expected because the denominator in the ratio is now larger. The mean fitness has a slightly larger average proportional decrease in populations that become fixed for the recessive allele (24%) and a slightly smaller decrease in those that go to fixation for the dominant allele (14%) for the same reason as before.
Sample population trajectories: An idea of the range of mean fitness dynamics for the dominant PIM can be gained from the four pairs of graphs in Figure 2, which shows two sets of allele and mean fitness dynamics for each of the four possible equilibrium patterns for the allele frequency (SU, US, SUS, and USU). The variation within each pair (e.g., Figure 2A vs. 2B) emphasizes how two populations can exhibit dramatically different dynamical behavior by their mean fitnesses even though their allele frequencies follow very similar trajectories. Taken as a whole, Figure 2 illustrates the high variation in the change in mean fitness when populations are initialized far from their equilibrium state. For example, the two cases where w̄t monotonically increases (Figure 2, A and C) lead to a 50-80% net gain in the mean fitness at equilibrium, while the two cases where w̄t monotonically decreases (Figure 2, E and H) lead to a net loss of 27-35%.
The other four graphs illustrate the extremely variable behavior in cases with nonmonotonic mean fitness dynamics, which range here from a 10% net increase (Figure 2F) to a 50% net decrease (Figure 2G) to essentially no net change (Figure 2, B and D). Moreover, the final net change in mean fitness in such populations is no gauge of what has happened during the approach to equilibrium, since each of these graphs has a significant, transient increase or decrease; simulations show that such behavior is fairly typical, in that populations with a nonmonotonic mean fitness dynamic will, on average, increase their mean fitness by 30-100% during the upward portion of the trajectory and decrease it by 10% during the downward portion, whichever portion comes first and whichever type of allelic equilibrium is being approached. Last, the two bottom graphs with a stable internal equilibrium (Figure 2, G and H) confirm what is perhaps the most surprising discovery, namely that the mean fitness can incur a substantial net drop (28-53%) even when the population converges to a polymorphic equilibrium allele frequency.
DISCUSSION
This study describes a diallelic model of frequency-dependent selection with dominance, which is a special case of the PIM (Cockerham et al. 1972; Asmussen and Basnayake 1990) and a limiting case of Lessard's (1984) two-phenotype model. Despite its apparent simplicity, the dominant PIM has a number of surprising and valuable properties, the most notable being that it
Net change in the mean fitness through time under the dominant PIM
| Net increase | Net decrease | |||||
|---|---|---|---|---|---|---|
| Equilibrium | Incidence | Incidence | ||||
| Fixation for dominant | 0.834 | 0.138 | 1.41 | 0.166 | –0.060 | 0.857 |
| Fixation for recessive | 0.832 | 0.275 | 2.67 | 0.168 | –0.123 | 0.755 |
| Fixation | 0.833 (1.0) | 0.199 (0.222) | 1.97 (1.84) | 0.167 | –0.088 | 0.811 |
| Polymorphism | 0.692 (1.0) | 0.142 (0.097) | 2.08 (1.39) | 0.308 | –0.067 | 0.846 |
| Total | 0.798 (1.0) | 0.186 (0.180) | 1.99 (1.69) | 0.202 | –0.080 | 0.825 |
The fraction of random pairwise fitnesses and initial conditions giving a net increase or decrease in the mean fitness w̄t through time between its initial (w̄0) and equilibrium values and the corresponding average additive and multiplicative changes in mean fitness along the trajectory, for each allelic equilibrium reached, are shown. Results apply to the general dominant PIM where d12 ≠ d21. Where applicable, the corresponding values for the classical model of constant viability selection are given in parentheses.
is one of the very few selection regimes, for which, like the classical constant viability model, we can readily predict the full qualitative dynamics of both the allele frequency and the mean fitness through time. This dual characterization reveals that, depending on the fitness parameters and the initial allele frequency, over time the mean fitness can (i) decrease monotonically, (ii) decrease monotonically to a minimum before increasing monotonically, or (iii) increase monotonically to a maximum before decreasing monotonically, as well as display the well-known monotonic increase of the standard constant viability model.
The three nonstandard dynamics for the mean fitness are not generated by any unusual allele-frequency trajectories or shapes for the mean fitness graph because, as with classical constant viability selection, the allele frequency always approaches an equilibrium monotonically and the mean fitness function has the same four basic shapes. Rather, they are generated by the disassociation between the fitness conditions on like and unlike interactions that determine the dynamics of the allele frequency and those that govern the shape of the graph of the mean fitness as a function of the allele frequency.
Our calculations show that at least transient decreases in mean fitness occur in over one-third of the trajectories, and they happen every generation for one in seven sets of random fitness values and initial conditions. Interestingly, a decrease is particularly common in populations converging to a polymorphic equilibrium, happening in at least one generation well over half the time, compared to about one-quarter of the time for populations en route to fixation. Moreover, we show that net decreases in mean fitness (from initial to equilibrium value) are not, on average, negligible: overall they occur a fifth of the time and result in a mean net decrease of ∼17%, whatever allelic equilibrium is approached. We emphasize that, in using random fitness sets and initial allele frequencies to calculate the incidence of particular dynamics or the size of changes in mean fitness, we are not arguing that these results reflect the incidence in nature. Such measures would depend on the actual biological distributions of fitnesses and allele frequencies, which are unknown. Rather, our statistics, which measure the relative sizes of different parts of parameter space, are used to gain insight into the potential for various phenomena to occur in this system. For a fuller discussion of this issue see Marks and Spencer (1991).
The allelic behavior in this new model is dramatically different from that under constant viability selection with dominance, since not only is variation preserved, but also this maintenance occurs in 25% of parameter space, whenever each phenotype has a higher fitness in unlike interactions than the other phenotype has with like individuals. The classical model, by contrast, always eliminates genetic variation if there is even partial dominance. In fact, in terms of equilibrium structure, the dominant PIM closely parallels that for the codominant classical selection model without dominance, which maintains variation in one-third of parameter space. In each case, there is a stable polymorphism with both alleles present if and only if both fixation equililibria are unstable. There is even an intriguing connection between the equilibrium values under the two formulations.
Similar close parallels are found in the stability conditions for the three potential equilibria for the two models, with conditions on the constant allelic interactions in the classical model (i.e., the fitness of heterozygotes with two unlike alleles vs. those of the two homozygotes with two like alleles) replaced by similar conditions on the frequency-dependent phenotypic interactions in the PIM (i.e., the pairwise fitnesses for phenotypes in like vs. unlike interactions). The four potential allelic dynamics and equilibrium patterns, as well as their conditions shown in Table 1 for the dominant PIM, correspond, respectively, to those for constant selection on a codominant locus that is directional favoring allele A2 (w̄11 ≤ w̄12 ≤ w̄22, yielding SU), directional favoring allele A1 (w22 ≤ w12 ≤ w11, yielding US), underdominant (w12 < w11, w22, SUS), and overdominant (w12 > w11, w22, yielding USU), where wij is the viability of genotype AiAj. Under the dominant PIM, however, each equilibrium pattern is equally likely in the sense of occurring in one-quarter of the parameter space for the four pairwise fitnesses {0 ≤ dij ≤ 1, for i, j = 1, 2}, whereas in the codominant classical model the two equilibrium outcomes with an internal equilibrium each occur in one-third and the two fixation equilibria in only one-sixth of the fitness space for the viabilities of the three genotypes {0 ≤ wij ≤ 1, for i ≤ j = 1, 2}.
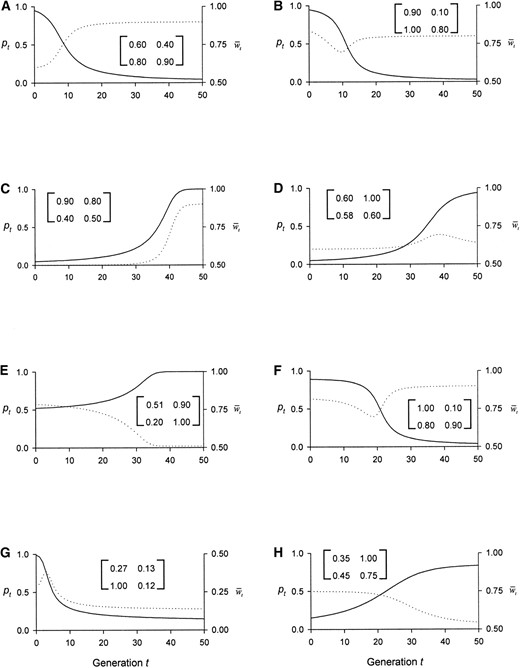
—Dynamics of the frequency, pt, of the recessive allele, A1, (solid line) and the mean fitness, w̄t, (dotted line) for eight sets of pairwise fitnesses, each shown in the associated matrix. These values lead to the respective equilibrium patterns and shapes of w̄(p) (see Table 2) of (A) SU and \, (B) SU and ∪, (C) US and /, (D) US and ∩, (E) SUS and \, (F) SUS and ∪, (G) USU and ∩, and (H) USU and /.
Although not explicitly analyzed here, the symmetric dominant PIM, where both interacting individuals have the same fitness (d12 = d21), is even more similar to the classical model than is the general dominant PIM considered here in which the two phenotypes have distinct fitnesses in unlike interactions (d12 ≠ d21). The relative order of the three pairwise fitnesses determines the allele frequency dynamics and mean fitness graphs (and a one-to-one correspondence between them) in exactly the same way that the three genotypic viabilities do in the classical model. Genetic variation is thus maintained in the symmetric dominant PIM if and only if the fitness in unlike interactions is greater than that in both like interactions (d12 > d11, d22), which is 33.3% of the possible pairwise fitness sets (rather than the 25% of the general dominant PIM), and the mean fitness always monotonically increases through time as the allele frequency monotonically approaches equilibrium.
In conclusion, this investigation reveals that a simple, biologically plausible model of frequency-dependent selection can frequently (i) maintain significant genetic variation with complete dominance and (ii) display nonintuitive behavior of the mean fitness in the population. We note that this latter phenomenon is not confined to theoretical models: mean fitness decreased in experiments with the RNA phage φ6, which interacted according to the prisoner's dilemma of game theory (Turner and Chao 1999), formally equivalent to an asexual or haploid version of the PIM. Although it has long been known that mean fitness might decrease (e.g., Cockerham et al. 1972), we show explicitly how, in an ecologically realistic model, this behavior arises from the decoupling of the conditions governing allele-frequency dynamics and those determining the shape of the mean fitness as a function of allele frequency. Non-hill-climbing evolution and frequency-dependent selection may thus play an even greater role in shaping the genetic structure of natural populations than has previously been realized.
APPENDIX A: LOCAL STABILITY ANALYSIS FOR THE DOMINANT PIM
We first find that the Jacobian dp′/dp = d21/d11 at p̂ = 1, and thus fixation for the recessive allele A1 is locally stable if d21 < d11. The standard derivative-based approach breaks down at p̂ = 0, where dp′/dp = d22/d22 = 1, but we can easily circumvent this problem by realizing that fixation for the dominant allele is locally stable if and only if Δp in (7) is negative near p = 0, which requires d12 < d22.
APPENDIX B: DERIVATION OF MEAN FITNESS GRAPHS AS A FUNCTION OF p UNDER THE DOMINANT PIM
In the simplest case where A = 0, w̄(p) monotonically decreases across [0, 1] if B < 0, monotonically increases if B > 0, and is constant in the unlikely event that A = B = 0.
In the more general case where A ≠ 0, the graph of w̄(p) has four possible shapes. When C ≤ 0, w̄(p) decreases across [0, 1] if A > 0 and increases if A < 0. These properties are reversed when C ≥ 1. In the remaining case (0 < C < 1), w̄′(p) changes sign at p = p* = √C, where p* is the unique critical point in (0, 1), giving w̄(p) a minimum at p* if A < 0 (Figure 1C) and a maximum there if A > 0 (Figure 1D). Together, these results show that when A ≠ 0, w̄(p) will (i) monotonically decrease across [0, 1] if B ≤ min {0, 2A}, (ii) monotonically increase across [0, 1] if B ≥ max{0, 2A}, (iii) decrease to a minimum at the polymorphic allele frequency p* and then increase if 2A < B < 0, or (iv) increase to a maximum at p* and then decrease if 0 < B < 2A.
Finally, substituting the definitions of A and B above yields the pairwise fitness conditions for each of the four possible graphs of the mean fitness under the dominant PIM shown in Figure 1.
APPENDIX C: INCIDENCE OF THE MEAN FITNESS GRAPHS AND ALLELE-FREQUENCY DYNAMICS UNDER THE DOMINANT PIM
The precise fraction of the pairwise fitness sets that produce each mean fitness graph in Figure 1 and each of the 14 possible combinations of mean fitness graph and allele-frequency dynamics in Table 2 can be calculated analytically by assuming that the four fitness parameters (dij) are independent and uniformly distributed over the interval [0, 1] and integrating the uniform density function 1 over the appropriate four-dimensional region.
Table C1 provides the limits of integration for each integral, along with its analytically derived numerical value, which was also verified via Mathematica. Note that we omit the Leibniz infinitesimal notation to save space, and in each case integration proceeds from right to left, i.e., first with respect to d22, then with respect to d11, etc. The shape of w̄(p) is denoted schematically as in Table 2.
The partition of those combinations in Table 3 whose mean fitness dynamics vary with the initial allele frequency p0 is achieved in a similar fashion by including p0 with the four pairwise fitnesses as another independent, uniformly distributed variable over [0, 1], with the additional requirement, where relevant, that p0 lie in the appropriate interval delimited by the polymorphic equilibrium p̂ in (8) and/or the polymorphic critical point p* in (11). The resulting quintuple integrals were evaluated analytically by Mathematica and verified by computer simulation, with 107 sets of dij and p0, all generated from a uniform distribution over [0, 1] via the algorithm of Marsaglia et al. (1990). Each of these sets was then classified by its allele dynamics and mean fitness behavior predicted by the analytical results above.
Limits of integration for w̄(p) and joint classifications for pt, and w̄(p) in Table 2
| pt | w̄(p) | d 12 | d 21 | d 11 | d 22 | Result |
|---|---|---|---|---|---|---|
| \ | [0, 1] | [0, 1] | [0, d̄] | [d̄, 1] | 5/24 | |
| / | [0, 1] | [0, 1] | [d̄, 1] | [0, d̄] | 5/24 | |
| [0, 1] | [0, 1] | [d̄, 1] | [d̄, 1] | 7/24 | ||
| [0, 1] | [0, 1] | [0, d̄] | [0, d̄] | 7/24 | ||
| SU | \ | [0, 1] | [0, d12] | [0, d21] | [d12,1] | |
| [0, 1] | [d12, 1] | [0, d̄] | [d̄, 1] | 7/48 | ||
| SU | / | [0, 1] | [d12,1] | [d̄, d21] | [d12, d̄] | 1/48 |
| SU | [0, 1] | [d12, 1] | [d̄, d21] | [d̄, 1] | 1/24 | |
| SU | [0, 1] | [d12, 1] | [0, d̄] | [d12, d̄] | 1/24 | |
| US | \ | [0, 1] | [0, d12] | [d21, d̄] | [d̄, d12] | 1/48 |
| US | / | [0, 1] | [0, d12] | [d̄, 1] | [0, d̄] | |
| [0, 1] | [d12,1] | [d12, 1] | [0, d12] | 7/48 | ||
| US | [0, 1] | [0, d12] | [d̄, 1] | [d̄, d12] | 1/24 | |
| US | [0, 1] | [0, d12] | [d21, d̄] | [0, d̄] | 1/24 | |
| SUS | \ | [0, 1] | [0, d12] | [d21, d̄] | [d12, 1] | 1/48 |
| SUS | / | [0, 1] | [d12,1] | [d21,1] | [d12, d̄] | 1/48 |
| SUS | [0, 1] | [0, d12] | [d̄, 1] | [d12, 1] | ||
| [0, 1] | [d12, 1] | [d21, 1] | [d̄, 1] | 5/24 | ||
| USU | \ | [0, 1] | [0, d12] | [0, d21] | [d̄, d12] | 1/48 |
| USU | / | [0, 1] | [d12, 1] | [d̄, d21] | [0, d12] | 1/48 |
| USU | [0, 1] | [0, d12] | [0, d21] | [0, d̄] | ||
| [0, 1] | [d12, 1] | [0, d̄] | [0, d12] | 5/24 |
Integration proceeds from right to left, i.e., first with respect to d22, and then with respect to d11, d21, and d12. In instances where the sum of two integrals needs to be computed, their limits of integration are given in successive lines. The average of the two unlike pairwise fitnesses is denoted by d̄ = ½ (d12 + d21).
Footnotes
R.A.C. and H.G.S. affectionately dedicate this article to the memory of Marjorie A. Asmussen, who died January 19, 2004.
Communicating editor: M. Feldman
Acknowledgement
We thank two anonymous reviewers for their helpful comments. This work was supported by a University of Otago William Evans Fellowship (M.A.A.), National Science Foundation (NSF) grant DEB-9906462 (M.A.A.), an NSF Predoctoral Fellowship (R.A.C.), and grants from the University of Otago Research Committee (H.G.S.) and the New Zealand/United States Scientific and Technological Cooperative Science Program of the 1999/2000 International Science and Technology Linkages Fund (H.G.S.).
LITERATURE CITED
