


Abstract
The relative importance of gross chromosomal rearrangements to adaptive evolution has not been precisely defined. The Saccharomyces cerevisiae flor yeast strains offer significant advantages for the study of molecular evolution since they have recently evolved to a high degree of specialization in a very restrictive environment. Using DNA microarray technology, we have compared the genomes of two prominent variants of S. cerevisiae flor yeast strains. The strains differ from one another in the DNA copy number of 116 genomic regions that comprise 38% of the genome. In most cases, these regions are amplicons flanked by repeated sequences or other recombination hotspots previously described as regions where double-strand breaks occur. The presence of genes that confer specific characteristics to the flor yeast within the amplicons supports the role of chromosomal rearrangements as a major mechanism of adaptive evolution in S. cerevisiae. We propose that nonallelic interactions are enhanced by ethanol- and acetaldehyde-induced double-strand breaks in the chromosomal DNA, which are repaired by pathways that yield gross chromosomal rearrangements. This mechanism of chromosomal evolution could also account for the sexual isolation shown among the flor yeast.
GENETIC research on industrial Saccharomyces cerevisiae yeast strains has yielded data indicating that these yeasts are capable of rapidly adapting to the special environmental conditions that are found in industrial processes (Mortimer 2000). This characteristic makes industrial yeast particularly useful for genomic studies on adaptive evolution. Moreover, the acquisition of very specialized phenotypes by individual strains as a result of the high selective pressure (Adams et al. 1992; Benítez et al. 1996) and the extremely low level of both sporulation frequency and fertility described between different strains (Guijo et al. 1997; Budroni et al. 2000; Puig et al. 2000) indicate that industrial yeast provides an excellent opportunity for studies on processes related to speciation. The characterization of chromosomal translocations in the genomes of laboratory strains that represent six of the seven closely related species in the Saccharomyces sensu stricto complex identified one nonreciprocal and nine reciprocal translocations, involving 13 of the 16 Saccharomyces sp. chromosomes (Fischer et al. 2000). The relative importance of such chromosomal rearrangements among the potential mechanisms of genome evolution and speciation has been recently highlighted in a study by Delneri et al. (2003). They engineered the genome of a S. cerevisiae strain to make it colinear with that of two different S. mikatae strains, notably increasing the proportion of viable, albeit aneuploid spores after interspecies crosses. The widespread aneuploidy observed in the fertile hybrids, which resulted from these colinear interspecific crosses, has been proposed to enhance the sexual isolation needed for the genetic divergence between different strains. These studies have also shown that the rate of formation of chromosomal rearrangements in Saccharomyces is not constant. The authors suggest that bursts of translocations have occurred at given points during yeast genome evolution (Fischer et al. 2000). As an explanation accounting for this observation, they propose that, during adaptation to a new environment, a mutator strain defective in a system controlling the level of ectopic recombination (leading to a high level of chromosomal rearrangements) is selected, as has been observed in the experimental evolution of Escherichia coli (Sniegowski et al. 1997).
A common characteristic of industrial yeast is highly polymorphic chromosomes (Codón et al. 1998). Indeed, polymorphisms in electrophoretic chromosomal patterns have been used to classify industrial strains that belong to the same species (Mesa et al. 1999, 2000). Widespread mutations affecting the genetic constitution of wine, baker's, or brewer's yeasts have been reported (Codón et al. 1998). These include (i) aneuploidy, (ii) polyploidy, (iii) amplification and deletion of chromosomal regions or single genes, and (iv) the presence of hybrid chromosomes (Adams et al. 1992; Bidenne et al. 1992; Rachidi et al. 1999). The maintenance of such mutations is thought to be due to the selective advantages they confer on these yeasts (Pérez-Ortín et al. 2002). Aneuploidy can increase the number of beneficial genes and protect the cells against lethal or deleterious alleles (Puig et al. 2000). Minor differences, such as point mutations, may also affect strain performance since the presence of certain alleles can cause massive alterations in the global patterns of gene expression affecting metabolic pathways, as have been described for natural vineyard populations of S. cerevisiae (Cavalieri et al. 2000). Nevertheless, the exact nature of the modifications in the genome of the industrial yeasts has not been precisely defined and the underlying molecular basis for such phenomena remains unclear (Codón et al. 1998; Rachidi et al. 1999).
Ectopic recombination between homologous sequences, such as Ty transposons or single transposon-related long terminal repeats (LTRs), has been proposed as the origin of the karyotypic changes observed in both S. cerevisiae laboratory and industrial yeasts. These recombinational events can occur outside of meiosis (Ibeas and Jiménez 1996) and allow karyotypic evolution and subsequent adaptation of the cells to their environment (Rachidi et al. 1999; Puig et al. 2000). The study of the karyotypic changes in six evolved yeast strains after 100–500 generations of growth in glucose-limited chemostats showed the repeated amplification of genomic fragments bound by transposon-related sequences, changes that are presumably responsible for the increase in fitness of the strains (Dunham et al. 2002). Interestingly, a reciprocal translocation between chromosomes VIII and XVI mediated, in this case, by nonhomologous recombination, has been shown to be present in different S. cerevisiae wine yeast strains with diverse geographic origins (Pérez-Ortín et al. 2002). This recombination affects the promoter region of the gene SSU1, which encodes a sulfite transporter implicated in the resistance to sulfite, a preservative widely used in wine making since the Middle Age (Pretorius 2000). Therefore, in those particular cases, adaptive evolution of S. cerevisiae strains has been attributed to gross chromosomal rearrangements (GCRs) produced by either homologous or nonhomologous recombination.
These observations raise several important questions. First, can GCRs be considered a general model for S. cerevisiae evolution? If so, then this might account for the high capacity of industrial yeast to rapidly evolve. This model would be consistent with the fact that selected wine yeast strains display differences in fitness and in phenotypic traits of industrial relevance that are associated with karyotypic variations mediated by GCRs (Ibeas et al. 1997; Martínez et al. 1998; Mesa et al. 1999, 2000). Second, what are the mechanisms and possible causal factors underlying the apparent bursts of illegitimate recombination events that may be responsible for the repeated chromosomal rearrangements observed when the yeast are exposed to a high selective pressure (Fischer et al. 2000; Dunham et al. 2002; Pérez-Ortín et al. 2002)?
To gain further insight into these questions we have compared the genomes of two prominent wine yeast strains having different fitness and physiological properties, isolated from the flor velum of an aging sherry wine. Flor velum is a unique biofilm, which develops on the surface of the wine during the sherry wine making process after the alcoholic fermentation, which is carried out by S. cerevisiae fermentation strains, is completed. The flor velum is composed of the flor yeast and creates an aerobic environment that is conducive to the unique enological properties of these yeasts. Most of the strains isolated from the flor velum are classified as S. cerevisiae strains (Barnett et al. 1990; Kurtzman and Fell 1998).
The characterization of the flor yeast by molecular methods has revealed genetic heterogeneity among the individual strains (Ibeas et al. 1997; Martínez et al. 1998; Mesa et al. 1999, 2000). This may be the result of adaptations to the unique environmental conditions in which flor velum grows, which include a lack of fermentable sugars and a high content of both ethanol and acetaldehyde (Martínez et al. 1998). Indeed, the production and release of high amounts of acetaldehyde as a consequence of ethanol assimilation is one of the unique properties of the flor yeast. Acetaldehyde is a highly reactive compound that has been shown to produce double-strand breaks (DSBs) in yeast DNA. DSBs produced by acetaldehyde are thought to be responsible for the mitochondrial (mt) DNA polymorphisms described in the flor yeasts (Ristow et al. 1995; Blasiak et al. 2000; Castrejón et al. 2002).
Sequence analysis of the ribosomal internal transcribed (ITS) spacers has grouped together both wine fermentation and flor yeast strains as S. cerevisiae species, distinct from other representatives of the genus Saccharomyces. However, a 24-bp deletion affecting the ITS1 region has been described as fixed in flor yeast strains and has never been found in fermentative strains (Fernández-Espinar et al. 2000; Esteve-Zarzoso et al. 2001). The differences in the ribosomal DNA sequences and the finding that the distribution of several phenotypic markers is not random between fermentation and flor yeast strains (Sancho et al. 1986) are indicative of the isolation that exists between these two populations of S. cerevisiae that participate in the sherry wine making process. In contrast with the fermentation strains, the flor yeasts have a permanent presence in the winery, dating from the 19th century in the Jerez region of southern Spain. We think that flor yeasts offer significant advantages for the study of molecular evolution since they have evolved under intense but relatively recent selection pressure for different and unique properties.
In this work we performed a comparative genomic hybridization (CGH) analysis of two flor yeast strains using DNA microarray technology to identify the sequences across the whole genome that show copy number variability and might be responsible for the characteristic physiological properties of each strain. The flor yeast strains S. cerevisiae var. beticus 11.3 and S. cerevisiae var. montuliensis 1.28 were chosen for this study because they differ in both electrophoretic karyotype and physiological properties. Our results show that these strains are aneuploid for whole chromosomes and segments of other chromosomes. Gene copy number changes between the two strains affect 38% of the open reading frames (ORFs), and the majority of them correspond to a widespread amplification of genomic fragments. In most cases, the end points of the amplicons coincide with the positions of either repeated sequences (Ty, single LTRs, and tRNA genes) spread throughout the S. cerevisiae sequenced genome (Cherry et al. 2003) or other regions where meiosis-associated DSBs are produced (Gerton et al. 2000). This suggests that the amplifications have been produced by GCRs mediated by the hotspots identified. We propose that the mechanism that underlies the large number of chromosomal aberrations detected (up to 116 aneuploid regions) might be bursts of DNA DSBs mainly produced by both acetaldehyde and ethanol, which are processed by pathways that yield GCRs. The presence of several genes, which have been found to be either overexpressed or involved in creating the unique phenotypic character of the flor yeast, suggests that such a mechanism is responsible for the adaptive evolution of these yeasts. The nature of the chromosomal modifications described might also account for the sexual isolation shown among the flor yeasts (Guijo et al. 1997; Budroni et al. 2000), indicating that this mechanism of evolution could enhance the speciation process among the flor yeast population. The conclusions of our study could also be applied to the adaptive evolution of other industrial S. cerevisiae strains.
MATERIALS AND METHODS
Strains: The yeast strains used in the CGH experiment were S. cerevisiae 11.3 and S. cerevisiae 1.28, classified as belonging to the physiological races beticus and montuliensis, respectively, on the basis of their patterns of assimilation and fermentation of different carbon and nitrogen sources (Barnett et al. 1990; Martínez et al. 1995). Both strains were isolated from the velum biofilm developed on a sherry wine produced in the Jerez region of southern Spain and were previously characterized by pulsed-field gel electrophoresis (PFGE; Mesa et al. 1999, 2000). The S. cerevisiae diploid laboratory strain X2180 (S288C background) was also used in the Southern blot analyses.
Genomic DNA extraction, labeling, and hybridization to microarrays: Genomic DNA (gDNA) was prepared from either 11.3 or 1.28 yeast cells according to the protocol described previously (Guthrie and Fink 1991). After digestion with HaeIII, each gDNA was labeled with Cy3- and Cy5-dCTP in separate random primer reactions using the BioPrime DNA labeling system (GIBCO BRL, Gaithersburg, MD) according to the manufacturer's recommendations. Labeled cDNAs were purified using a Millipore (Bedford, MA) MAFB NOB 96-well plate. Forty picomoles of Cy3- and Cy5-labeled cDNAs were combined and the volume was reduced to 5 μl in a Speed Vac (Thermo Savant, Holbrook, NY). Forty-five microliters of preheated (55°) hybridization solution (50% formamide, 5× SSC, 0.1% SDS, 5× Denhardt's solution, and 100 μg/ml salmon sperm DNA) was added and the mixture was centrifuged at 12,000 × g for 5 min. The supernatant was applied to a microarray and the hybridization was allowed to proceed for 16 hr at 42°. The ORF-DNA microarrays used in this study were produced by the Center for Expression Array Analysis in the Department of Microbiology at the University of Washington. Information about the arraying process can be found at the web site: http://ra.microslu.washington.edu/aboutus/about_us.html. PCR products corresponding to 6144 ORFs from S. cerevisiae strain S288C were spotted in duplicate onto each of two slides. Slide H1 carried PCR products from the smaller 4608 ORFs and slide H2 had products from the larger 1536 ORFs.
Data acquisition and analysis: The microarrays were scanned with a Molecular Dynamics (Sunnyvale, CA) generation III slide scanner. The software Dapple was used to find the spots on the image, evaluate their quality, and quantify their fluorescence intensities (Buhler et al. 2000). DNA microarray data processing software designed at the Institute for Systems Biology (Seattle; http://www.systemsbiology.org/ArrayProcess/index.html) was used for background subtraction, normalization, and calculation of the logarithmic (decimal) value of the ratio of intensities (from both 11.3 and 1.28 labeled cDNAs) for each ORF. Data from spots with either insufficient fluorescence signals (less than threefold higher than average background intensities in the red or green channel) or signals above the scanner saturation level were eliminated from our analyses.
Experiment replicates and controls: gDNA from each strain was obtained from two independent purifications and used in two independent microarray hybridizations. Two sets of slides were hybridized for each experiment, with one set having the fluorochomes reversed. The mean of the normalized log ratio values was computed by using data from four sets of slides yielding eight readings per ORF. Only ORFs with five or more valid replicate measurements were included in the analysis of the CGH experiment. A control experiment was also performed in which gDNA from the strain 1.28 was labeled with both Cy3 and Cy5 fluorochromes as described above and hybridized to a set of H1 and H2 slides. ORFs with two valid measurements for the hybridization intensities were considered to compute the log ratio values in this control experiment.
Southern blotting: Two different Southern blot analyses were performed to confirm the data obtained from the CGH experiment described above. DNA probes corresponding to specific ORFs were hybridized to gDNA digested with EcoRI and gDNA separated by PFGE. In the former case, 5, 2.5, and 1.25 μg of EcoRI-digested gDNA from strains X2180, 11.3, and 1.28 were loaded onto a 1% agarose gel. To obtain the electrophoretic karyotype, intact chromosomes from strains X2180, 11.3, and 1.28 were prepared and fractionated by PFGE as described previously (Mesa et al. 1999, 2000). In both cases, the DNA was transferred to nylon membranes (Hybond-N+, Amersham, Arlington Heights, IL) according to standard procedures (Sambrook et al. 1989).
DNA probes were obtained by PCR amplification using 80 ng of X2180 gDNA as template. The primers used and probes amplified correspond to fragments of the following ORFs: YLL027W (oligonucleotides GAAAGGCGCTGATCACCCTG and CTCTCGCCACAACCGCATGT), YEL035C (TGGAACAC GACGATCAACGC and TGGCTGGTATTAGAGCACAGCG), YEL023C (GCCGGTGCCAACTTCTAATGC and TTTATCCT CTCGGGCTCCATCC), YER033C (ACCATCTAACCTGGAA CCTGCC and GGTGATGTGGTTTCGGAAGAGG), YER040W (ACGACCAGCGTGACTACTAAGACG and GTTGAAGGAAT GGTGGGACTGC), and YER086W (TGTACGGTTGTTCGG CAAGG and ATTAAACCACCACCGCCGAC). The thermocycler program used for the amplification was as follows: (1) 1 min at 95° for 1 cycle; (2) 30 sec at 95°, 30 sec at Tm-5°, and 1 min at 72° for 35 cycles; and (3) 10 min at 72° for 1 cycle. DIG High Prime DNA labeling and detection starter kit II (Roche Molecular Biochemicals, Mannheim, Germany) was used for labeling the probes with digoxigenin, hybridization, and signal detection following the manufacturer's instructions. Relative hybridization intensities displayed by the gDNA samples from the different strains were measured with a Gel Doc 2000 system (Bio-Rad, Richmond, CA) using the Molecular Analyst software provided with the instrument.
RESULTS
Identification of ORFs in strains 11.3 and 1.28 that exhibit gene copy number variability: The chromosomal patterns of S. cerevisiae flor yeast strains 11.3 and 1.28 showed 16 and 14 bands, respectively, with some chromosomes displaying differences in their electrophoretic mobilities (Figure 1). Differences in band intensities within each electrophoretic karyotype suggest aneuploidy or the presence of homologous chromosomes of different sizes in both strains (Puig et al. 2000). Such differences are due to DNA copy number changes affecting different genomic regions. To identify the genes affected by the DNA copy number changes between the two flor yeast strains, a CGH scheme based on ORF-DNA microarrays was used. The distributions of mean log ratio values for the ORFs included in both the comparative (ratio of intensities = 11.3/1.28) and the control (ratio of intensities = 1.28/1.28) experiments are shown in Figure 2. In the last case the log ratio values were tightly distributed around a mean (m) value of –0.0074 [standard deviation (SD) = 0.033]. In contrast, the distribution for the CGH experiment (m = 0.0051; SD = 0.083) had a significantly higher SD (at the 99% confidence level; data not shown) and contained more ORFs in both tails. The parameters of the distribution for the control experiment were used to define a threshold for the log ratio values. Log ratio values that differ by at least 2 SD from the control mean were considered significant and indicative of higher copy. Using this cutoff (0.059 and –0.074, for positive and negative log ratio values, respectively), it was estimated that there were 263/5252 (5%) false positives in the CGH experiment. This number could be an underestimate of the true number of false positives. Other sources of error such as that caused by either (i) weaker than expected hybridization due to differences in ORF sequence homologies between each industrial strain and the laboratory strain upon which the ORF-DNA microarrays were based or (ii) cross-hybridization of sequences that are amplified, with microarray spots that correspond to homologous but nonamplified sequences, are not accounted for by the control self-hybridization experiment.
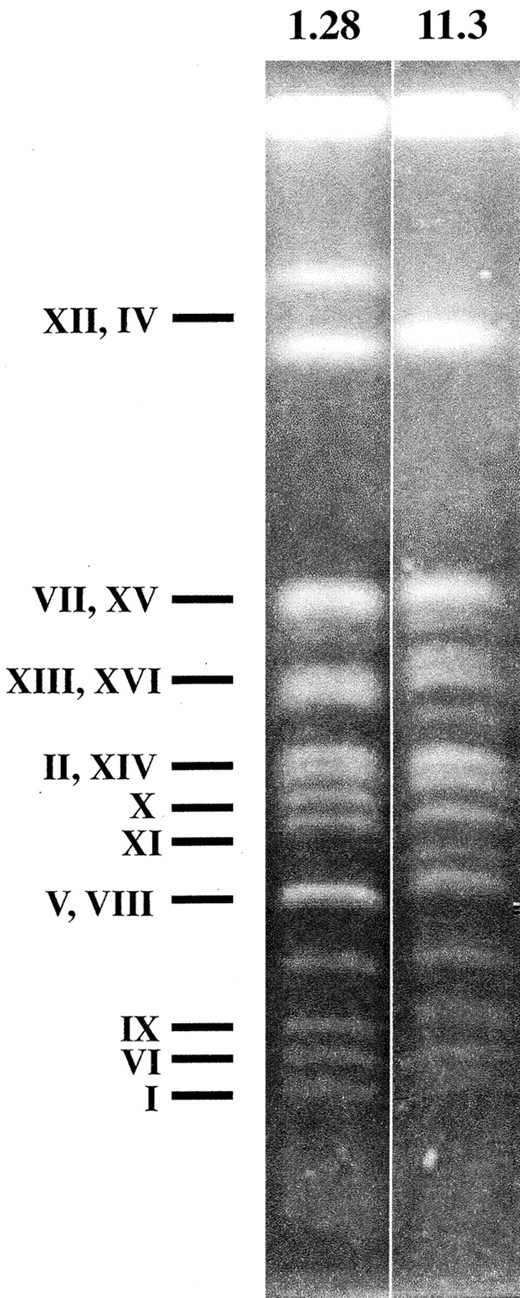
—Electrophoretic karyotypes of S. cerevisiae flor yeast strains 11.3 and 1.28. Putative chromosomes corresponding to every band according to the pattern obtained in the same electrophoresis for laboratory strain S288C are indicated.
The genomic comparison experiment produced significant log ratio values for 2001 of 5252 ORFs, indicating differences in DNA copy number for 38% of the ORFs across the whole genome. Of these ORFs, 1233 were amplified in strain 11.3 and 768 were amplified in strain 1.28. Although we will speak of these copy number differences as amplifications in strain 1.28 or 11.3 in the remainder of the work, they could equally well be thought of as deletions in 11.3 or 1.28. However, both the analysis of the signal intensities in the array experiment and the Southern blot-based comparative genomic hybridization with laboratory strain X2180 suggest the former characterization (see below).
The complete data set of log ratio values for each gene included in the CGH experiment can be seen in supplementary Table 1 at http://www.genetics.org/supplemental/.
Chromosomal amplifications: A plot of the log ratio distribution for each chromosome (Figure 3) revealed a clear bias toward high (positives) or low (negatives) values for some chromosomes. This plot suggests that the copy number of a majority of the genes on chromosomes X and XII is higher in strain 1.28 than in strain 11.3 and that the copy number of a majority of the genes on chromosomes I, III, and VI is higher in strain 11.3 than in strain 1.28.
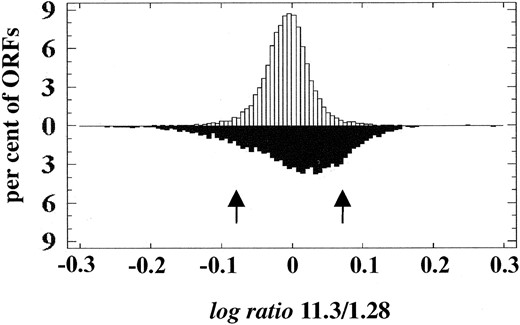
—Distribution of log ratio values for the ORFs in both 11.3/1.28 genomic comparison (solid bars) and control self-hybridization (open bars) experiments. Arrows indicate the positions of thresholds for considering a log ratio value as significant.
One method for estimating the level of chromosomal amplification involves plotting the mean signal intensities for Cy3-labeled probes against those for Cy5-labeled probes. A slope of one would indicate copy number equivalence between the two strains. When the data from the control self-hybridization experiment were plotted in this manner, a slope close to one was obtained (see supplementary Figure 1 at http://www.genetics.org/supplemental/). In the CGH experiment, the intensities produced by the 11.3 gDNA were plotted against those produced by the 1.28 gDNA for the ORFs on (i) chromosome IV, which is not affected by DNA copy number changes according to its distribution of log ratio values, and (ii) chromosomes X, XII, I, III, and VI, which are amplified in 1.28 or 11.3 according to their distributions of log ratio values (Figure 3). In all cases the data fit a straight line with a confidence level of 99% (see supplementary Figure 1 at http://www.genetics.org/supplemental/). The differences between the slopes of the lines for chromosomes I, III, VI, X, XII, and the control experiment were very similar and approximately sixfold higher than the difference between the slopes of the lines for chromosome IV and the control. These results again indicate that (i) both strains have an equal number of copies of chromosome IV and (ii) the level of amplification of chromosomes I, III, and VI in strain 11.3 and of chromosomes X and XII in 1.28 is similar. Regions of the 11.3 and 1.28 chromosomes that have the same copy number, but in which the copy number differs from the diploid X2180 would not be detected because the two flor strains are compared to each other, not to the laboratory strain.
To independently confirm the differences in copy number, a fragment corresponding to a gene on one of the putatively amplified chromosomes, YLL027W, was used as a probe in a Southern hybridization experiment. The results obtained are consistent with the amplification of chromosome XII in strain 1.28. For both strains 1.28 and 11.3, the probe hybridized with the slowest migrating band that corresponds to chromosome XII in the sequenced laboratory strain of S. cerevisiae (Figure 4A). A band of ∼1095 kb also displayed a strong hybridization signal in the electrophoretic karyotype of 1.28. Hybridization of the same probe to EcoRI-digested genomic DNA from strains X2180, 11.3, and 1.28 and quantitation of the signals confirmed the greater abundance of the probe sequence in 1.28 genomic DNA (Figure 4B). The ratio of Southern signals between 11.3 and the control diploid X2180 was ∼1 (see Figure 7), while the signal for 1.28 was ∼1.3-fold stronger than those corresponding to 11.3 and X2180. Southern analyses with other probes specific for different ORFs (see below) showed that these values are indicative of the presence of two copies of the probe sequence in the genome of 11.3 and more than two copies in 1.28, confirming the DNA microarray hybridization data for chromosome XII. On the basis of these data and the microarray data we propose that strain 1.28 carries an extra copy of the majority of the genes located on chromosomes XII and X and that strain 11.3 carries an extra copy of those genes located on chromosomes I, III, and VI. Thus, the relative amplifications detected in the genomes of both strains 1.28 and 11.3 in the array experiment have been interpreted as the gain of extra copies with respect to a normal diploid genome.
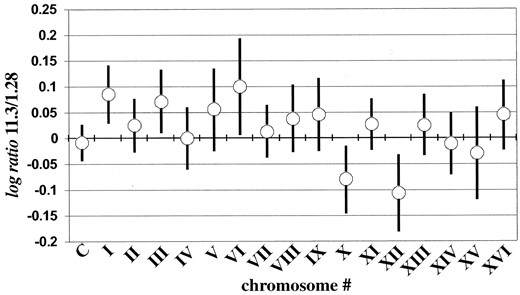
—Mean (○) and standard deviation (error bars) of the log ratio distribution for individual chromosomes in the CGH experiment (11.3/1.28). The log ratio distribution for all the ORFs in the control experiment (1.28/1.28) is also plotted (C).
Genomic regions affected by aneuploidy: The regions affected by aneuploidy in both strains were identified with high resolution by plotting the log ratio values of each gene as a function of its chromosomal location, as shown for chromosome II in Figure 5. A similar representation for each chromosome (see supplementary Figure 2 at http://www.genetics.org/supplemental/) led to the detection of all the amplified regions across the whole genome in both strains. In most cases, the ORFs with significant log ratio values were grouped into regions with sizes ranging from a single gene to almost complete chromosomes. Regions with three or more significant ORFs located together were considered to be amplified. These are depicted in Figure 6.
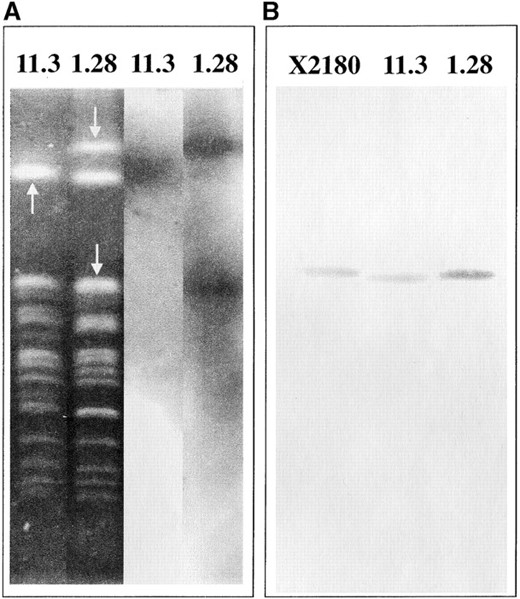
—Southern blot analyses with the probe YLL027W. (A) Hybridization to 11.3 and 1.28 chromosomes fractionated by PFGE. Arrows indicate the bands that hybridized with the probe. (B) Hybridization to 2.5 μg of EcoRI-digested genomic DNA from the strains X2180 (control diploid), 11.3, and 1.28.
Amplification of extensive genomic regions was detected in both strains. Chromosomes XII and X are almost completely amplified in strain 1.28 whereas large regions of chromosomes I, III, VI, the right arms of chromosomes IX and XVI, and the left arm of chromosome V are more highly represented in the genome of strain 11.3. In addition, DNA copy number variations affecting small groups of genes were detected in the different chromosomes. According to our interpretation of the data we estimate that 116 different genomic regions are affected by aneuploidy. Such regions are distributed throughout all the chromosomes and comprise 4086 of ∼12,120 kb of the S. cerevisiae genome.
The level of amplification of a given genomic region that showed copy number variation in the two strains was estimated by analyzing the mean values of the ratio of intensities for all the genes in the region. The similarity of the mean ratios among the different amplicons (see supplementary Figures 3 and 4 at http://www.genetics.org/supplemental/) suggests an equal level of amplification of the different regions in both strains, possibly by the gain of one copy in the aneuploid genome. This analysis again indicates that the amplicons detected in the genomes of both strains 1.28 and 11.3 in the array-based CGH experiment are probably not due to deletions in any of the strains but result from the gain of an extra copy of the fragment with respect to a normal diploid genome. Only five regions (chromosome IV, 527–538 kb; chromosome VI, 0–43 kb and 227–237 kb; and chromosome VIII, 190–195 kb and 208–217 kb; see Figure 6) in strain 11.3 and one region (chromosome IV, 423–428 kb) in strain 1.28 displayed different mean ratios (higher or lower, respectively; see supplementary Figure 3 at http://www.genetics.org/supplemental/), indicating a higher level of amplification in the corresponding strain.
Southern analysis of selected ORFs: To confirm the results obtained from the microarray analysis, we performed Southern hybridizations with probes specific for five ORFs situated on chromosome V. We chose this chromosome because it had regions representing a variety of ORF hybridization patterns on the array. The genes analyzed were (i) YEL035C, which displayed a high log ratio of intensities (0.14) in the array experiment and is located in a large genomic region (chromosome V, 30–128 kb; see Figure 6) that appears to be amplified in the strain 11.3; (ii) YEL023C, which displayed a log ratio close to the cutoff value of 0.059 and is located in the same genomic region as YEL035C; (iii) YER033C, which, on the basis of the microarray data, is a single amplified gene in strain 1.28 with a log ratio of –0.11 and is located within a nonamplified region of chromosome V (196–313 kb); (iv) YER040W, which had a nonsignificant log ratio of 0.017 and is located in the same chromosomal region as YER033C; and (v) YER086W, which had a very high log ratio (0.63), indicating a possible high level of amplification in 11.3, and is located in a region of chromosome V (313–351 kb) that appears to be amplified in 11.3. This region displayed a mean log ratio considerably lower than that of the ORF. We also probed for the ORF YLL027W, which is amplified in 1.28 as we described above.
Three independent hybridizations were performed, probing each ORF fragment on 5, 2.5, and 1.25 μg of EcoRI-digested gDNA from the control diploid strain X2180 and the flor strains 1.28 and 11.3 (Figure 7). Hybridization intensities were quantified and the mean ratios between the signals from the different strain samples were computed.
The mean ratio of intensities between the samples corresponding to strains 11.3 and 1.28 could be grouped into three categories (Figure 7). YLL027W and YER033C hybridizations displayed identical ratios (0.83) below one, whereas the YEL023C and YER086W hybridizations yielded ratios (1.63 and 1.59, respectively) considerably higher than those of the YEL035C and YER040W hybridizations (1.05 and 1.23, respectively). These results confirm those obtained by the array hybridization except for the case of YEL035C, since they indicate (i) amplification of YLL027W and YER033C in strain 1.28 relative to strain 11.3, (ii) amplification of YEL023C and YER086W in strain 11.3 relative to strain 1.28, and (iii) an equal copy number of YER040W in both flor strains. The differences in the level of the signal log ratios obtained by the array experiment (as for YEL023C and YER086W), however, did not reflect the ratios obtained in the Southern analysis. This result could be due to the greater sensitivity of a microarray-based CGH experiment for detecting DNA copy number variation compared to a Southern analysis, as has been previously reported (Pollack et al. 1999).
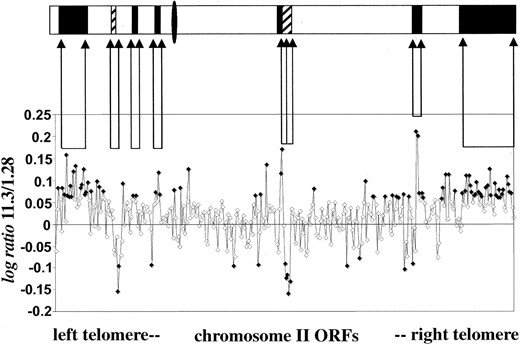
—Chromosome II DNA copy number profile. Points correspond to the log ratio of the ORFs, ordered by its position in the chromosome. Those highlighted in black correspond to significant log ratio values that indicate a higher copy number of the ORF in 11.3 (positive values) or in 1.28 (negative values). Arrows flank different broad regions of amplification in each strain. Plot of log ratio values for each ORF against its position in the chromosome led to a map of aneuploidies (top): open bars, regions with equal number of copies in both strains; solid bars, regions amplified in 11.3; striped bars, regions amplified in 1.28. Bar sizes are proportional to the number of ORFs located within the region. The position of the centromere is represented with a solid ellipse.
The ratios obtained by comparing both industrial strains to the control diploid X2180 (Figure 7) are consistent with the interpretation made after the array data analysis. Probes for the genes YEL023C and YER086W yielded high strain 11.3/X2180 ratios (1.5 and 1.32, respectively), which indicate amplification of the genes with respect to the control diploid strain, while ratios corresponding to the genes not amplified in strain 11.3 are indicative of a DNA content similar to that in X2180. Similarly, probes for YLL027W and YER033C, which are amplified in strain 1.28 relative to strain 11.3, yielded high strain 1.28/X2180 ratios (1.36 and 1.33, respectively), indicating that both elements are also amplified relative to the control diploid. The ratios corresponding to the genes not amplified in strain 1.28 are indicative of an equal copy number with respect to strain X2180. Therefore, the hypothesis made on the basis of the array data analysis, i.e., a basic diploid constitution of strains 1.28 and 11.3 with the aneuploidies described resulting from the gain of an extra element, is generally supported by the Southern analysis.
DISCUSSION
S. cerevisiae DNA microarrays for genomic characterization of wine yeasts: Previous studies on S. cerevisiae flor yeasts showed that different strains may differ greatly in their amount of DNA per cell (Martínez et al. 1995; Ibeas and Jiménez 1996; Guijo et al. 1997). Most of the strains tested exhibited a relative DNA content between 2n and 3n (n being the DNA content of a haploid laboratory strain), although such values do not necessarily reflect a true diploid or triploid constitution. In fact, some genetically characterized strains that exhibited a relative DNA content of 2n were reported to have monosomic, disomic, and trisomic chromosomes (Ibeas and Jiménez 1996). Furthermore, flor yeasts have been shown to sporulate poorly and, in most cases, the spores are nonviable (Ibeas and Jiménez 1996; Guijo et al. 1997; Budroni et al. 2000). This fact has been explained by the presence of complex aneuploidies leading to unbalanced meiotic progeny. In this work, we have demonstrated the feasibility of using comparative genomic hybridization to S. cerevisiae ORF-DNA microarrays to analyze the complexity of the flor yeast genomes at single gene resolution.
Genomic DNA from the industrial strains used in this study produced relatively high hybridization signals in all the microarray spots, suggesting that the genetic background of the industrial strains is very similar to the sequenced strain used to prepare the probes spotted on the microarrays. This is in agreement with the previous classification of both flor wine yeast strains as S. cerevisiae (Mesa et al. 1999, 2000). However, a large part of the flor yeast genome shows evidence of genomic rearrangements that are reflected in the DNA copy number changes observed.
Origin of the amplified sequences: In standard laboratory strains, chromosome length polymorphisms are thought to originate mainly from movement of Ty elements in and out of chromosomes and from Ty-associated duplications or deletions (Wicksteed et al. 1994). In addition, telomere-associated Y′ and X repeated sequences, whose copy number may vary among different strains (Louis and Haber 1990), have been reported to mediate recombination events that lead to gene amplifications and chromosomal polymorphisms in both laboratory (Moore et al. 2000) and industrial yeasts (Codón et al. 1998). Recently, chromosomal changes detected in six strains of S. cerevisiae in response to selective pressure were associated with ectopic rearrangements between transposons, transposon fragments, or tRNA genes (Dunham et al. 2002). On the basis of such results, the authors suggested that transposon and transposon remnants may be the principal source of changes in chromosome structure in yeasts that are growing under strong selective pressure.
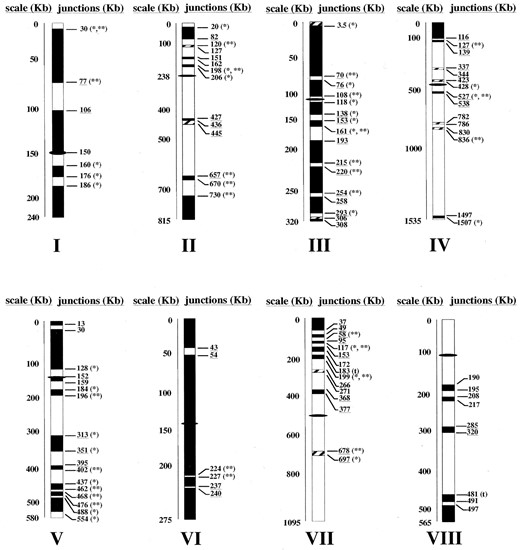
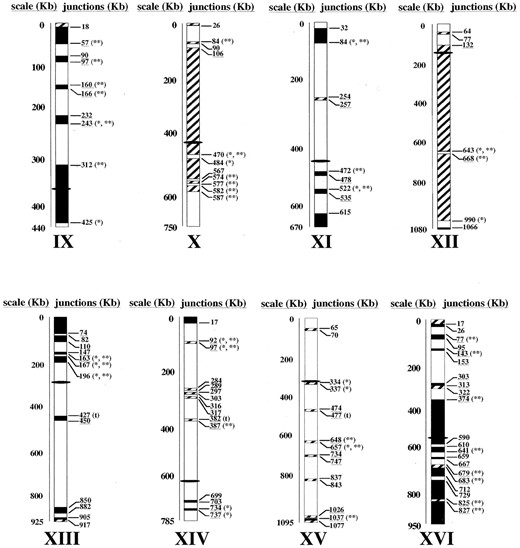
—Genomic comparison between S. cerevisiae flor yeast strains 11.3 and 1.28. The amplicons detected are represented by the position of their ORFs in the different chromosomes. Open bars, regions with equal number of copies; solid bars, regions amplified in 11.3; striped bars, regions amplified in 1.28. Bar sizes are proportional to the number of ORFs located within the regions. The position of the centromere is represented with a solid ellipse. The positions of the breakpoints between the genomic regions were adjusted by the position of the two ORFs on both sides of each junction. Many of the breakpoints coincide with or are close to (<10 kb) the positions of Ty and single LTR elements (*), hotspots of recombination described by Gerton et al. (2000; **), or tRNA genes (t). The positions of end points that fall into one of the cluster homology regions described in the S. cerevisiae genome (Wolfe and Shields 1997) are underlined.
To explore whether the genomic polymorphisms observed between the strains 11.3 and 1.28 might involve recombinational hotspots, the position of Ty elements (transposons and single LTRs) and tRNA genes were plotted on the chromosomal maps showing the polymorphisms (Figure 6). Since the extent of chromosome size variation observed in the wine yeasts suggests that more global chromosomal rearrangements might also be involved (Rachidi et al. 1999), we included the position of meiotic recombination hotspots in our analysis (Gerton et al. 2000).
The position of 94 of 200 junctions between chromosomal regions affected by aneuploidy was localized within 10 kb of the midpoint of a previously described recombinational hotspot (see Figure 6). Forty-three of these breakpoints coincide almost exactly with the position of transposon-related sequences, described in the Saccharomyces Genome Database (Cherry et al. 2003). This observation is in agreement with the correlation previously found between transposon sequences and chromosome breakpoints (Rachidi et al. 1999; Cha and Kleckner 2002; Dunham et al. 2002), suggesting that amplification of the regions bounded by these junctions might be associated with chromosomal rearrangements produced by ectopic recombination between transposon elements. In addition, the coincidence between the end points of the amplicons described in the flor yeast strains and the position of Ty elements in the sequenced strain S288C adds depth to the previously reported idea that some of the ∼300 transposon-related sequences that are found in the sequenced strain of S. cerevisiae are in positions that provide a selective advantage at the population level by allowing relatively high-frequency, potentially reversible, and adaptively useful chromosomal rearrangements (Dunham et al. 2002).
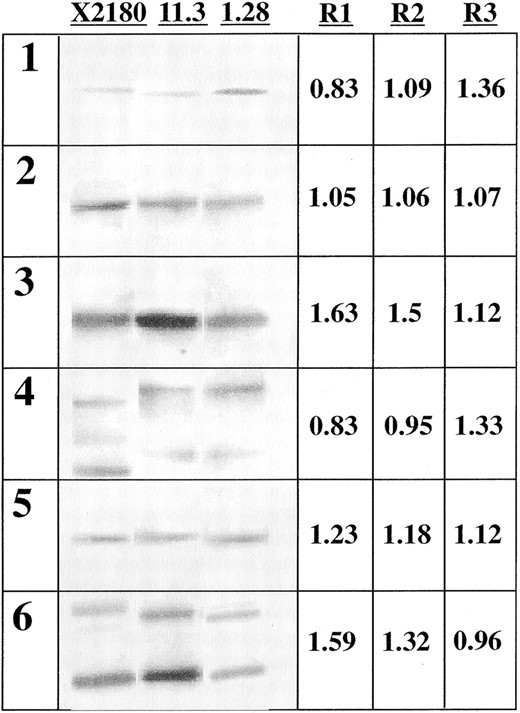
—Southern blot analysis of the laboratory diploid strain X2180 and the flor yeast strains 11.23 and 1.28 with probes of the genes YLL027W (1), YEL035C (2), YEL023C (3), YER033C (4), YER040W (5), and YER086W (6). The signals presented were obtained by probing 2.5 μg of EcoRI-digested genomic DNA after electrophoresis in 1% agarose gel. Numbers correspond to the mean ratio of signal intensities obtained in the Southern experiment (R1, 11.3/1.28; R2, 11.3/X2180; R3, 1.28/X2180).
It is noteworthy that 61 of the breakpoints shown in Figure 6 coincide with the positions of hotspots, which were reported to be associated with local DSBs that lead to meiosis-associated recombination in S. cerevisiae (Gerton et al. 2000). Although the analysis of Gerton et al. (2000) was restricted to one specific genetic background, our results suggest that the ORFs listed in Table 1 could be recombination hotspots in the S. cerevisiae flor wine yeast strains. Since the chromosomal translocations produced in industrial yeasts have been proposed to be mainly produced during mitosis (Ibeas and Jiménez 1996; Puig et al. 2000), the ORFs listed in Table 1, which have been described as meiotic recombination hotspots, could also be related to mitotic recombinations.
In yeast, spontaneously generated GCRs are due to either homologous recombination between multicopy repeat sequences or other mechanisms involving little or no homology at the breakpoints (Yu and Gabriel 2003). It is well established that both mitotic and meiotic recombination in S. cerevisiae use common factors and steps such as their initiation by a DSB, which is processed by a recombinational repair mechanism (Aguilera et al. 2000; Prado et al. 2003). Broken or chemically damaged DNAs are normally repaired by homologous recombination, mainly by break-induced replication (BIR) and to a lesser extent by double-strand break repair, rather than by nonhomologous end joining (NHEJ), and this prevents genome rearrangements. However, when BIR is inactivated, these substrates yield genome rearrangements (Kolodner et al. 2002). Indeed, recent research has demonstrated that the frequency and types of repair events depend on the specific genetic context and it is unclear how NHEJ and other rare rearrangements fit into the broader range of yeast DSB repair events (Yu and Gabriel 2003). The induction of single DSBs in both isogenic S. cerevisiae wild-type and rad52 mutant cells led to the production of GCRs, which showed typical microhomology (0–6 bp) between the joined sequences. Such types of rearrangements were not seen in either yku80 or rad52yku80 strains. Rad52p is an essential component in the homologous recombination pathway, while Yku80p is an essential protein for the NHEJ pathway (Kramer et al. 1994; Lewis and Resnick 2000). Thus, the appearance of GCRs is strongly dependent on the presence of Yku80-dependent processes, most likely the NHEJ machinery (Yu and Gabriel 2003).
We do not know if the flor yeast strains 1.28 and 11.3 are defective in any of the DNA repair mechanisms. However, the nature of the amplicon end points and the large number of chromosomal aberrations suggest that the rearrangements have been produced preferentially by NHEJ or other mechanisms that resulted in joining the broken end of different chromosomal segments that have suffered concomitant cleavage. Since only a microhomology between the two joining strands is required for these kinds of events, it is very difficult to determine which homologous regions in the 200 amplicon end points described in this work might play a role in the recombination. In the case of either the Ty- or tRNA-associated end points (see Figure 6), these elements might have mediated the recombination. In the remaining cases, it should be pointed out that up to 75 of the 152 (49%) end points not associated with either a Ty or a tRNA element fall within one of the 55 cluster homology regions (CHRs) found in the yeast genome (Wolfe and Shields 1997; see Figure 6). CHRs are thought to be traces of the whole-genome duplication
ORFs related to meiosis-induced DSBs (Gerton et al. 2000) that have been found associated with amplicon end points in S. cerevisiae flor yeast strains 1.28 and 11.3
| Recombination hotspots | Chr. | Recombination hotspots | Chr. |
|---|---|---|---|
| YAL061W – 062W | I | YIL152W, -153W,-154C, -155C | IX |
| YAL036C, -37W, -38W, -39C | I | YIL136W | IX |
| YBL055C | II | YIL065C | IX |
| YBL015W, -016W | II | YIL023C | IX |
| YBR214W | II | YJR016C, -017C | X |
| YBR219C, -220C | II | YJR032W | X |
| YCL009C, -010C | III | YJR072C, -073C, -074W, -075W, -077C, -079W | X |
| YCR046C, -047C, -48W, -49C, -50C, -51W, -52W | III | YLR255C, -257W | XII |
| YCR077C, -079W | III | YML053C | XIII |
| YDL181W, -182W | IV | YML042W, -043C | XIII |
| YDR037W | IV | YNL289W | XIV |
| YDR187C, -188W | IV | YNL125C | XIV |
| YER019C-A | V | YOR173W | XV |
| YER119C-A | V | YOR374W, -376W | XV |
| YER145C, -146W,-147C, -149C | V | YPL250C, -252C | XVI |
| YER152C, -153C, -154W | V | YPL222W, -223C | XVI |
| YFR033C, -034C, -035C, -036W, -037C | VI | YPL092W | XVI |
| YGL198W, -199C, -200C | VII | YPR036W, -037C | XVI |
| YGL165C, -166W | VII | YPR063C | XVI |
| YGL162W | VII | YPR151C | XVI |
| YGR096W | VII |
that occurred in the ancestral yeast. Thus, it is probable that these regions contain a high frequency of microhomologies that could have been involved in the recombination. The coincidence between 61 amplicon end points and the previously described meiosis-associated hotspots listed in Table 1, however, do not necessarily imply a role of the meiosis-associated protein Spo11p in generating the DSB that led to the recombination. In work describing Spo11p-associated hotspots, Gerton et al. (2000) reported that hotspot ORFs were expressed at higher levels than average ORFs in S. cerevisiae. Transcriptionally active regions of chromatin could be more accessible to internal cell metabolites or external factors that can produce DSBs. Transcription might also induce DNA repair mechanisms that could mediate recombination events (Aguilera 2002). When a particular DNA lesion blocks the transcription apparatus, the cell takes advantage of the blocked ternary structure at the site of damage to detect the DNA lesion and to facilitate its repair by recombination (Aguilera 2002). Thus, Spo11p-independent DSBs produced in the same highly transcribed regions where the Spo11p-associated hotspots have been described (Gerton et al. 2000) could be effectively repaired.
Flor yeasts develop under high ethanol concentrations (15–15.5% v/v) and grow by metabolizing ethanol via acetaldehyde to acetate and acetyl-CoA (Mauricio et al. 2001). Part of the acetaldehyde produced by yeast is not used in biosynthetic metabolism but is released into the wine, thus producing exogenous acetaldehyde concentrations of up to 800 mg/liter (Martínez et al. 1998). Acetaldehyde has been shown to interact with DNA to produce a variety of adducts that are substrates for DNA repair mechanisms (Blasiak et al. 2000). Indeed, acetaldehyde has been proposed as the carcinogenic agent behind different alcohol-related cancers (Blasiak et al. 2000). In addition, both ethanol and acetaldehyde have been reported to induce severe damage to chromosomal DNA in yeast cells as well as to isolated yeast DNA (Ristow et al. 1995). The effect of exogenous acetaldehyde on yeast chromosomal DNA was reported to be much stronger than that of metabolized alcohol, producing DSBs as well as single-strand breaks (Ristow et al. 1995), which normally are converted into DSBs before repair by recombination (Prado et al. 2003). The active metabolism of ethanol and the release of high amounts of acetaldehyde into the wine (Martínez et al. 1997; J. J. Infante, M. E. Rodríguez, L. Rebordinos and J. M. Cantoral, unpublished results) suggest that acetaldehyde may be present at relatively high concentrations in the flor yeasts during the sherry wine biological aging. This situation favors accumulation of DNA DSBs, which might be responsible for the chromosomal rearrangements that lead to the amplifications seen in both strains 1.28 and 11.3 and, by extension, for the high chromosomal polymorphisms detected by PFGE in the flor yeasts (Martínez et al. 1995; Ibeas et al. 1997; Mesa et al. 1999, 2000). Other authors have also reported that both acetaldehyde and ethanol are responsible for mtDNA polymorphisms detected by restriction fragment length polymorphism (RFLP) in the flor yeasts (Castrejón et al. 2002). Although mtDNA RFLPs reflect point mutations in the mtDNA instead of rearrangements, DSBs introduced by both ethanol and acetaldehyde have also been proposed as the initiating event that leads to the mtDNA polymorphisms. Differences in the DNA repair systems between chromosomal and mitochondrial DNAs, such as the lack of proofreading capacity in the mtDNA polymerase, could account for the different nature of the mutations induced (Castrejón et al. 2002).
The S. cerevisiae montuliensis strain 1.28 was found to be more resistant to relatively high concentrations of acetaldehyde, and variations in its electrophoretic karyotype were not found during a long-term culture under biological aging conditions. In contrast, the S. cerevisiae beticus strain 11.3 showed karyotypic instability under the same conditions of growth and was found to be more sensitive to acetaldehyde (Martínez et al. 1997; J. J. Infante, M. E. Rodríguez, L. Rebordinos and J. M. Cantoral, unpublished results). These previous observations are consistent with the fact that strain 11.3 showed a higher number of chromosomal aberrations (76 of 116 amplicons depicted in Figure 6). It is possible that strain 11.3 has a defective DNA repair system, favoring the nonhomologous pathways that can result in karyotypic instability. In contrast, the resistance to acetaldehyde displayed by strain 1.28 might be due to an intact DNA repair system that is able to repair most of the acetaldehyde-induced DSBs by pathways that do not produce GCRs, such as BIR (Kolodner et al. 2002).
Role of the chromosomal rearrangements in adaptive evolution: Several hypotheses have been proposed to explain the gain of a genomic region by a yeast genome. For example, the inactivation of a single gene could lead to the amplification of an entire chromosome that harbors a paralogue of the inactive gene (Hughes et al. 2000). Alternatively, the amplified sequences could confer selective advantages to the aneuploid cells (Rachidi et al. 1999; Puig et al. 2000; Hauser et al. 2001). Recently, a gross chromosomal rearrangement involving the promoter sequence of SSU1 has been shown to be fixed in different wine yeast strains isolated from different geographical areas. Such strains displayed enhanced sulfite tolerance with respect to S. cerevisiae laboratory strains as a consequence of the overexpression of SSU1, which encodes a plasma membrane protein with a central role in a network of proteins conferring sulfite tolerance in S. cerevisiae (Pérez-Ortín et al. 2002). This new phenotype was acquired by the selection of the recombinant strains in wineries, since sulfite is a widely used preservative in wine making (Pretorius 2000). Thus, such chromosomal rearrangements are involved in the adaptive evolution of S. cerevisiae (Pérez-Ortín et al. 2002). A detailed analysis of translocations involving such repeated chromosomal rearrangements in wine yeast suggested that they are produced by illegitimate recombination mediated by microhomology (Pérez-Ortín et al. 2002). The authors proposed that the conserved chromosomal aberration was probably generated by a spontaneous reciprocal translocation mediated by the fortuitous appearance of a broken chromosome end, which was produced by a DSB in either of the two sequences involved in the joining (Pérez-Ortín et al. 2002). This is consistent with our interpretation of the chromosomal evolution in the flor yeast, as mainly produced by large numbers of DSBs from mutagens such as acetaldehyde, which are repaired by pathways that yield GCRs. Also relevant is the proposal of Dunham et al. (2002) that genome rearrangements were the basis for the observed increases in fitness detected in six of eight S. cerevisiae strains evolved in continuous culture under glucose limitation. The amplicons contained several genes involved in glucose uptake and metabolism (e.g., CIT1 or HXT6 genes).
To explore whether the selection of the chromosomal rearrangements detected in the flor yeast strains were an adaptive response to environmental conditions, we analyzed the function of the genes included within the amplicons described in Figure 6. One amplified region in strain 11.3 included a large portion of chromosome XVI, whose breakpoint is located at ∼374 kb from the left telomere (see Figure 6), within the YPL093W-YPL092W (SSU1) intergenic region. This is consistent with the amplification having adaptive value as proposed by Pérez-Ortín et al. (2002; see above). A comparative study of the transcriptomes between the flor yeast strain 11.3 (used in the present study) and the S. cerevisiae laboratory strain X2180 (S288C background) during their growth under enological-like conditions revealed that up to 51 ORFs are significantly overexpressed in strain 11.3 (J. J. Infante, L. Rebordinos, J. M. Cantoral and B. Blondin, unpublished results). Among them, 20 genes are included within the amplicons described in strain 11.3 (Table 2). Most of these genes have functions related to specific phenotypes characteristic of flor yeast strains. For example, a region of chromosome IX at 312–425 kb amplified in the genome of strain 11.3 (Figure 6) contains two genes, MUC1 (FLO11) and HYR1, which are overexpressed in the flor yeast under enological conditions. MUC1 encodes a cell surface glycoprotein required in S. cerevisiae for biofilm formation (Reynolds and Fink 2001), a defining characteristic of flor yeast strains. HYR1 encodes a hydroperoxide glutathione peroxidase considered to be the main line of enzymatic defense against oxidative membrane damage (Avery and Avery 2001). The ORF SSU1 was also found overexpressed in strain 11.3, suggesting that the chromosomal rearrangement whose breakpoint is located at 374 kb from the chromosome XVI left telomere (Figure 6) has had physiological consequences, producing in strain 11.3 the machinery for the sulfite-resistance phenotype, which has previously been described in other wine yeast strains (Pérez-Ortín et al. 2002). Moreover,
ORFs included in genomic regions amplified in S. cerevisiae flor yeast strain 11.3 (Figure 6) that have been found overexpressed in this strain with respect to S. cerevisiae X2180 strain during growth underenological-like conditions
| ORF | Name | Chromosome | Gene product characteristics |
|---|---|---|---|
| YBL092W | RPL32 | II (20–82 kb) | 60S large subunit ribosomal protein |
| YBR089C-A | NHP6B | II (427–436 kb) | Regulation of transcription (chromatin architecture) |
| YCL018W | LEU2 | III (76–105 kb) | 3-Isopropylmalate dehydrogenase |
| YCL050C | APA1 | III (3, 5–70 kb) | ATP adenyltransferase |
| YDL198C | YHM1 | IV (0–116 kb) | Mitochondrial carrier protein (maintenance of mitochondrial genome) |
| YEL017C-A | PMP2 | V (30–128 kb) | Plasma membrane H+-ATPase regulator |
| YER044Ca | ERG28 | V (196–313 kb) | Involved in ergosterol biosynthesis |
| YER163C | V (488–554 kb) | Biological process/function unknown | |
| YGR234Wa | YHB1 | VII (697–1095 kb) | Flavohemoglobin (cell protection against nytrosilation) |
| YHR053C | CUP1-1 | VIII (208–217 kb) | Copper-binding (metallothionein) protein |
| YHR055C | CUP1-2 | VIII (208–217 kb) | Copper-binding (metallothionein) protein |
| YHR096C | HXT5 | VIII (285–320 kb) | Hexose transporter |
| YHR162Wa | VIII (320–481 kb) | Biological process/function unknown | |
| YIL065C | FIS1 | IX (232–243 kb) | Involved in mitochondrial fission |
| YIL155C | GUT2 | IX (18–57 kb) | Glycerol 3-phosphate dehydrogenase (mitochondrial) |
| YIR019C | MUC1 | IX (312–425 kb) | Cell surface glycoprotein involved in biofilm formation |
| YIR037W | HYR1 | IX (312–425 kb) | Glutathione peroxidase |
| YMR009W | XIII (196–427 kb) | Biological process/function unknown | |
| YPL092W | SSU1 | XVI (374–590 kb) | Sulphite transport (sulphite resistance) |
| YPR099C | XVI (729–825 kb) | Biological process/function unknown |
Positions of limits of the genomic regions in each chromosome (from left telomere) are indicated.
ORFs with significant log ratios, which indicate a higher copy in strain 11.3, but included within a chromosomal region with equal copy number in both 11.3 and 1.28 strains. Therefore these regions are represented with open bars in Figure 6.
copper sulfite has been used extensively during wine making to control the mold growth on grapes and to kill bacteria and stabilize wines. For that reason, overexpression of CUP1, which is related to copper resistance (Jensen et al. 1996), may be interpreted as an adaptation of the wine yeast to the relatively high concentrations of this metal in musts and wines. The overexpression of ERG28, important in ergosterol biosynthesis (Gachotte et al. 2001), and YHM1, related to maintenance and integrity of the mitochondrial genome (Kao et al. 1996; Contamine and Picard 2000), may counteract the mutagenic effects induced by ethanol on both the plasma membrane and the mitochondrial DNA (Jiménez and Benítez 1988; Chi and Arneborg 1999). GUT2 encodes the mitochondrial enzyme that mediates the assimilation of glycerol (Ronnow and Kielland-Brandt 1993), which is a major carbon source in sherry wine. Furthermore, the overexpression of LEU2 is in agreement with the hypothesis that flor yeasts use the synthesis of amino acids to balance the internal redox potential (Mauricio et al. 2001). The presence of these genes within amplified chromosomal segments in the genome of strain 11.3 might have been the reason for the selection of the amplification. These results strongly suggest that changes in gene expression detected in the genes listed in Table 2 are due to an increase in DNA copy number.
In addition, the ADH2 gene, whose product is the alcohol dehydrogenase isozyme mainly responsible for the assimilation of ethanol (Wills 1976), is also located within an amplified region in strain 11.3 (chromosome XIII, 850–882 kb; see Figure 6). Three more genes, which encode the alcohol dehydrogenase isozymes ADHIV, ADHIII (mitochondrial), and ADHVI (Young et al. 2000; Larroy et al. 2002), are also included in amplified regions in chromosomes VII (region 0–37 kb) and XIII (regions 427–450 kb and 905–917 kb). Moreover, the unique genomic region amplified in strain 11.3 that is located on chromosome XV (1037–1077 kb) carries, among others, the ALD4 gene, which encodes the major mitochondrial isoform of aldehyde dehydrogenase, another enzyme directly implicated in ethanol assimilation (Remize et al. 2000).
In regard to strain 1.28, we did not find genes within its amplified regions that could directly account for its unique phenotypic characteristics, such as its high tolerance to both ethanol and acetaldehyde or its capacity to release high amounts of acetaldehyde into the wine under enological conditions (Martínez et al. 1998). However, genes implicated in vesicular protein trafficking and degradation, such as SEC17, VPS15 (required for autophagy), PEX19, ERP3, SEC1, SEC21, SRP1, or MRS6 (Cherry et al. 2003) are present in up to eight different small amplified chromosomal segments. Whether these genes play an indirect role in producing the unique phenotypic characteristics is unknown.
In summary, our genomic analysis of two different flor yeast strains provides further evidence that GCRs might be a general mechanism for chromosomal evolution in yeasts that are under a strong selective pressure. In the case of flor yeast, nonallelic interactions may be stimulated by the production of DSBs in the chromosomal DNA mainly by ethanol and acetaldehyde. Either the large number of DSBs induced or a defect in a system controlling the level of ectopic recombination might induce DNA repair by pathways that yield GCRs. Such rearrangements produce amplified chromosomal segments that result in increased expression of certain genes located within the amplicons, producing the essential physiological characteristics of the flor yeast. A generalization of this model of chromosomal evolution might explain the bursts of translocations that apparently occurred at different epochs during yeast genome evolution (Fischer et al. 2000). The same mechanisms might accelerate the speciation process within industrial yeast by enhancing the sexual isolation between different S. cerevisiae industrial strains. However, the extremely low level of sporulation and the low fertility described in some industrial strains indicate that the accumulation of GCRs could lead to the incapacity of a given strain to propagate meiotically, becoming a dead end in terms of speciation.
Footnotes
Communicating editor: L. S. Symington
Acknowledgement
This work was supported by European Regional Development Fund (ERDF) grant 1FD97-0820-C04-04 from the European Union (to J.M.C.) and grant GM-26079 from the National Institutes of Health (to E.T.Y.). J. J. Infante was a recipient of a Formación Profesorado Universitario fellowship from the Ministerio de Educación, Cultura y Deportes of the Spanish government.
LITERATURE CITED
Author notes
Present address: Department of Biochemistry, Box 357350, University of Washington, Seattle, WA 98195-7350.
