


Abstract
We employed quantitative trait locus (QTL) mapping to dissect the genetic architecture of a hierarchy of functionally related physiological traits, including metabolic enzyme activity, metabolite storage, metabolic rate, and free-flight performance in recombinant inbred lines of Drosophila melanogaster. We identified QTL underlying variation in glycogen synthase, hexokinase, phosphoglucomutase, and trehalase activity. In each case variation mapped away from the enzyme-encoding loci, indicating that trans-acting regions of the genome are important sources of variation within the metabolic network. Individual QTL associated with variation in metabolic rate and flight performance explained between 9 and 35% of the phenotypic variance. Bayesian QTL analysis identified epistatic effects underlying variation in flight velocity, metabolic rate, glycogen content, and several metabolic enzyme activities. A region on the third chromosome was associated with expression of the glucose-6-phosphate branchpoint enzymes and with metabolic rate and flight performance. These genomic regions are of special interest as they may coordinately regulate components of energy metabolism with effects on whole-organism physiological performance. The complex biochemical network is encoded by an equally complex network of interacting genetic elements with potentially pleiotropic effects. This has important consequences for the evolution of performance traits that depend upon these metabolic networks.
CELLULAR processes, including energy metabolism, entail complex networks of interacting components, and these networks appear to be organized as a hierarchy of functional modules (Jeong et al. 2000; Strogatz 2001; Ravasz et al. 2002). Efficient physiological performance must require the coordinated functioning of these modules to process metabolites and create energy for the physiological processes that contribute to organismal fitness. Evolutionary modification of metabolic processes can thus occur by natural selection acting upon the loci encoding components of these metabolic modules, or rather, natural selection may act upon variation at the trans-acting loci regulating these modules.
Quantitative genetic analyses of metabolic enzyme activities in Drosophila have suggested that there is a large pool of trans-acting regulatory variation that may be an important source of variation for evolutionary change. Analysis of metabolic enzyme activity variation in chromosome-extracted lines of Drosophila melanogaster demonstrated that many enzymes involved in energy metabolism have activity modifiers that are unlinked to the enzyme-encoding loci (Laurie-Ahlberg et al. 1980, 1982). A well-documented example is Alcohol dehydrogenase, for which variation at trans-acting modifiers is responsible for both intraspecific variation in enzyme activity (McDonald and Ayala 1978) and interspecific differences in protein level (Laurie et al. 1990). P-element insertion and mutation-accumulation lines of Drosophila have a high mutation rate for metabolic enzyme activities, implying a large mutational target size for these traits (Clark et al. 1995a,b). Crosses between P-element lines revealed significant interaction effects of these trans-acting regions on metabolic enzyme activity (Clark and Wang 1997). Thus, variation in energy metabolism may be caused largely by variation in transcript and/or protein levels of enzymes within the metabolic pathways.
Quantitative trait locus (QTL) mapping approaches are revealing that the genetic architecture of transcriptome and proteome variation involves both regulatory loci and epistatic interactions between genomic regions in maize and Arabidopsis (for reviews see Prioul et al. 1997; Consoli et al. 2002). Damerval et al. (1994) found one to five unlinked loci regulating protein amount for 42 of 72 proteins analyzed in maize, suggesting extensive trans-regulation of protein levels in this species. Epistatic interactions between loci occurred for 14% of these proteins (Damerval et al. 1994). In Arabidopsis, Mitchell-Olds and Pedersen (1998) mapped QTL with both cis- and trans-acting effects on metabolic enzyme activity. A powerful approach for identifying regulatory loci with phenotypic effects on organismal performance may be to investigate regions of the genome for which regulatory and performance QTL coincide (de Vienne et al. 1999; Consoli et al. 2002). For example, three genomic regions in maize are associated with both protein abundance of a drought-induced protein and plant growth under drought stress (de Vienne et al. 1999). Another promising approach to elucidate the relationship between regulatory QTL and physiological function is to analyze traits relating to a known biochemical process. The biochemical pathway underlying production of a pest resistance factor, maysin, in maize is well characterized, and variation in maysin concentration maps to genomic regions containing known regulators of this pathway, with strong epistatic interactions between loci (Byrne et al. 1996).
Regulatory and epistatic genetic effects may then be the rule rather than the exception within metabolic networks, and these effects may have pleiotropic effects on performance phenotypes related to metabolism. This has important consequences for the evolution of complex phenotypes that are influenced by metabolic pathways. It suggests that evolutionary modification of metabolic performance may occur largely at regulatory regions of the genome. A large component of epistatic variance impacts the response to both artificial and natural selection and can appear as either an inflation or diminution of realized heritability (Lande 1979; Lande and Arnold 1983). Moreover, the optimal means for effecting evolutionary change in the face of strong epistatic effects is more often through family or group-based selection rather than through mass selection. In addition, pleiotropic effects of modifiers may place a tangled set of constraints on the evolution of metabolic traits.
Metabolic performance phenotypes, such as metabolic rate and flight performance, must be important components of fitness in natural populations of Drosophila. Flight in insects mediates dispersal, predator evasion, and mating and places high demand on energy metabolism (Dudley 2000). Several glycolytic enzymes in insect flight muscle operate near their functional capacity during flight (Suarez et al. 1996, 1997; Staples and Suarez 1997), suggesting that flight performance may be particularly sensitive to enzyme activity variation within the glycolytic pathway. However, the extent to which epistasis and trans-regulatory variation underlie variation in metabolic performance remains unclear. The genetic architecture of metabolic performance can be better understood using a quantitative genetic analysis of a hierarchy of phenotypes related to the pathways underlying energy metabolism. Identifying genomic regions that drive correlations between traits within the hierarchy may result in the identification of loci that coordinately regulate components of energy metabolism.
Here we report findings from a study of D. melanogaster recombinant inbred lines for which we have quantified genetic variation in a hierarchy of functionally related metabolic phenotypes, including flight performance, resting metabolic rate, triacylglyceride levels, glycogen content, and metabolic enzyme activities. QTL maps for these traits reveal the extent of trans-regulatory effects on metabolic enzyme activities, epistatic effects on physiological phenotypes, and potentially pleiotropic effects of QTL upon multiple phenotypes within the hierarchy. These results give insight as to where in the genome evolution of metabolic performance may occur and what may be the genetic response to selection on complex physiological traits. In addition, this study points to regions of the genome to which fine-scale mapping can be applied to discover the genes and/or regulatory elements underlying metabolic rate, flight performance, and relationships within the metabolic network.
MATERIALS AND METHODS
Drosophila recombinant inbred lines: We measured all phenotypes for 4- to 6-day-old males in 95 D. melanogaster recombinant inbred lines (RILs) generated from the parental lines Oregon-R and 2b (Nuzhdin et al. 1997). We collected data for males, rather than females, to avoid variability in the relationship between metabolic and flight phenotypes that may be caused by variation in female egg mass. We reared flies at 25° in replicate vials containing 5 ml of standard cornmeal medium and a controlled number of flies.
Molecular markers and map: We used roo transposable element insertion sites that were polymorphic between parental lines as genetic markers (Long et al. 1995). A total of 76 informative markers were previously genotyped for each line by in situ hybridization of a probe containing the roo transposable element sequence to polytene chromosomes of third instar larvae (Nuzhdin et al. 1997). The X chromosome was bounded by markers at cytological positions 1B and 19A, the second chromosome by markers at 21E and 60E, and the third chromosome by markers at 61A and 100A. The second chromosome was analyzed as two distinct linkage groups, as no linkage disequilibrium was observed between markers at 50F and 57C on the second chromosome. The fourth chromosome was represented by a single marker that was not significantly associated with any measured phenotype (data not shown). Markers that were segregating within a RIL were treated as missing data for that line. The generation of RILs involves multiple recombination events resulting in an expansion of the genetic map relative to a backcross or F2 map. To correct for this, the equation r = 1/(4/R – 6) (Silver 1985), where R is the proportion of lines exhibiting a recombination event between markers, was used to calculate recombination rates between markers. The genetic map was constructed using the Kosambi mapping function. Overall marker density was ∼1 marker per 3 cM.
Measuring flight performance: We measured flight velocity and mean angle of trajectory for individual free-flying male Drosophila in a flight arena described by Marden et al. (1997). Two spatially calibrated CCD cameras with dedicated software (MacReflex; Qualysis, Glastonbury, CT) tracked flight paths at a frequency of 60 frames per second for individual males released in a 25° cabinet. On average, we tracked the first quarter-second of the flight path. Flights with <5 consecutive frames tracked were not included in the analysis. From changes in three-dimensional location between frames we calculated the mean path velocity and angle of trajectory for each flight (Marden et al. 1997). The path velocity is the velocity of the fly resolved in three dimensions. Frames in which the fly traveled downward were not included in the calculation of mean path velocities. This resulted in <7.5% of the 22,331 measures of path velocity being excluded, with the overall mean path velocity changing only slightly from 324 to 322 mm/sec.
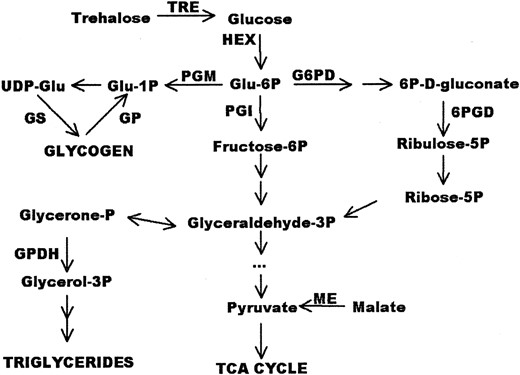
—The relationship among the components of energy metabolism assayed. Glu, glucose.
Metabolic rate measurements: We measured basal metabolic rate as CO2 production using a flow-through respirometer (Sable Systems International, Henderson, NV). The respirometry system consisted of eight 10-ml respirometry chambers from which we sampled seven groups of five flies plus an empty baseline chamber. Flow regulators controlled the flow of CO2-free air through the chambers at 100 ml/min and a LICOR 6250 infrared CO2 gas analyzer detected CO2 produced by the flies within the chambers. The gas analyzer was calibrated using a known CO2 gas standard. We also recorded the temperature at which measurements were made and the live weight of the flies measured to an accuracy of ±1 μg. The mean temperature during measurements was 23.9°± 0.11° (±1 SE). We measured metabolic rate for two replicate groups of five males for 87 of the RILs. We calculated VCO2 as the mean fractional increase in CO2 in a constant rate of air flow for each replicate over a 5-min interval, corrected for any drift in the baseline measures.
Biochemical assays: We scored total protein (PRO), triglyceride levels (TRI), glycogen content (GLY), and maximal in vitro enzyme activities for alcohol dehydrogenase (ADH; E.C. 1.1.1.1), glucose-6-phosphate dehydrogenase (G6PD; E.C. 1.1.1.49), α-glycerol-3-phosphate dehydrogenase (GPDH; E.C. 1.1.1.8), glycogen phosphorylase (GP; E.C. 2.4.1.1), glycogen synthase (GS; E.C. 2.4.1.11), hexokinase (HEX; E.C. 2.7.1.1), malic enzyme (ME; E.C. 1.1.1.40), 6-phosphogluconate dehydrogenase (PGD; E.C. 1.1.1.44), phosphoglucoisomerase (PGI; E.C. 5.3.1.9), phosphoglucomutase (PGM; E.C. 5.4.2.2), and trehalase (TRE; E.C. 3.2.1.28), using spectrophotometric assays described in Clark and Keith (1989) and Clark and Wang (1994). The metabolic pathways connecting these enzymes are depicted in Figure 1.
For each of the 95 lines, six replicate groups of five male flies were etherized, weighed, and homogenized in 1 ml of homogenization buffer (0.01 m KH2PO4,1mm EDTA pH 7.4). The homogenates were centrifuged at 2000 rpm for 2 min and the supernatant distributed as 25-μl aliquots into 96-well plates in a 4° cold room. Microtiter plates were stored at –70° and were equilibrated to 29° immediately prior to use for a kinetic assay. Reactions were run in the microtiter plates and the change in optical density over time was quantified using a Vmax kinetic microtiter plate reader in a temperature-controlled cabinet (Molecular Devices, Sunnyvale, CA). The enzyme assays were designed to yield consistent linear changes in optical density over time and to minimize variance in slopes (Clark and Keith 1989).
Statistical analysis: We calculated descriptive statistics for all traits using the SAS/STAT package v. 6.03 (SAS Institute, Cary, NC). Analysis of variance was performed with the GLM procedure, variance components were estimated with the VARCOMP procedure, partial correlations were obtained with the CORR procedure, and regression models were fitted with the REG procedure. Principal components of the correlation matrix were calculated in MINITAB.
We employed a combination of statistical approaches to test for associations between phenotypic variation and inferred genotypes at loci located between the observed genetic markers. Interval mapping (IM) tests the null hypothesis of no genetic effect of putative QTL between two markers using maximum-likelihood estimation (Lander and Botstein 1989). Composite interval mapping (CIM) does the same, while accounting for genetic background effects by conditioning on background genetic markers (Jansen and Stam 1994; Zeng 1994). For each putative QTL, the genotypes and the additive genetic effect are estimated by maximum likelihood using an expectation/conditional maximization (ECM) algorithm. The likelihood-ratio (LR) test statistic is then calculated at each test position as LR =–2 ln(L0/L1), where L0 is the likelihood of the observed data under the null hypothesis and L1 is the likelihood of the observed data, given that there is a genetic effect of the test position on the phenotype.
We performed IM and CIM with the QTL Cartographer software (Basten et al. 1994, 1999), using an interval size of 1 cM. For CIM, we used forward regression with backward elimination to choose a maximum of five background markers. When fitting models containing background marker effects it is important to exclude background markers that are tightly linked to the test position to avoid conditioning on the test position itself. We chose a large exclusion window size of 50 cM when fitting models for all phenotypes, except in the case of glycogen content where an exclusion window size of 10 cM allowed for better model fitting of two X-linked QTL with effects in opposite directions. To obtain experimentwise critical threshold values for LR we generated a null distribution of LR for each trait by randomly permuting phenotypic values over genotypic values 1000 times and retaining the highest LR from each permutation (Churchill and Doerge 1994). Because of the conservative nature of the permutation test, we interpreted 0.05 < P < 0.1 as a suggestive QTL and P < 0.05 as a significant QTL.
We do not report measures of the genetic effect of the QTL, because using the weight and protein adjusted line means, which are residuals from a regression model, does not result in biologically meaningful units. Rather, we report the proportion of the phenotypic variance explained by a given QTL, conditioned on background genetic effects. This measure was calculated as r2 = (s20 – s21)/s2, where s2 is the total trait variance, and s20 and s21 are the sample variances of the residuals from the null model including background markers and from the alternative model including the QTL in addition to the background marker effects, respectively. Linkage analysis involves the joint estimation of QTL location and genetic effect from the same data set. This can lead to upwardly biased estimates of genetic effect and proportion of variance explained, as the maximization of the likelihood of a QTL at a given position also results in a maximization of the genetic effect at that position (Göring et al. 2001). This bias has been simulated by Göring et al. (2001) for human linkage analysis and must also occur in QTL analysis of RILs of Drosophila. Thus, the reported proportions of variance explained by significant QTL are likely inflated. Simulations are underway to understand the degree of bias in estimating genetic effects in RIL QTL analysis.
For a subset of the phenotypes, for which we identified QTL by CIM, we used the pseudomarker statistical framework of Sen and Churchill (2001) to investigate epistatic effects between genomic regions. Their approach is a Bayesian QTL analysis that simulates multiple imputed genotype data sets given the observed marker genotype data. These “pseudomarker” data sets are weighted by the probability of the phenotype data given these pseudomarker genotypes, and these weights are then used to obtain approximations to the posterior densities of both QTL location and the genetic model parameters. The method allows for testing QTL models involving more than one locus, including epistatic effects between loci. We created 20 imputed genotype data sets with a marker density of one marker per centimorgan. We used the pairscan analysis to scan all pairwise combinations of loci both within and between chromosomes, testing the two-locus models including the interaction. For each model, the LOD score is calculated by comparing the full model to the null, and an interaction LOD score is calculated by comparing the full model to the additive model. We performed 100 permutations to determine stringent critical threshold values for these test statistics (Churchill and Doerge 1994; Sen and Churchill 2001). We chose models to investigate further by scanning all two-locus models and/or interaction terms for significance using the permutation thresholds. We then determined whether the interaction effects included in these selected models were significant by comparing the nested full vs. additive models using likelihood-ratio tests.
RESULTS
Comparison of QTL mapping methodologies: The profiles of the likelihood-ratio test statistic across the genome produced by IM and CIM are qualitatively similar (Figure 2). However, the magnitude of the test statistic can be affected by the choice of both method and method parameters. For example, the choice of exclusion window size is critical. A narrow exclusion window may result in a model that conditions on the QTL itself and, as a consequence, underestimates the QTL effect. A large exclusion window may fail to include important background genetic effects. A striking example is glycogen content, for which a small exclusion window is needed to include the two X-linked loci that have opposite genetic effects on glycogen content. In this case, both IM and CIM with a 50-cM exclusion window show peaks in the LR profile at the same genetic positions, but fail to detect the loci as significant QTL (Figure 2). For other traits, such as the first principal component of the glucose-6-phosphate branchpoint enzymes, all methods detect the same significant QTL (Figure 2).
Results from both IM and CIM are presented in Table 1 and discussed below. We observed the greatest quantitative differences between IM and CIM when there were linked loci with effects in opposite directions on a single phenotype or when epistatic interactions were also detected. We feel that it is important to condition on background genetic effects, but also warn that choice of exclusion window size and the presence of epistasis can affect the estimation. Extensive simulations are needed to understand how CIM behaves in the presence of epistasis and linked loci with opposite effects. CIM may work best when marker density is high (as simulated in Zeng 1994), as it is in our data set, but it is unclear how CIM will perform in data sets with low marker density. We suggest using a variety of methods, including tests for epistasis, when testing for QTL, as the best method will depend upon both the structure of the marker data set and the genetic architecture underlying the trait.
Extensive trans-regulatory variation in metabolic enzyme activity: Measures of maximal enzyme activity from whole-fly homogenates reflect variation that may be present at the levels of transcription, translation, and enzyme kinetics, as well as potential interactions with other enzymes. In this sense maximal enzyme activity is a quantitative trait that is likely influenced by multiple loci. Because the genomic locations of the structural genes encoding these metabolic enzymes are known, QTL maps of enzyme activity variation reveal whether variation in enzyme activity maps at or trans to the enzyme-encoding loci.
We found significant or suggestive QTL underlying variation in glycogen synthase, hexokinase, phosphoglucomutase, and trehalase activity (Figure 3, Table 1). In each case variation maps away from the enzymeencoding loci, demonstrating that trans-acting effects are a significant source of variability for many metabolic enzymes. For example, variation in glycogen synthase activity was associated with regions on the second chromosome (43A–48D) and regions of the third chromosome (63A–65A and 94D–96A) that do not overlap the enzyme-encoding locus at 88E2 (Figure 3A). Variation in hexokinase activity was most strongly associated with cytological positions 1B–3E on the X chromosome, and there was a QTL for phosphoglucomutase activity on the second chromosome at cytological positions 57C–F (Figure 3, B and C). In both cases, the QTL peaks do not overlap the genomic location of the enzyme-encoding loci. Detection of QTL underlying trehalase activity may be problematic due to the presence of epistatic effects detected between X and third chromosome loci (see below). However, CIM detected a significant QTL on the X chromosome that does not overlap with the trehalase-encoding gene on the second chromosome (Figure 3D). The proportion of the variance explained by each QTL peak, conditioned on the background markers, ranged from 10 to 16% (Table 1). We did not detect significant or suggestive QTL for any of the other metabolic enzymes measured (data not shown).
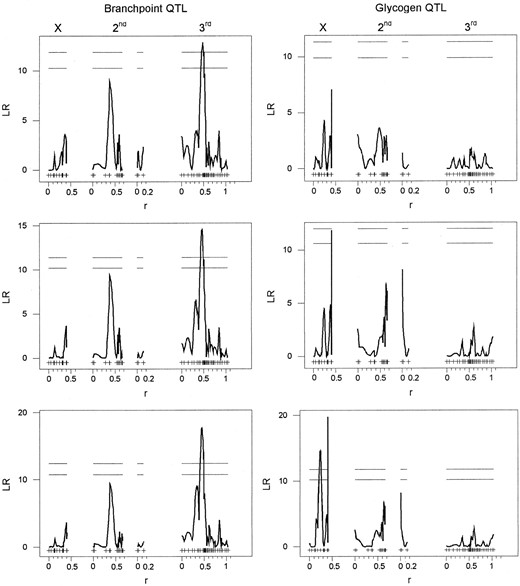
—Likelihoodratio (LR) test statistic profiles across genetic position in morgans (r) for three models describing variation in glycogen content (right column) and in the third principal component of the branchpoint enzymes G6PD, PGI, and PGM (left column). The top plots are from IM, the middle from CIM with an exlusion window of 50 cM, and the bottom from CIM with an exclusion window of 10 cM. For each QTL plot the first linkage group represents the X chromosome, the next two linkage groups represent the second chromosome, and the last linkage group represents the third chromosome. The fourth chromosome is not shown. Marker positions are indicated by ticks. The horizontal lines correspond to the experimentwise 10 and 5% critical threshold values.
Mapping variation in metabolic performance: Genetic variation for glycogen content was associated with two X-linked QTL with opposite effects on glycogen content (Figure 2, Table 1). Glycogen content was positively correlated with both glycogen synthase and trehalase activity (r = 0.321 and 0.743, respectively). This may result from the dynamic equilibrium maintained between trehalase and glycogen in the insect fat body (Friedman 1978). A multiple regression model including both glycogen synthase and trehalase activity explained 57.3% of the variation in glycogen content, with no significant interaction between the two enzymes (model F = 61.8, P < 0.0001). QTL underlying triglyceride levels were located on the second and third chromosomes (Table 1). Triglyceride levels and GPDH activity were positively correlated, with GPDH activity explaining 10.4% of the variance in triglyceride levels (model F = 10.76, P = 0.001). This is consistent with the role of GPDH in lipid storage (Figure 1).
Flight and metabolic QTL
| LRmaxb | |||||
|---|---|---|---|---|---|
| Trait (gene location) | QTL positiona | IM | CIMc | Effectd | r 2e |
| Mean path velocity | 2, 22F–29F | 23.49*** | 37.82*** | + | 0.352 |
| 3, 67D–87B | 14.05** | 19.25*** | + | 0.167 | |
| Metabolic rate | 2, 21E–22F | 7.14 | 10.91* | + | 0.090 |
| 3, 69D–76B | 9.22 | 13.95** | + | 0.128 | |
| Glycogen | X, 7E–9A | 4.27 | 14.69** | – | 0.102 |
| X, 15A–19A | 7.08 | 19.79*** | + | 0.215 | |
| Triglycerides | 2, 57F–60E | 3.66 | 10.08* | + | 0.107 |
| 3, 61A–63A | 5.08 | 14.25** | – | 0.224 | |
| GS (88E2) | 2, 43A–48D | 8.53 | 12.45** | + | 0.100 |
| 3, 63A–65A | 11.11* | 13.15** | + | 0.156 | |
| 3, 94D–96A | 9.19 | 10.41* | – | 0.110 | |
| HEX (8E10–12, 51F5) | X, 1B–3E | 13.5** | 13.80** | – | 0.140 |
| PGM (72D3–4) | 2, 57C–F | 10.49* | 11.46** | – | 0.105 |
| TRE (57C9–D1) | X, 15A–19A | 6.71 | 13.05** | + | 0.116 |
| PC 1: Metabolic rate and PGI | 3, 68C–77A | 15.22** | 18.63*** | – | 0.162 |
| PC 3: G6PD, PGI, and PGM | 3, 69D–76A | 12.87** | 14.56** | – | 0.141 |
P < 0.1
P < 0.05
P < 0.01
experimentwise P values are from 1000 permutations.
Chromosome, cytological positions across which LR is significant.
Maximum LR test statistic for this QTL from the specified model.
CIM using a 50-cM exclusion window, except for glycogen where a 10-cM window was used (see materials and methods).
+ indicates that the Oregon-R allele increases the trait value relative to the 2b allele; – indicates that the 2b allele increases the trait value relative to the Oregon-R allele.
Proportion of the variance explained by this QTL conditioned on genetic background.
Line means for metabolic rates ranged from 3.538 × 10⁻⁵ to 9.790 × 10⁻⁵ ml CO2/min/mg with an overall mean of 5.441 × 10⁻⁵ ± 0.137 × 10⁻⁵ ml CO2/min/mg (±1 SE). This is a range of 4.9 phenotypic standard deviations, with genetic line accounting for 40% of the total phenotypic variance observed in metabolic rate. This phenotypic variation was associated with two regions of the genome (Figure 4). CIM identified a single suggestive QTL explaining 9% of the variance in metabolic rate on the second chromosome at cytological positions 21E–22F and a significant QTL on the third chromosome between positions 69D and 76B (Table 1). Metabolic rate was negatively correlated with PGI activity and a regression model including PGI activity explained 8.6% of the variance in metabolic rate (model F = 8.02, P = 0.006).
The genetic basis of flight performance: 1697 individual flights were analyzed across 71 of the RILs, with an average of 24 flies measured per line. Mean path velocities for the lines ranged across 4.25 phenotypic standard deviations from 250 to 491 mm/sec, with an overall mean velocity of 350 ± 6.7 mm/sec (±1 SE). An upper bound of 850 mm/sec was observed for maximal flight velocities attained by individual flies (Figure 5A), a value identical to that observed in large outbred populations of D. melanogaster selected for increased upwind flight ability (Marden et al. 1997). The recombination events between parental genomes resulted in a phenotypic range spanning that observed in large outbred populations of D. melanogaster (see Figure 7 in Marden et al. 1997), indicating that the QTL we identified were not QTL underlying variation in inbreeding depression. The genetic component of variance accounted for 20% of the total variance in flight velocity. Mean path velocity was strongly associated with regions on the second and third chromosomes at cytological positions 22F–29F and 67D–87B, with the two QTL explaining 35 and 16% of the genetic variance in flight velocity, respectively (Figure 5B, Table 1). Variation between RILs in freeflight performance during takeoff is likely to reflect genetic variability in both physiological capacity and behavior. As a consequence, the QTL identified may be influencing either of these components. Mean path velocity was not significantly correlated with any of the metabolic traits measured.
Line means for mean angle of trajectory also varied dramatically across 4.8 phenotypic standard deviations, with an overall mean angle of 39 ± 0.55° (±1 SE) from the horizontal axis (Figure 6). Despite differences among genetic lines in mean angle of trajectory, we were unable to detect significant QTL for mean angle of trajectory (data not shown). The genetic bases for variation in flight velocity and angle of trajectory are likely distinct, as mean path velocity and mean angle of trajectory were not correlated across genetic lines (r = 0.118, P = 0.326).
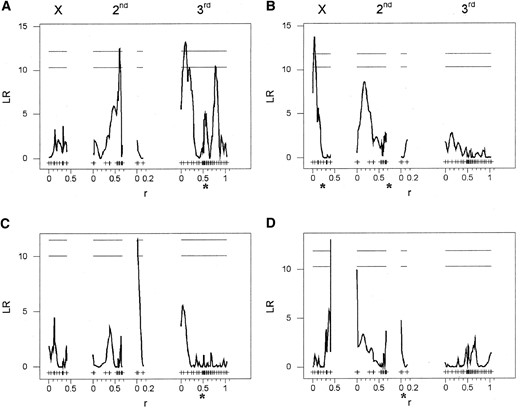
—Composite interval QTL maps for metabolic enzyme activities. (A) Glycogen synthase. (B) Hexokinase. (C) Phosphoglucomutase. (D) Trehalase. The extent of trans-acting variation can be seen, as the majority of enzyme activity QTL map away from the enzyme-encoding locus or loci, which are indicated by the asterisks. QTL maps are as described in Figure 2.
Modeling epistasis in physiological performance: Given the quantitative nature of metabolic enzyme activity variation and the nesting of metabolic enzymes within pathways, it is likely that genetic interactions between regions of the genome influence variation in enzyme activity. Using Sen and Churchill's (2001) pseudomarker statistical framework we tested all possible two-locus models, including interactions, for genetic positions at 1-cM intervals across the genome. For each model a LOD score is calculated for the full model vs. the null model of no effects, and an interaction LOD score is calculated for the full model vs. the additive model. We used a permutation analysis to scan for significant two-locus models and/or significant interactions. To test for significant interaction effects, we constructed nested genetic models and tested the interaction effect by comparing LOD scores for the full and additive models (Table 2). The identification of significant epistatic interactions between loci is difficult for several reasons (Mackay 2001). When scanning all pairwise interactions, the multiplicity of tests that must be corrected for is large and the permutation critical thresholds are high. As a consequence, only very strong interactions will meet these thresholds. When testing for two-locus effects the number of individuals scored for each of the four genotypic categories can be small, increasing the variance in the mean trait value for each two-locus genotype. In addition, there may be other QTL segregating that interfere with the epistatic effect.
Despite these difficulties we identified a strong epistatic interaction underlying trehalase activity between genetic regions on the X (7E–9A) and third (72A–73D) chromosomes (Table 2). The Oregon-R parental allele at the third chromosome locus conferred higher trehalase activity than did the 2b allele when the X chromosome locus carried the 2b allele, but lower activity than did the 2b allele when the X chromosome locus carried the Oregon-R allele (Figure 7A). However, neither of these regions had significant main effects on trehalase activity, and the interacting X locus was distinct from the X-linked QTL at 15A–17C, identified by CIM. This stresses the importance of scanning the whole genome for epistatic effects, rather than simply testing for interactions between QTL with main effects.
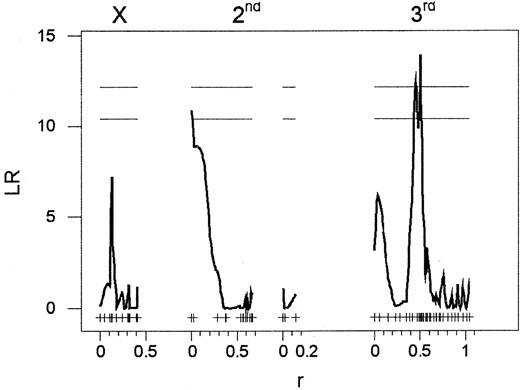
—QTL underlying resting metabolic rate. The composite interval QTL map is as described in Figure 2.
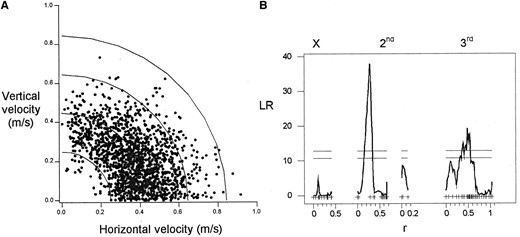
—(A) Maximal path velocities for 1697 individual male flies and (B) the QTL underlying variation in mean resolved path velocity. In A, the distance from the origin to each point represents the maximum path velocity attained by an individual male, and vertical velocity is the velocity in the third dimension. Curves are isovelocity curves along which all velocities are the same. The composite interval QTL map is as described in Figure 2.
There was evidence for an interaction effect on phosphoglucomutase activity between the second chromosome QTL, identified by CIM, and a region of the third chromosome at cytological position 99A that had no main effect (Table 2). Glycogen synthase and hexokinase activity were associated with the QTL identified by CIM, but no interaction effects were detected for either trait (LODInt = 0.62, P = 0.09 and LODInt = 0.2, P = 0.34, respectively; Figure 7B). Nor was there any evidence for epistatic effects on triglyceride levels. In addition to detecting the main effects of the X-linked glycogen QTL, the Bayesian analysis detected another suggestive two-locus model explaining variation in glycogen content. The two QTL had no main effect, yet the interaction between the two loci was significant (Table 2). These results indicate that epistatic interactions between regions of the genome are an important source of genetic variation in key components of carbohydrate metabolism and storage across these genetic lines.
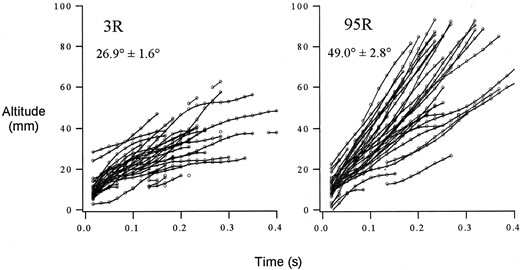
—Variation in angle of trajectory between RILs 3R and 95R. Each line represents a flight trajectory from an individual male. The overall mean angle of trajectory ±1 SE is given for each RIL.
Variance in flight velocity was attributed to a significant epistatic interaction between the third chromosome
Epistatic interactions between pairs of loci
| Trait | Loci paira | LODFull | LODAdditive | LODInteraction | Pb |
|---|---|---|---|---|---|
| TRE | X, 0.19 : 3, 0.5 | 5.52* | 0.215 | 5.31* | 8 × 10⁻⁷ |
| PGM | 2, 0.01c : 3, 0.97 | 5.47* | 2.16 | 3.31 | 0.0001 |
| Glycogen | X, 0.18 : 3, 0.5 | 4.71 | 0.045 | 4.66* | 4 × 10⁻⁶ |
| Mean path velocity | X, 0.24 : 3, 0.5 | 5.28* | 2.63 | 2.65 | 0.0005 |
| Metabolic rate | 2, 0.02 : 3, 0.44 | 4.37 | 2.81 | 1.56 | 0.007 |
P < 0.05
experimentwise P values from permutation analysis used to scan all possible two-locus models.
Chromosomes, positions (morgans) of the two interacting loci.
Nominal P value associated with the difference in LOD for the full model and the additive model.
Located on the second linkage group of chromosome 2 at marker 57C.
QTL, identified by CIM, and cytological position 9A on the X chromosome (Figure 7C). We also detected a possible interaction underlying metabolic rate between the second and third chromosome metabolic rate QTL identified by CIM (Table 2). It is only when the second chromosome QTL was homozygous for the Oregon-R allele that we observed a difference in metabolic rate between genotypes at the third chromosome QTL (Figure 7D). Thus, epistatic effects contribute to genetic variance in whole-organism physiological performance, as well as to the components of the energetic network underlying performance.
Genomic regions underlying correlations among traits: G6PD, PGI, and PGM form a branchpoint at glucose-6-phosphate in the glycolytic pathway (Figure 1). Maximal activities for these enzymes covary positively across the RILs (PGI-PGM, r = 0.673; PGI-G6PD, r = 0.384; PGM-G6PD, r = 0.233) and it is possible that the genes encoding these enzymes may be coordinately regulated. We used principal components analysis to calculate the coefficients of the three principal components for these branchpoint enzymes. We then calculated the principal component weights for each line. These are linear combinations of the data calculated using the principal component coefficients. Principal components capture and summarize the covariation between traits as a “phenotype” that can then be mapped to genomic regions.
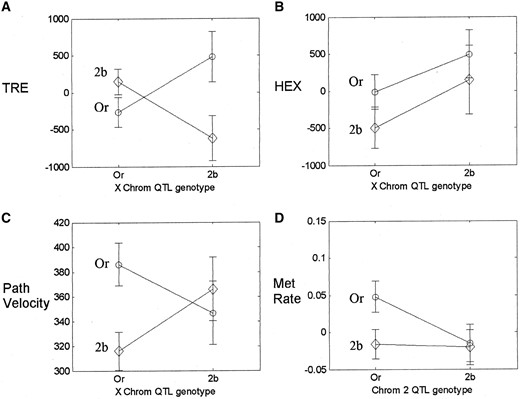
—Interaction effects between pairs of loci. Circles indicate Oregon-R genotype and diamonds indicate 2b genotype at the second locus. Plots reveal (A) an interaction between X and third chromosome loci underlying trehalase activity, (B) the lack of interaction effect between second and third chromosome loci on hexokinase activity, (C) an interaction between X and third chromosome loci that affects mean path velocity, and (D) an interaction effect between second and third chromosome loci on metabolic rate. Mean path velocity units are millimeters per second, while all other trait units are relative scales. The mean and variance for each genotype are weighted averages over the 20 imputed genotype data sets (Sen and Churchill 2001).
The three principal components explain 63, 26.8, and 10.2% of the covariance among these three branchpoint enzymes. The first two principal components were not significantly associated with any genomic regions (data not shown); however there was a strong association between the third principal component and the third chromosome at cytological position 69D–76A (Figure 2). The absence of QTL for the first two principal components suggests that the primary factors dominating the determination of covariation of these metabolic enzyme activities were microenvironmental or that their genetic basis involved a myriad of genes of small effect that were not detected by this study. The principal component QTL was not significantly associated with variability in any of the three enzymes, although the locus encoding PGM activity is located at cytological position 72D3–4. This genomic region was also associated with the first principal component, explaining the correlation between PGI and metabolic rate (Table 1) and with mean path velocity. This is an important observation, as it indicates that regions of the genome influencing glycolytic enzyme activities also influence whole organism performance.
DISCUSSION
Pleiotropy, linkage, and QTL mapping: A means of identifying loci with pleiotropic effects may be to identify overlapping QTL peaks for related traits. A novel feature of our results is that they identify a genomic region on the third chromosome that affects the correlation among the three enzymes flanking the glucose-6-phosphate branchpoint in the glycolytic pathway. This region of the genome overlaps the QTL for both metabolic rate and mean path velocity. Thus, we detected what appears to be a genomic region important for coordinated regulation of glycolytic enzymes with potential effects on physiological performance. However, we cannot yet resolve whether these effects result from a single locus with pleiotropic effects or from closely linked loci, each acting on a single trait.
Gene density is high in Drosophila, and it increases dramatically in regions of low recombination near the centromere. As a consequence there is the potential for multiple linked loci of small effect to be detected as a single QTL of larger effect in these gene-dense regions (Noor et al. 2001). The branchpoint QTL we detected spans cytological positions 69D–76A, and it is possible that several genes under this QTL may be causing the association. Alternatively, a single locus may be driving the covariation between these traits and potentially influencing metabolic rate. Our inability to identify QTL in this region for any of the single enzyme's activity suggests that this may be a locus coordinately regulating the three enzymes acting on glucose-6-phosphate. The presence of a joint regulator of this branchpoint was also suggested by Mitchell-Olds and Pedersen (1998), who observed overlapping QTL peaks on chromosome IV of Arabidopsis for activities of three enzymes that act on glucose-6-phosphate, G6PD, PGI, and glucose-6-phosphatase.
The overall high gene density in Drosophila also poses problems for gene discovery. Both metabolic rate and flight performance map to a region on the third chromosome containing ∼850 genes, many of which are uncharacterized (FlyBase 2003). It appears that gene discovery for complex physiological traits in organisms with high gene density, such as Drosophila, will not occur by QTL mapping alone. However, QTL mapping can operate as a springboard for other fine-scale mapping techniques. The quantitative complementation test using overlapping deficiencies in D. melanogaster enables finer resolution of QTL peaks and can distinguish whether QTL peaks are caused by single genes or multiple linked genes (Pasyukova et al. 2000; Wayne and McIntyre 2002). This approach, coupled with information from expression arrays, identified previously uncharacterized genes underlying ovariole number in Drosophila (Wayne and McIntyre 2002). Fine-scale mapping across regions 21E–29F and 67D–87B would enable resolution of the QTL underlying physiological performance and address issues of pleiotropy and coordinated regulation of metabolism.
Relationships within the phenotypic hierarchy: Relationships between single metabolic enzyme activities and whole-organism phenotypes tend to be weak in Drosophila (Laurie-Ahlberg et al. 1985; Connors and Curtsinger 1986). This is consistent with the Kacser and Burns (1973, 1981) model of flux through metabolic pathways. Flux is determined by the many components of the pathway, and as such, no single component will determine overall flux. If whole-organism performance is proportional to flux through underlying metabolic pathways, then we may not observe strong relationships between performance and activity of any single metabolic enzyme.
However, there are examples in natural D. melanogaster populations of detectable effects of enzyme activity variation on whole-organism phenotypes. In eastern North American D. melanogaster populations from a latitudinal cline, Pgm haplotypes differ in PGM activity, with significant consequences on glycogen storage (Verrelli and Eanes 2001a,b). There is also an excess of replacement polymorphism at Pgm in D. melanogaster, and Verrelli and Eanes (2000) argue that this is the result of adaptive protein evolution. Several other metabolic enzymes also show the footprint of natural selection in their patterns of nucleotide variability (Sod, Hudson et al. 1994; Adh, McDonald and Kreitman 1991; G6pd, Eanes et al. 1993, 1996). This suggests that metabolic enzymes can come under selection, presumably because genetic variation at these steps can influence flux. This can occur even if dominance in metabolic pathways is pervasive, as Kacser and Burns (1973, 1981) theory predicts, if enzymatic steps in natural populations have not evolved to the neutral limit (Eanes 1999). Both G6PD and PGM are branchpoint enzymes and this may give them greater control over flux.
If trans-acting regulators of metabolic enzyme activity modulate flux and impact whole-organism performance, then the evolution of complex physiological performance may occur by selection for certain genetic variants at regulatory loci. We detected a significant relationship between PGI activity and metabolic rate across D. melanogaster RILs. PGI allozyme activity differences affect flight and fitness components in Colias butterflies (Carter and Watt 1988; Watt et al. 1996) and modulate glucose flux through the pentose-phosphate shunt in the sea anemone Metridium senile (Zamer and Hoffmann 1989). The first principal component between PGI and metabolic rate across the RILs mapped to cytological positions 68C–77A on the third chromosome. However, Pgi is located on the second chromosome at position 44F6, suggesting that a trans-acting factor modulates PGI activity with consequences for wholeorganism metabolic rate. Across these lines, trehalase and glycogen synthase activity were strong predictors of glycogen content. Activity variation for both of these enzymes also mapped trans to the enzyme-encoding loci. Thus, regulatory variation may play an evolutionarily important role within the metabolic network. The relationships within the phenotypic hierarchy were observed across RILS created from two inbred genomes and demonstrate the potential for the same relationship to exist in natural populations. Experiments relating, for example, glycogen synthase promoter region SNPs, glycogen synthase transcript and protein abundance, glycogen synthase activity, glycogen levels, and fitness components in Drosophila sampled from natural populations would further our understanding of how metabolic enzymes might come under selection and how trans-acting regulators may influence the evolution of physiological performance.
Despite the fact that flight places an extreme demand on the glycolytic pathways in insects, we observed no significant relationships between flight velocity and any single metabolic enzyme activity. This could be because we did not measure the enzymatic steps truly underlying flight velocity. However, it may also be the case that linear models do not accurately describe the relationship between glycolytic enzyme activity and flight performance. Flux through a linear pathway under steady-state, nonsaturating conditions is defined by a nonlinear relationship between flux and each of the enzymes in a pathway (Kacser and Burns 1973, 1981). If flight performance phenotypes are proportional to flux through metabolic pathways, then clearly they need to be treated as multidimensional phenotypes, applying nonlinear models that accommodate interrelationships among the network of underlying enzymes. A thorough investigation of nonlinear regression models predicting flight performance across these lines is underway.
The evolution of physiological performance: Our findings add to a growing body of evidence that complex genetic effects, such as trans-regulation and epistasis, underlie complex phenotypes. Proteome and transcriptome variation in maize and Arabidopsis is influenced by both types of effects, as well as potentially pleiotropic effects (Damerval et al. 1994; Mitchell-Olds and Pedersen 1998; De Vienne et al. 1999; Consoli et al. 2002). Epistatic effects between loci underlie traits that were selected for during the domestication of maize (Doebley et al. 1995) and species differences in sunflower (Kim and Rieseberg 2001). Interactions between life-history trait QTL were observed in both Caenorhabditis elegans (Shook and Johnson 1999) and D. melanogaster (Leips and Mackay 2000). Epistatic effects impact physiological traits such as salt-induced hypertension and aerobic running capacity in mice (Sen and Churchill 2001; Ways et al. 2002) and susceptibility to asthma in humans (Howard et al. 2002). Genetic interactions affecting fitness have also been observed in experimental populations of bacteria (Elena and Lenski 1997), where it is possible to recover the sequence of steps involving the changes at both interacting loci.
Epistatic and pleiotropic effects of genetic loci on performance and fitness phenotypes, such as flight performance, are expected if complex biochemical networks underlie these traits. The inherent structure of the enzymatic pathways comprising these networks enables both types of effects. Several properties of metabolic networks may also impact how evolutionary forces shape variation within the network, and this makes the evolution of physiological performance particularly interesting. Regulatory elements that coordinately regulate enzymes within a metabolic pathway, such as those that regulate CO2 assimilation pathways in chemoautotrophic bacteria, can upand downregulate entire pathways in response to environmental resources (Bowien and Kusian 2002). This suggests that the evolutionary adaptation of organisms to new environments may occur through modification of regulators rather than through modification of individual elements in pathways. Biochemical networks may also buffer the effects of mutations within network elements. This can occur by buffering of variation in one step by the other steps in the pathway, as predicted by metabolic control theory (Kacser and Burns 1973, 1981). It can also result from the presence of alternative pathways (Kitami and Nadeau 2002). Thus, the nature of biochemical networks may allow them to harbor genetic variability with little consequence on fitness phenotypes. However, this buffering can be dependent upon environment, sex, and/or genetic background, with certain conditions revealing the effects of this “hidden” genetic variation (Dykhuizen and Hartl 1980; Hartl and Dykhuizen 1981; Polaczyk et al. 1998; Remold and Lenski 2001).
It is also clear that certain nodes within biochemical networks may not be buffered, as they have either greater control of flux (see discussion of glucose-6-phosphate branchpoint above) or pleiotropic effects on many downstream pathways. Rausher et al. (1999) observed that genes encoding enzymes upstream of branchpoints within the anthocyanin biosynthesis pathway evolved considerably more slowly than downstream genes in maize, snapdragon, and morning glory. This suggests that evolution of hubs within the metabolic network may be constrained.
Our findings demonstrate that the biochemical pathways underlying energy metabolism and physiological performance are the result of a complex network of interacting and trans-regulatory genetic loci with potentially pleiotropic effects. Biochemical and genetic networks underlying physiological processes potentially impact organismal fitness. If this is the case, these networks will come under selection. The challenge now becomes to integrate what we are learning about the organization of metabolic networks [i.e., a scale-free topology with an embedded modularity leading to a hierarchy of functioning modules (Jeong et al. 2000; Ravasz et al. 2002)] with information on the genetic architecture of these modules (i.e., trans-regulatory, epistatic, pleiotropic, and buffering effects). This stimulates two different and complementary modeling efforts. First, how do these metabolic networks evolve? Second, how does a continuous rain of mutations landing on the underlying genetic network manifest itself in the pattern of genetic variance and covariance among elements of the biochemical network and in the evolution of the physiological phenotypes that depend upon these networks?
Footnotes
Communicating editor: G. Churchill
Acknowledgement
We thank Dr. Sergey Nuzhdin and colleagues for providing the RILs and marker genotype data and Jennifer Hoffman, Deborah Sharpe, and Heidi Waldrip-Dail for help with data collection. K.L.M. acknowledges constructive discussion with participants of the 2001 Jackson Lab Short Course on Mathematical Approaches to the Analysis of Complex Phenotypes. This manuscript was greatly enhanced by comments from Patricia Wittkopp. This work was supported by National Science Foundation grants DEB-9806655 to A.G.C., IBN-9722196 and IBN-0091040 to J.H.M., and a Howard Hughes Medical Institute predoctoral fellowship to K.L.M.
LITERATURE CITED
