


Abstract
Recent empirical evidence indicates that although fitness and fitness components tend to have low heritability in natural populations, they may nonetheless have relatively large components of additive genetic variance. The molecular basis of additive genetic variation has been investigated in model organisms but never in the wild. In this article we describe an attempt to map quantitative trait loci (QTL) for birth weight (a trait positively associated with overall fitness) in an unmanipulated, wild population of red deer (Cervus elaphus). Two approaches were used: interval mapping by linear regression within half-sib families and a variance components analysis of a six-generation pedigree of >350 animals. Evidence for segregating QTL was found on three linkage groups, one of which was significant at the genome-wide suggestive linkage threshold. To our knowledge this is the first time that a QTL for any trait has been mapped in a wild mammal population. It is hoped that this study will stimulate further investigations of the genetic architecture of fitness traits in the wild.
A common interpretation of Fisher’s fundamental theorem of natural selection (Fisher 1958) is that selection will deplete additive genetic variance fastest for traits related to lifetime fitness (see also Frank and Slatkin 1992). By extension, fitness traits should be less heritable than other traits. Empirical studies provide some support for the theorem as there appears to be a negative relationship between a trait’s heritability and its association with lifetime fitness (Kruuk et al. 2000; Merilä and Sheldon 2000), and life history traits tend to be less heritable than morphometric traits (Mousseau and Roff 1987; Roff and Mousseau 1987). However, the low heritability of fitness traits appears to be attributable to high levels of residual variance (e.g., environmental variance, maternal effects, nonadditive genetic variance) rather than to low levels of additive genetic variance (Kruuk et al. 2000; Merilä and Sheldon 2000), and some studies suggest that traits closely related to fitness actually have the greatest additive genetic variance (Houle 1992; Merilä and Sheldon 2000).
The apparent maintenance of additive genetic variance for fitness-related traits raises several key questions that must be addressed to understand the mechanisms of natural selection (Barton and Keightley 2002). For example, can additive variation be attributed to many genes of small effect (polygenes) or relatively few of larger effect (oligogenes)? Are epistasis and pleiotropy important forces in the maintenance of genetic variation? One approach that can be used to address these questions is quantitative trait locus (QTL) mapping (Mitchell-Olds 1995). Over the last decade QTL mapping has been used to investigate the molecular basis of quantitative traits in disciplines such as medicine (Risch 2000), animal and plant breeding (Kearsey and Farquhar 1998; Andersson 2001), and evolutionary genetics (Lynch and Walsh 1998).
QTL studies in evolutionary genetics can be broadly broken down into two areas. First, considerable progress has been made in understanding the genetic basis of reproductive isolation (e.g., Bradshaw et al. 1995) and species differences (Orr 2001), by producing experimental crosses between related species. A second major area of focus is the genetic architecture of quantitative traits within model species such as Drosophila (MacKay 2001). Using mapping resources such as recombinant inbred lines, a number of well-studied traits such as abdominal bristle number have been dissected so that their molecular basis is increasingly well understood. Recently, QTL have been detected for fitness components in Drosophila (Nuzhdin et al. 1997; Wayne et al. 2001) and Caenorhabditis elegans (Shook et al. 1996). However, these experiments have all been conducted within specially created crosses, which invariably have elevated levels of phenotypic and genetic variation relative to the parental lines. No study to date has been conducted in an unmanipulated, wild population unless one regards humans as wild mammals. The extent to which the genetic architecture of fitness traits in the laboratory mirrors the situation in the wild is controversial and unclear (Hoffmann 2000). Quite clearly, data are needed to assess the magnitude of QTL effects in the wild.
Despite previous suggestions that QTL for fitness traits could be detected within natural populations (Mitchell-Olds 1995), obtaining the necessary resources is not trivial. First, phenotypic data for traits known to influence lifetime fitness must be collected from a large sample of individuals—a notoriously difficult undertaking in wild populations (Endler 1986). Second, a panel of mapped, variable markers is required. Third, the relationship between the phenotyped individuals must be established to follow the segregation of marker alleles. Only when all of these criteria are met, can a genome-wide QTL scan can be conducted.
The vast majority of QTL experiments involve specially created populations, such as an F2 generation or backcross created from different parental strains. These crosses offer a powerful approach to detecting QTL, but cannot be created in an unmanipulated, wild population. Similar limitations hinder complex disease gene mapping in human populations. To maximize the power of available pedigrees, sophisticated gene mapping algorithms and methodologies have been developed (Almasy and Blangero 1998; George et al. 2000). In particular, it has been suggested that complex multigenerational pedigrees offer greater power than the half-sib or fullsib families nested within them (Williams et al. 1997; Slate et al. 1999). The main drawback to complex pedigree methods is that they are computationally demanding, especially when pedigrees contain loops due to inbreeding. However, their use is becoming increasingly widespread, particularly in human populations. In natural populations where large sibships are generally uncommon, mapping in complex pedigrees may be the only available option. A two-step method to map QTL in complex pedigrees was recently described by George et al. (2000). First the number of genes identical-by-descent (IBD) between all individuals in the pedigree at any given chromosomal location is estimated using a Markov chain Monte Carlo (MCMC) sampler (Heath 1997). Once this IBD matrix is calculated, the contribution of the chromosomal location to the trait’s variance is assessed using restricted maximum likelihood (REML). This methodology has been used to map a locus influencing bipolar disorder in a complex human pedigree (Visscher et al. 1999) and has been shown to be capable of detecting QTL in simulated livestock pedigrees, even when some marker genotypes are absent (George et al. 2000). Using this approach, it should be possible to map QTL in pedigreed wild populations, provided the necessary phenotypic and life history data are available.
Here we describe an attempt to map QTL for birth weight in a wild population of red deer (Cervus elaphus) on the Isle of Rum, Inner Hebrides, Scotland. The study population is well suited to QTL mapping for several reasons. Detailed life histories have been collected (Clutton-Brock et al. 1982; Kruuk et al. 2000), extensive pedigrees have been determined (Marshall et al. 1998; Kruuk et al. 2000), and the deer genome is mapped (Slate et al. 2002). Furthermore, a previous quantitative genetic analysis estimated the heritability, additive genetic variance, and relationship to lifetime fitness of a number of traits (Kruuk et al. 2000). Birth weight is a suitable trait for QTL analysis as it is known to have an additive genetic variance component (Kruuk et al. 2000), does not have a skewed distribution (unlike many life history traits), is positively associated with several fitness components (Clutton-Brock et al. 1987; Coulson et al. 1998; Kruuk et al. 1999), and, perhaps most importantly, is recorded in more individuals than any other trait.
MATERIALS AND METHODS
Study population: Historically red deer were known to be resident on the 10,600-ha island of Rum (57°0′ N, 6°20′ W), but they had been hunted to extinction by 1787. In 1845 the island was restocked for stalking purposes, and further reintroductions were made during the nineteenth and twentieth centuries. Introduced animals originated from at least five British deer parks or estates. The most recent introduction to the population is of greatest relevance to this article. In 1970 a hummel (antlerless stag) was crossed to Rum hinds to investigate the inheritance of hummellism. All male offspring developed normal antlers and were released on Rum following vasectomy operations. However, one of these male offspring, MAXI, subsequently achieved considerable reproductive success in the study area, siring over 30 offspring and having an estimated 400 descendants to date.
Since 1971, the North Block population has been intensively monitored with all resident animals individually recognizable (Clutton-Brock et al. 1982). In 1973 culling ceased in the study area and the population has remained stable at ∼270 adult animals since 1982. Calves are routinely captured for marking and weighing and since 1982 have been sampled for genetic analysis. Other individuals born prior to 1982 were sampled postmortem or by chemical immobilization. Using nine microsatellite markers and three proteins, a detailed paternity analysis has been made (Marshall et al. 1998) with fathers assigned to 475 calves born between 1982 and 1996. Maternity is inferred from behavioral data and has never been contradicted by molecular data. A previous analysis concluded that the pedigree of animals descended from MAXI provides sufficient power to detect QTL (Slate et al. 1999). We chose this pedigree for several reasons. First, the fact that MAXI was sired by an immigrant animal may aid QTL detection, due to the probable introduction of novel additive genetic variation and by virtue of the fact that MAXI is the most heterozygous animal in the study population (Slate et al. 1999). Second, the MAXI pedigree contains many of the largest half-sibships documented in the study population, increasing the power to detect QTL (Figure 1). Finally, the reproductive success of MAXI and his descendants is such that it would have been impossible to construct a similarly sized pedigree of animals unrelated to MAXI.
Genotyping: The MAXI pedigree contained 364 individuals, of which 221 were known descendants of MAXI, and the remainder were “married-ins.” The pedigree was typed for 90 microsatellite loci, the majority of which were originally characterized in cattle or sheep and mapped in their species of origin. The remaining loci were derived in other ruminants: red deer, caribou (Rangifer tarandus), gazelle (Gazella gazelle), and wapiti (Cervus elaphus canadensis). Briefly, microsatellites were amplified by PCR using direct incorporation of [α-32P]dCTP and products were run out on 6% polyacrylamide gels prior to visualization on X-ray film. Detailed amplification and electrophoresis protocols are described elsewhere (Slate et al. 1998, 2000).
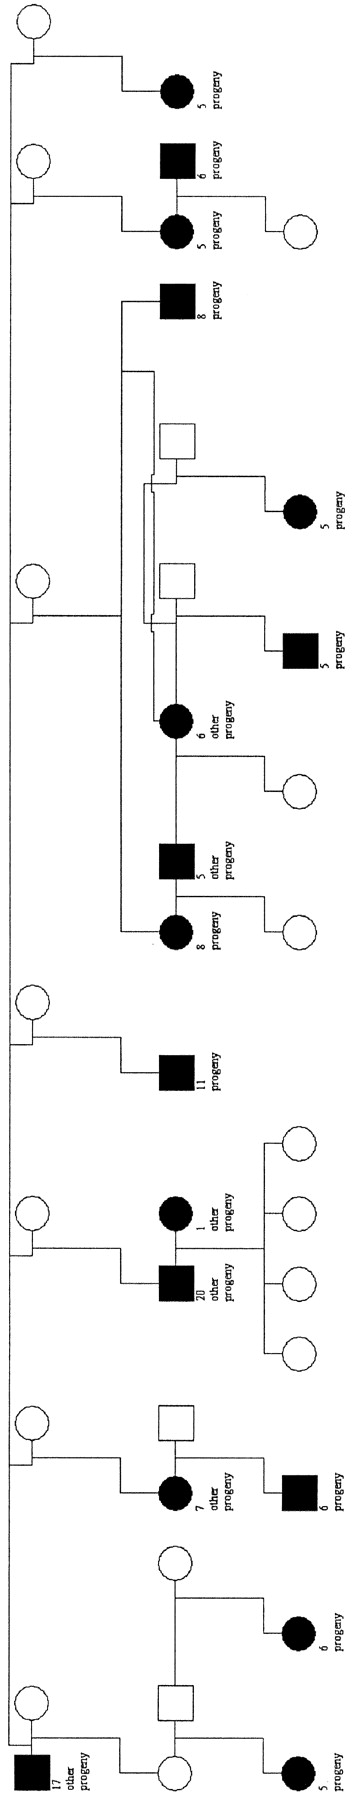
—Overview of the MAXI pedigree. Males are represented as squares and females as circles. MAXI is the male in the top left corner. The 17 parents with five or greater progeny are indicated by shading. All 17 half-sibships are interconnected. For clarity, genotyped and/or phenotyped individuals within the pedigree are omitted unless they are parents of five or greater offspring or connect 2 parents with five or greater progeny.
Pedigree checking: Paternity assignment in the population was initially declared with 80 or 95% confidence, using a battery of nine microsatellite and three protein loci (Marshall et al. 1998). Thus, a proportion of the paternities in the MAXI pedigree were likely to be wrong. By employing likelihood and multilocus genotypes at 84 loci, 44 of the 172 paternities initially included in the MAXI pedigree were identified as erroneous (Slate et al. 2000). All maternal relationships inferred from behavioral data were confirmed by molecular evidence. The corrected pedigree is summarized in Figure 1.
Map construction: A deer genetic linkage map was constructed from the genotyped MAXI pedigree with the program CRI-MAP v2.4 (Green et al. 1990). Linked markers were initially identified using a two-point threshold of LOD = 3.0. Markers were also assumed to be linked if they were supported by LOD > 1.0 and there was an a priori reason for expecting linkage: i.e., they were known to be linked in deer (Slate et al. 2002) or in other ruminants (Barendse et al. 1997; Maddox et al. 2001). Marker order and distances were determined using the BUILD and ALL commands. Any double-recombinant individuals were identified using the CHROMPIC command, and genotypes were reexamined. All genotypes found to be misscored were corrected.
In addition to the 90 microsatellite markers, the three protein loci screened by Pemberton et al. (1991) were included in the CRI-MAP analysis and in subsequent QTL mapping analyses. To compare the location and order of markers with their location on other ruminant maps the following sources were used:
Cattle: Reference was made to three published cattle linkage maps (Ma et al. 1996; Barendse et al. 1997; Band et al. 2000). Information from the maps can be accessed at the following web addresses:
The cattle genome database: http://spinal.tag.csiro.au/
The U.S. Meat Animal Research Center cattle genome mapping project: http://www.marc.usda.gov/genome/genome.html
The ARK database maintained by the Roslin Institute (Roslin, UK): http://www.thearkdb.org/browser?species=cow
Sheep: Linkage information on sheep was obtained from the third-generation map (Maddox et al. 2001). Data from this map can be obtained at the following addresses:
Third-generation sheep map: http://rubens.its.unimelb.edu.au/~jillm/pages/gr_fig.htm
The ARK database: http://www.thearkdb.org/browser?species=sheep
Deer: A deer linkage map of >700 markers has now been completed (Slate et al. 2002). An abbreviated version of this map can be viewed at:
The ARK database: http://www.thearkdb.org/browser?species=deer
Birth weight: Since 1982, >80% of calves have been weighed within 14 days of birth. Birth weight was estimated by backdating from capture weight, assuming a gain of 0.015 kg/hr (Clutton-Brock et al. 1982), and was available for 295 individuals in the MAXI pedigree. To maximize the chances of detecting birth weight QTL, attempts were made to control for potentially confounding environmental effects. A general linear model (GLM) identified four terms that explained 22% of the variation in birth weight: mean spring temperature in the April and May prior to birth, birth date (the number of days after May 1 that the calf was born), mother’s reproductive status (a five-level categorical term describing whether the mother had produced a calf the previous year and how long she had reared it), and subdivision of study area (five-level categorical term). Residuals from the full model were used in subsequent QTL analyses. Model fitting was implemented in SPLUS v4.5 (MathSoft, Cambridge, MA).
QTL analysis: Two methods were used to detect QTL.
Interval mapping by linear regression of half-sib families: The revised MAXI pedigree contained a number of moderately sized half-sib families (Figure 1). A total of 17 parents (8 male and 9 female) with ≥5 genotyped and phenotyped offspring were identified (total number of offspring is 140). Seven parents (4 male and 3 female) had 8 or more offspring. Two individuals (MAXI and his son, RED7) sired >20 progeny each. An interval-mapping by linear regression method, based on Knott et al. (1996), was implemented in the web-based software package QTL Express (Seaton et al. 2002). Briefly, the phenotype is regressed on the conditional probability (inferred from the marker genotype) that a particular QTL allele was inherited from the sire. The analysis is nested within families and the test statistic is an F ratio with numerator degrees of freedom equal to the number of families and denominator degrees of freedom equal to n - k - 1, where n is the total number of progeny and k is the number of families. The process is repeated at 1-cM intervals along the chromosome. Analyses were performed on sibships of ≥8 informative progeny and on sibships of ≥5 informative progeny. Progeny were regarded as informative if typed for at least one marker on the linkage group and they were weighed at birth. Note that the inclusion of families with ≥5 progeny results in a greater number of progeny being analyzed, but may also result in a lower test statistic than when sibships of ≥8 are analyzed, as the test statistic has numerator degrees of freedom equal to the number of families. For this reason, half-sib families with <5 progeny were not analyzed. Interval mapping by linear regression is computationally undemanding, but does not utilize the full power of the MAXI pedigree (Slate et al. 1999). However, the empirical significance of possible QTL can be determined by permutation testing (Churchill and Doerge 1994).
The magnitude of QTL effects was calculated in two ways. First, the weighted mean of the absolute values of QTL allelic substitutions was calculated from only those families that appeared to be segregating for a QTL (nominally significant at P < 0.05). Second, QTL effects were calculated by taking the weighted mean of the absolute values of QTL allelic substitutions in every half-sibship with eight or more progeny. Weights were 1/σ2, where σ is the standard error of the estimated allelic substitution. Both approaches have their limitations. Under the first approach an upward bias is introduced as those families in which the QTL effect is overestimated by chance sampling are the most likely to achieve statistical significance (Beavis 1994). The second approach introduces a downward bias (without correcting the upward bias) because the assumption that every sire is segregating for QTL is unlikely to be correct. An additional upward bias is introduced by this approach. Because absolute effect sizes are used to estimate the mean effect size, every location in the genome will yield a positive effect size, even in cases where no QTL is present; i.e., the true effect size is zero. However, given the very small number of progeny involved in each half-sib family it seems likely that the latter estimate will provide more biologically realistic estimates and, despite the known downward bias, may still produce overestimates of QTL effect. The latter estimate of QTL effect is the focus of discussion in the remainder of this article.
The model provides an estimate of the trait’s heritability, in addition to a likelihood value (L0) for the REML solution. Essentially this model is the “animal model” used to estimate heritability and breeding values in animal breeding (Lynch and Walsh 1998) and more recently in evolutionary genetics (Kruuk et al. 2000).
Estimates of the polygenic heritability (h2) and the variance explained by the QTL (q2) are obtained, in addition to a likelihood value (L1).
Significance thresholds: Any genome scan for QTL involves a large number of statistical tests, and the use of stringent significance thresholds before declaring linkage is well established (Churchill and Doerge 1994; Lander and Kruglyak 1995; Lynch and Walsh 1998). Permutation testing was used to assess statistical significance in the linear regression analysis because missing genotypes, differences in marker density, and segregation distortion are all accounted for (Churchill and Doerge 1994; Lynch and Walsh 1998). Chromosome-wide statistical significance was determined using 10,000 permutations of the data. A threshold for genome-wide significance can be obtained by correcting the chromosome-wide significance threshold for the number of chromosomes analyzed. If it is assumed that 30 chromosomes were analyzed (see results), then a threshold of P < 0.0017 represents genome-wide significance. However, only 24 chromosomes were typed for two or more markers (Table 1), making a threshold of P < 0.002 appropriate. Confidence intervals for the location of possible QTL were determined by bootstrapping the data 1000 times (Visscher et al. 1996).
Summary of the markers typed in the MAXI pedigree
| Linkage group | Markers (position) | Linkage group | Markers (position) |
|---|---|---|---|
| 1 | BR3510; FSHB (40.5); RM4 (50.3) | 17 | ILSTS93; BM1329 (35.0); JP27 (44.2) |
| 2 | JP15; TGLA86 (40.9) | 18 | RM188; OarCP26 (49.7); MGTG4B (85.4) |
| 3 | FCB5; AGLA293 (0) | 19 | OarMAF109; BM6506 (27.6); INRA11 (59.5); RT6 (73.5); TF (91.0); CSSM19 (94.8) |
| 4 | RT25; INRA121 (17.8); IDVGA55 (64.3); JP23 (78.0) | 20 | INRA6; HUJI177 (24.5); TGLA127 (65.2) |
| 5 | TGLA322; OarVH98 (30); TGLA94 (49.0); IDVGA46 (63.0); OarFCB193 (77.5); IOBT965 (82.0) | 21 | CSSM66; BM4513 (0); BM2934 (8) |
| 6 | ILSTS87 | 23 | BMS1669; C217 (21.6); BL1071 (28.8); OarMAF18 (43.6); BMS2319 (49.2); AGLA232 (56.3) |
| 7 | BM1815; BM1258 (13.9); BM1818 (36.4); PRL (50.7) | 24 | HUJ175; CSSM41 (33.6); OarFCB304 (52.0); HIS-H1 (71.2) |
| 8 | IDVGA37; IDH (16.4); TGLA226 (32.7) | 26 | RT1; BM4208 (8.5); MM12 (18.9) |
| 9 | RM12; ILSTS6 | 27 | JP38; OarMAF35 (15.6) |
| 10 | TGLA40 | 28 | BM757; ETH225 (8.2) |
| 11 | ILSTS12; INRA131 (9.1); CSSM16 (16.5) | 29 | TGLA10 |
| 12 | SPS113; TGLA378 (11.2); RM90 (17.9); BM888 (23.8); CSRM60 (42.0); CSSM39 (76.9) | 30 | ILSTS33 |
| 13 | OarVH54; MCM527 (21.9); MPI (34.3); TGLA337 (34.3) | 31 | RM95 |
| 14 | INRA35; BM1706 (3.4); TGLA334 (16.6); JP14 (46.2) | 32 | CSSM43; BM203 (33.7) |
| 15 | RT5; IRBP (34.7); ABS12 (40.4); IDVGA8 (42.2); PGAZac2 (60.8) | 33 | INRA40 |
Ninety-three markers (90 microsatellites and 3 allozymes) were typed and mapped to 30 linkage groups. Linkage groups 16, 22, and 25 were not typed for any marker. The position of each marker (in Kosambi centimorgans) is indicated in parentheses, with the first marker given position 0 cM. Linkage groups are orientated in the same direction as reported in Slate et al. (2002).
Permutation testing is problematic for the VC approach as it is unclear how to permute the data while retaining the association between polygenic variation and marker information (George et al. 2000). An alternative approach to permutation testing is to describe QTL as “suggestive” if they exceed a threshold expected to be observed once by chance in a genome scan and “significant” if exceeding a threshold expected to be observed by chance in only 5% of genome scans (Lander and Kruglyak 1995). Solving the formula given in Lander and Kruglyak (1995), and assuming a map length of 1548 cM covering 30 chromosomes (see results), the suggestive and significant thresholds are equivalent to likelihood-ratio test statistics of 7.02 and 13.64, respectively. However, these values assume an infinitely dense map of informative markers and it is suggested that significance thresholds are dropped by 20% for a map with 10-cM intervals (Lander and Kruglyak 1995). In this study the average marker interval was >15 cM, but to be conservative we assumed a mean interval of 10 cM giving thresholds of 5.62 and 10.91.
All regions of the genome that provided support for segregating QTL at the nominal P < 0.05 significance level are reported. While it is probable that some of these possible QTL are false positives, it is generally regarded as informative to the mapping community to report all regions that offer any evidence of linkage (Lander and Kruglyak 1995). Here we use the notation “possible QTL” to describe regions nominally significant at P < 0.05, while recognizing that QTL need to exceed a genome-wide threshold of 0.05 and be identified in a separate, independent sample of individuals or another population to be confirmed.
RESULTS
Genetic map: Ninety microsatellites and 3 allozyme loci were typed in the MAXI pedigree. Among the 93 loci, 53 were linked to another locus with support of LOD > 3.0. A further 25 loci were mapped on the basis of a LOD >1.0 and an a priori expectation of assignment to that linkage group (on the basis of marker location on other ruminant maps). Of the remaining 15 loci, 6 were expected to be singletons by inference from their location on other ruminant maps. The other 9 loci could not be placed on the expected (or any other) linkage group, presumably because they were relatively uninformative (observed heterozygosity <0.35) or their predicted location was >35 cM from the nearest mapped marker. One locus, McM527, mapped to deer linkage group 13, homologous to sheep chromosome 18, yet is mapped on chromosome 5 in sheep. The location of McM527 had reasonably high support (LOD = 9.55), so the location in deer was treated as genuine. It is assumed that the chromosomal segment containing McM527, underwent a translocation during ruminant karyotype evolution, but the ancestral state is unknown. All other markers mapped to locations consistent with their position on other ruminant maps.
Summary of chromosome-wide significant QTL
| Linear regression | Variance components | ||||||||||
|---|---|---|---|---|---|---|---|---|---|---|---|
| Linkage group | Position (cM) | F | d.f. | P | Allelic effect(1) (kg) | Allelic effect(2) (kg) | Position (cM) | LRT | P | q2 | h2 |
| 12 | 75 | 3.92 | 5, 61 | 0.004* | 1.68 | 1.06 | 76 | 0.01 | 0.5 | 0.00 | 0.25 |
| 14 | 47 | 2.92 | 4, 55 | 0.029 | 2.11 | 0.82 | 32 | 4.36 | 0.018* | 0.30 | 0.00 |
| 21 | 0 | 1.67 | 9, 54 | 0.119 | 3.38 | 0.80 | 0 | 6.27 | 0.006*,** | 0.29 | 0.00 |
Possible QTL were detected using linear regression within half-sib families with eight or more progeny and by a VC analysis of the entire MAXI pedigree. Results for linkage groups 12, 14, and 21 are reported. For each methodology the location of the position (and associated nominal significance, P) giving the highest test statistic is reported. The linear regression yields an F ratio and the VC method yields a log-likelihood-ratio test statistic (LRT). The linear regression estimate of QTL magnitude is summarized as an allelic substitution effect in kilograms estimated from (1) families providing significant evidence for a segregating QTL or (2) all families of eight or more progeny. The VC estimate of QTL magnitude is summarized as the proportion of variance in residual birth weight explained by the QTL (q2). For the VC method variance components are separated into the proportion of residual birth weight explained by the QTL (q2) and by polygenic effects at other loci (h2). *Significant at the chromosome-wide P < 0.05 level; **significant at the genome-wide suggestive linkage level.
The total length of the map inferred from the MAXI pedigree was 978 cM. However, we considered any unlinked marker as potentially capable of detecting QTL up to 10 cM away in either direction. If the marker was predicted (from comparative location) to be at the end of a chromosome, then that marker was treated as capable of detecting QTL within 10 cM in one direction only. Using this somewhat arbitrary rule of thumb, it was predicted that the panel of 93 markers covered 1548 cM. The deer genome is estimated to be 2500 cM long (Slate et al. 2002); thus the entire panel of markers gives ∼62% genome coverage. Red deer have 33 autosomes of which 30 were typed for at least 1 marker and 24 were typed for two or more loci (Table 1). No markers were mapped to the sex chromosomes.
QTL analysis: In accordance with previous analyses (Kruuk et al. 2000), residual birth weight had a heritability significantly greater than zero in the MAXI pedigree (h2 = 0.24, LRT = 9.99, P < 0.002). Statistical significance of polygenic heritability was determined by assuming that the likelihood-ratio test statistic obtained from the polygenic model and a residuals-only model (i.e., a model without the polygenic component fitted) follows a distribution (Lynch and Walsh 1998).
Four linkage groups (LG8, -12, -14, and -21) provided evidence for birth weight QTL at the nominal P < 0.05 significance level, of which three exceeded the chromosome-wide significance level (Table 2; Figure 2). One region (LG21) was significant at the genome-wide suggestive linkage threshold.
Linkage group 12: Linear regression within half-sib families provided evidence for a birth weight QTL at the chromosome-wide significance level whether families of eight or more progeny (F5,61 = 3.92, nominal P = 0.004, chromosome-wide P < 0.05) or five or more progeny (F16,103 = 2.36, nominal P = 0.005, chromosome-wide P < 0.01) were considered. The effect of an allelic substitution at the possible QTL was estimated to be 1.06 kg. The QTL peak was at marker CSSM39 located at 76 cM (Figure 2), although the 95% confidence interval covered the entire linkage group. In fact, all possible QTL identified in this study had 95% confidence intervals that spanned the length of their linkage group. In contrast to linear regression, the VC analysis of the entire pedigree provided no evidence for a QTL on linkage group 12 (see discussion).
Linkage group 14: Linear regression of half-sibships with eight or more progeny provided evidence for a birth weight QTL (F4,55 = 2.92, nominal P = 0.029), but the test statistic was significant only at the chromosome-wide level at P < 0.10. When families with five or more progeny were analyzed the test statistic was not significant at the nominal level (F14,94 = 1.61, nominal P = 0.090) and did not exceed the threshold of F = 1.93 required for chromosome-wide significance. The possible QTL was at 47 cM (at marker JP14), with an allelic substitution equivalent to 0.82 kg.
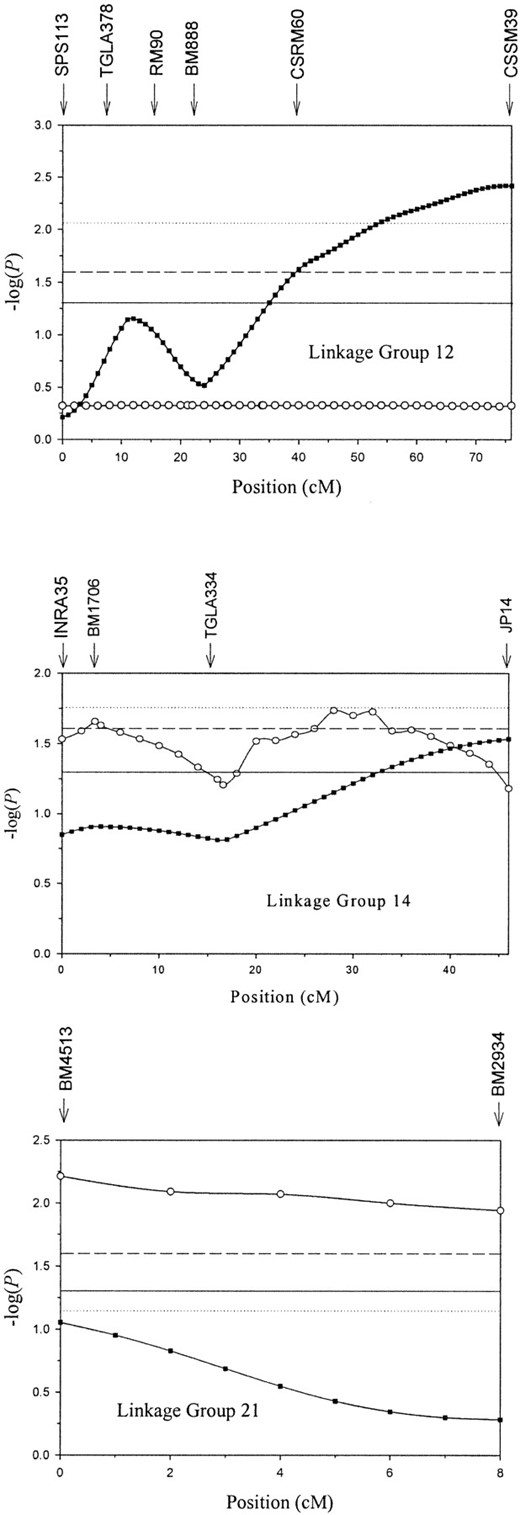
—Evidence for possible QTL on linkage groups 12, 14, and 21. Results from linear regression in half-sib families with eight or more progeny (▪) and from VC analysis (○) of the entire MAXI pedigree are shown. The y-axis shows the statistic -log(P), where P is the nominal significance for a QTL at that location. Horizontal lines represent nominal significance at P < 0.05 (—), chromosome-wide significance at P < 0.05 for the linear regression approach (· · ·), and chromosome-wide significance at P < 0.05 for the VC approach (- - -). Vertical arrows indicate marker location. Note that the test statistic for the VC method on linkage group 21 also exceeds the threshold for suggestive linkage at the experiment-wide level. The profile for linear regression analysis on linkage group 21 represents the nine families that inherited the “96-128” haplotype from MAXI (see results).
The VC analysis of the full pedigree provided evidence for QTL at the chromosome-wide level at two locations (Figure 2). The first location (3.4 cM) is the map position of marker BM1706 and the second (34 cM) is flanked by markers TGLA334 and JP14. The second location provided a marginally higher test statistic (LRT = 4.36, nominal P = 0.018) and was estimated to explain 30% of the variation in residual birth weight. Given the wide confidence intervals of each QTL it cannot be assumed that the two peaks represent different QTL. The test-statistic profiles along the linkage group for the two methods are reasonably similar.
Linkage group 21: Linear regression of half-sibships with eight or more progeny (F4,55 = 0.59, nominal P = 0.67) or with five or more progeny (F10,83 = 1.57, nominal P = 0.13) did not provide evidence for a QTL segregating on LG21. However, a closer inspection of the data suggested that half-sibships in which the common parent was a female MAXI descendant inheriting allele 96 at marker BM2934 and allele 128 at marker BM4513 were segregating for a QTL. Nine half-sibships (six maternal and three paternal) where the common parent had inherited the “96-128” haplotype from MAXI were identified. Analysis of all nine sibships did not provide evidence that a QTL was segregating (F9,54 = 1.67, nominal P = 0.119, chromosome-wide P = 0.103). However, the possibility of a parent-of-origin effect (i.e., paternal silencing) was further investigated by use of reduced linear regression where the sire QTL effects were set to zero in a reduced model (Searle 1971). This model provided evidence of a QTL in the maternal half-sibships (F3,54 = 4.81, P = 0.005), but not in the paternal half-sibships (F6,54 = 0.30, P = 0.93). Ideally, a larger number of sibships are required before a paternally silenced QTL can be confirmed.
The VC analysis of the entire pedigree provided evidence for a QTL that was significant at the suggestive experiment-wide level (LRT = 6.27, nominal P = 0.006, chromosome-wide P = 0.013). This possible QTL was located at marker BM2934 (0 cM) and explained 29% of the variation in residual birth weight. Note that the test statistic exceeded the chromosome-wide significance threshold at every location between markers BM2934 and BM4513 (Figure 2).
Linkage group 8: In addition to the previously mentioned linkage groups, LG8 provided very limited evidence for a birth weight QTL. Linear regression in half-sibships of eight or more progeny gave a nominally significant test statistic (F4,55 = 2.54, nominal P = 0.050), below the threshold required for chromosome-wide significance (F = 3.00). In families of five or more progeny the test statistic approached nominal significance (F6,64 = 2.21, nominal P = 0.053) but did not exceed the chromosome-wide significance threshold of F = 2.47. An allelic substitution at the possible QTL had an effect of 0.76 kg.
The VC method also provided weak evidence for a QTL at the nominally significant level (P = 0.05) but the test statistic did not exceed the chromosome-wide level. The possible QTL was estimated to explain 14% of variance in residual birth weight. The test-statistic profiles were similar for both methods, with the QTL peak located at marker IDVGA37. At present LG8 cannot be regarded as the location of a birth weight QTL although this region is worthy of investigation in follow-up studies.
DISCUSSION
Using two alternative methodologies, possible QTL for birth weight were identified on three separate linkage groups in a wild population of red deer. One possible QTL (on LG21) exceeded the threshold for genome-wide suggestive linkage, while two others (on LG12 and LG14) were significant at the chromosome-wide level. Two of the possible QTL were detected using both linear regression in half-sib families and VC in the entire pedigree, while the QTL on LG12 was detected by linear regression only. All of the possible QTL were estimated to be of large effect whether measured as an allelic substitution effect (in kilograms) or in terms of the proportion of variation in birth weight explained. Thus, questions arising from this analysis are: (1) Are the possible QTL genuine?, (2) how inflated are estimates of QTL magnitude?, and (3) why do the two methodologies provide different results for LG12?
Are the possible QTL genuine? Any genome-wide QTL mapping experiment is liable to generate false-positive QTL at the nominally significant P < 0.05 threshold, due to the large number of tests that are conducted (Churchill and Doerge 1994; Lander and Kruglyak 1995). We report all nominally significant chromosomal regions, but with a cautionary note that some of them may be artifactual. However, there is evidence to suggest that these QTL are real. First, two of the three QTL were detected by two approaches that make different assumptions in the underlying model. Linear regression in half-sib families assumes a QTL is a fixed effect with two alleles segregating in each family; the analysis takes place within families, background polygenic variation is disregarded, and the conditional probability of inheriting a particular QTL allele is estimated by the algorithm described in Knott et al. (1996). In contrast, VC makes no assumption about the number of QTL alleles segregating—rather, it assumes that the trait is described by a multivariate normal (MVN) distribution; the entire pedigree is considered simultaneously; i.e., within- and between-family variances are utilized, background polygenic variance is included in the model, and the probability of two individuals sharing a QTL allele identically by descent is derived by a MCMC estimator. Of course, the two methods were applied in data sets with a number of common animals and so cannot be regarded as two wholly independent tests.
Further (admittedly weak) evidence that the QTL are genuine is provided by the location of birth weight QTL identified in related species. The only previous attempt to map birth weight QTL in deer identified loci on linkage groups 4 and 23 (Goosen 1997). There was little evidence for birth weight QTL in these regions in the Rum study population, although both linkage groups were reasonably well mapped (four and six markers, respectively). However, we are aware of three publications reporting birth weight QTL in cattle (Davis et al. 1998; Stone et al. 1999; Grosz and MacNeil 2001), located on bovine chromosomes 1, 2, 5, 6, 14, 18, and 21. Bovine chromosomes 2 and 14 are homologous to deer linkage groups 8 and 21—two regions where we found possible birth weight QTL. The QTL on bovine chromosome 2 was flanked by markers BM2113 and FCB11 (Grosz and MacNeil 2001), which also flank IDVGA37, the marker yielding a nominally significant QTL on LG8 in this study. Marker order appears to be conserved between cattle and deer in this region (Slate et al. 2002). The study of bovine chromosome 14 (equivalent to deer linkage group 21) indicated that two birth weight QTL may be segregating in cattle (Davis et al. 1998), although the closest markers were not reported, making cross-species comparisons problematic. For the time being we simply note the overlap in the location of cattle and deer birth weight QTL. It is tempting to ascribe this concordance to conserved QTL, but we prefer to reserve judgment until the causative mutations are identified or, at the very least, until a formal test of the similarity of across-experiment genome-wide test statistics is conducted (e.g., Keightley and Knott 1999). Ultimately, it will be necessary to confirm the Rum birth weight QTL in a follow-up study. Since 1996 ∼300 calves have been born and weighed, making this a feasible goal once these cohorts are pedigreed.
How inflated are estimates of QTL magnitude? Falconer and MacKay (1996) define a major gene as one that has an allelic substitution effect of 0.5 of a phenotypic standard deviation. The standard deviation of residual birth weight in the MAXI pedigree was 1.06 kg, and so QTL effects ranged from 0.75 to 1.0 phenotypic standard deviations (see Table 2). These estimates are at the upper end of the distribution of QTL effects described in domestic pig and dairy cattle QTL experiments (Hayes and Goddard 2001). Note that we estimated these QTL effects from all half-sibships of eight or more progeny, weighting each estimate by its standard error. However, this conservative approach does have some limitations: In particular, the assumption that all sires are segregating for a biallelic QTL may be erroneous, while a mean effect size estimated from absolute values must, by definition, yield an effect size greater than zero. An alternative methodology to calculate QTL effect size is to estimate the proportion of overall variation explained by each QTL, using the mean squares from the reduced and full linear regression models (see Knott et al. 1996 for a detailed description). Using this approach the possible QTL on LG12, -14, and -21 explained ∼58, 27, and 25% of variation in birth weight, respectively. The VC method also estimated the QTL to be of large effect (each explaining ∼30% of the variation in residual birth weight; Table 2). Given that the heritability of residual birth weight was estimated as only 0.24, these QTL estimates must be inflated. It is well known that estimates of QTL magnitude can be upwardly biased, especially when sample sizes are relatively small (Beavis 1994). The so-called “Beavis effect” is an issue in all QTL mapping experiments, and it has been suggested that 500 or more phenotype records are required to minimize any bias (Beavis 1994; Orr 2001). Given that the linear regression analysis relied on little more than 100 phenotyped progeny (in some cases fewer) while the VC analysis relied on 295 phenotypes, it is accepted that both methods, particularly the former, would have provided upwardly biased estimates of QTL magnitude. In simulations involving 500 individuals and some missing marker data, the VC method overestimated QTL magnitude more than two-fold (George et al. 2000). Given the obvious problems associated with small samples, it would be preferable to estimate QTL magnitude from an additional data set of study area animals. In the meantime we hypothesize that the QTL effects described here are upwardly biased, although they are likely to be of moderate-to-large effect or they would not have been identified. It is worth noting that the detection of QTL of smaller effect would have required sample sizes far larger than those available to us. In fact, it would probably require several centuries of intensive sampling of the study population to generate a suitably large data set. For example, if 100 half-sib families, each with 40 progeny, were sampled, the power to detect an allelic substitution of effect 0.2 of a phenotypic standard deviation (at the relaxed threshold of α= 0.05) would be only 0.40. This power calculation applies to least-squares linear regression in half-sib families assuming a heritability of 0.25 and was calculated using the approach described in Slate et al. (1999).
An important issue when measuring the magnitude of QTL in complex pedigrees is distinguishing between a relatively rare QTL allele of large magnitude and the scenario of more common alleles of smaller effect. This problem of confounding between one and several QTL alleles is likely to be an issue in all studies that aim to map QTL in complex pedigrees. One possible solution to this problem is to investigate the magnitude of QTL in both the overall pedigree and the constituent families. This approach is reliant on the complex pedigree containing sufficiently large families to conduct the within-constituent family analysis. The MAXI pedigree probably represents a marginal case as only seven families contained eight or more progeny. A related problem involves distinguishing between a single QTL of large effect and several tightly linked QTL of smaller effect. Here we have assumed that each possible QTL represents a single locus, although this assumption can be confirmed only by finer mapping using larger sample sizes and/or molecular cloning of the loci responsible.
Comparison between the linear regression and VC methods: In general the two approaches yielded similar results, with possible QTL on LG14 and -21 detected by both methods. However, the VC method did not detect a QTL on linkage group 12. One possible explanation for this discrepancy is that the significant test statistic obtained from the linear regression approach was due to type I error (i.e., a false-positive result). However, the test statistic was robust to permutation testing, and at least five sires appeared to be heterozygous for the QTL. Thus, we conducted a number of diagnostics to attempt to determine the cause of this discrepancy, using the software SOLAR 1.7.3 (http://www.sfbr.org/sfbr/public/software/solar/index.html; Almasy and Blangero 1998). SOLAR is similar to the approach we employed in that it uses IBD coefficients to perform QTL analysis by VC in a general pedigree framework, although a different algorithm is used. Although SOLAR was able to calculate only single IBD coefficients at marker locations rather than multipoint IBD coefficients at all positions, it was in agreement with our VC analysis in that no LG12 QTL was found in the MAXI pedigree. Points to note are that (i) LOKI and SOLAR provided similar IBD estimates at the marker locations and (ii) SOLAR provided the same maximum-likelihood solutions (yielding a test statistic of zero) as the REML software we used, even when handling IBD coefficients derived from LOKI. Thus, it seems unlikely that the failure of the VC method to find a QTL on LG12 can be attributed to problems associated with LOKI or with the REML program that provided the VC estimates. Both LOKI and SOLAR were subsequently used to conduct a VC analysis within the half-sibships where the linear regression approach had found evidence for segregating QTL. The VC methods found evidence (sometimes highly significant) for segregating QTL within these families, but generally with higher P values (i.e., less significant) than those obtained by linear regression. Given the different assumptions underlying the linear regression and VC methods, it is perhaps not surprising that the two approaches yielded some inconsistencies. The VC method assumes that QTL effects are additive and could be confounded by maternal effects or QTL acting in a nonadditive fashion (e.g., dominance). Reassuringly, the diagnostics suggested that the IBD coefficients estimated with LOKI were robust and accurate.
Intuitively, the VC method might be expected to have greater power than the linear regression approach as more phenotypic records are used. However, we note that in a simulated four-generation sheep pedigree containing 500 individuals, no inbreeding, and with highly informative markers (mean heterozygosity 0.88), the power of the VC method to detect a QTL that explained 10% of trait variation was only 0.48 (George et al. 2000). Power declined to ∼0.30 when missing marker data were introduced into the simulations. Thus, the VC method may simply have failed to detect a genuine QTL on linkage group 12 (type II error).
QTL for traits associated with fitness: Ideally it would have been desirable to perform a linkage analysis on traits more intimately related to lifetime fitness. As adult males and females in the study population have a mean longevity of 10.5 and 11.5 years, respectively (Kruuk et al. 2000), estimates of lifetime reproductive success were not available for surviving individuals (a large proportion of animals in the data set were still alive). However, this constraint is likely to be remedied within the next few years, and male lifetime reproductive success, which is known to have considerable levels of additive genetic variance (Kruuk et al. 2000), would be an interesting trait to investigate further. Given the highly skewed nature of traits such as male reproductive success, it will be necessary to minimize the risk of type I error. However, a combination of permutation testing and perhaps nonparametric QTL detection methods should overcome these difficulties.
The observation that additive genetic variation for a trait related to fitness is at least partially explained by major genes is contrary to predictions made from Fisher’s theorem. Birth weight may be under directional selection, as only positive associations between birth weight and fitness components have been reported in the study population (Clutton-Brock et al. 1987; Coulson et al. 1998; Kruuk et al. 1999). Alternatively, birth weight may be under stabilizing selection as very large calves may result in dystocia (calving difficulty). Although major genes may persist longer under stabilizing than directional selection, it is nonetheless expected that QTL of large effect will be selected to fixation under equilibrium conditions. Of direct relevance to this study is the observation that QTL of moderate to large effect on Drosophila bristle number—a trait subject to stabilizing selection—appear to be segregating at intermediate frequency in wild populations (Lai et al. 1994; Long et al. 1998). A number of not necessarily exclusive mechanisms could result in the persistence of QTL of medium to large effect. Any wild population is likely to experience environmental heterogeneity and mutational input—forces that can maintain and generate additive genetic variation (Houle et al. 1996; Barton and Keightley 2002). The role of additional forces that could serve to maintain variation, such as epistasis and antagonistic pleiotropy, is unknown in this population, although there is evidence for the latter (Pemberton et al. 1991). The question of whether birth weight has a negative genetic correlation with other fitness-related traits is worthy of further investigation.
Immigration from mainland populations has probably resulted in novel additive genetic variation being introduced to the study population. Despite being a descendant of the most recently introduced stag, MAXI does not appear to be heterozygous for the possible QTL on linkage groups 14 or 21, suggesting that polymorphism at these loci was already a feature of the study population. However, the role of gene flow in the maintenance of genetic variation in the wild is receiving increasing attention (Smith et al. 1997). It is noteworthy that several other longitudinal studies of wild populations document introgression due to both conspecific and interspecific hybridization (Grant and Grant 2000; Keller et al. 2001; Veen et al. 2001). Confirmation and fine mapping of QTL in the study population will provide an opportunity to estimate the intensity of selection on recently introduced genes.
In conclusion, the presence of QTL of moderate to large effect in this population is consistent with findings in Drosophila (MacKay 2001), plants (Kearsey and Farquhar 1998), livestock (Andersson 2001), and in crosses between reproductively isolated species (Orr 2001). Whether this consistency between experimental and wild populations will turn out to be a generalization remains to be seen. Clearly one of the major challenges awaiting evolutionary geneticists is to determine the molecular basis of additive genetic variation for fitness traits in the wild. It is hoped that this study will stimulate further attempts to address this crucial gap in the literature.
Acknowledgement
We thank Scottish Natural Heritage for permission to work on Rum; Tim Clutton-Brock, Fiona Guinness, and Steve Albon for their long-term contributions to the project; Angela Alexander, Ailsa Curnow, Sean Morris, and numerous volunteers for field data collection; John Williams for the donation of bovine primer sets; and Nick Barton and Terry Burke for helpful discussion. The manuscript was improved by the astute comments of two anonymous reviewers and the associate editor. The work was funded by the Biotechnology and Biological Sciences Research Council, the Natural Environment Research Council, and The Royal Society.
Footnotes
Communicating editor: T. F. C. MacKay
LITERATURE CITED
