


Abstract
Flow cytometry was used to assess the variability of endoreduplication in endosperms of maize inbred lines. Little variation was found between midwestern dent types, and high levels of endoreduplication were observed in popcorns. Endoreduplication is different between inbred lines by 13–18 days after pollination, and flow cytometric analysis of ploidy level was feasible until 20 DAP. To study the genetic regulation of endoreduplication, four inbreds were crossed to B73 and developing endosperms from both parental, reciprocal F1, and backcross generations were subjected to flow cytometric analysis. Three measurements of endoreduplication were calculated from these data and analyzed as quantitative genetic traits. Multiple models of trait inheritance were considered including triploid, diploid, sporophytic maternal, and maternal and paternal zygotic nuclear inheritance. Maternal zygotic effects, often considered a form of parental imprinting, and maternal sporophytic effects were detected. To test the feasibility of introgressing a high endoreduplication phenotype into a midwestern dent inbred line, a backcross population was generated from B73 × Sg18. Parental and progeny endoreduplication levels were compared and heritabilities assessed. The heritabilities calculated from these data generally agree with the values calculated in the larger crossing experiments.
DURING maize seed development, starch, protein, and other nutrients from the maternal parent (sporophyte) are stored in the endosperm of the developing kernel. The endosperm is formed by the fusion of two nuclei from the female gametophyte and one nucleus from the male gametophyte, such that the balance of genomes is 2m:1p. Endosperm development is characterized by three distinct cell cycles: syncytial karyokinesis, mitosis, and endoreduplication. The latter, which occurs by reiterative cycles of nuclear DNA replication, begins 8–9 days after pollination (DAP) and is associated with the terminal differentiation of endosperm cells (Berger 1999; Olsen et al. 1999). Subsequently, endosperm cells cease mitotic divisions, and the number of cells undergoing endoreduplication dramatically increases, such that the mitotic index falls to nearly zero by 14 DAP (Kowles and Phillips 1985).
Endoreduplication continues until 21–27 DAP, when the central cells of the starchy endosperm begin to undergo cell death (Young et al. 1997; Young and Gallie 2000). Endoreduplication has been implicated in a number of important physiological processes in endosperm and other tissues. Much of the increase in kernel volume and mass occurs during the period of effective grain filling (EGF). During the EGF, which is temporally correlated with endoreduplication, starch and storage proteins are rapidly synthesized and accumulated in the endosperm (Schweizer et al. 1995; Jones et al. 1996). In wheat, kernel size was predicted by a combination of the number of mitotic divisions and the number of endoreduplication cycles in the endosperm (Brunori et al. 1993). Thus, endoreduplication might assist in the rapid synthesis of starch and storage protein during the EGF. Endoreduplication is thought to increase the metabolic activity of cells by increasing the number of DNA templates from which RNA transcripts are generated. Recently, it was shown that during endoreduplication in maize endosperm there is a reduction in chromatin condensing proteins and increased accumulation of an HMG protein associated with an open chromatin conformation (Zhao and Grafi 2000). HMG proteins bind enhancer-like elements in the promoters of endosperm storage protein genes and assist with the binding of transcription factors (Grasser et al. 1990; Schultz et al. 1996).
Endosperm development is significantly influenced by the maternal parent. Kernel size and shape are known to be matroclinally controlled, such that F1 kernels more closely resemble the ear parent (Birchler 1993; Alleman and Doctor 2000). This is also true for the EGF (Jones et al. 1996) and some aspects of endoreduplication (Cavallini et al. 1995; Kowles et al. 1997). Endosperm development also requires a balanced number of maternal and paternal genomes, as departure from the 2m:1p ratio leads to kernel abortion (Cooper 1951; Lin 1984). Kernel development is further tied to the physiology of the maternal plant. Cessation of kernel growth can be induced by heat stress, water stress, the exogenous application of stress-associated growth regulators, or a disruption in the delivery of photosynthate (Myers et al. 1990, 1992; Engelen-Eigles et al. 2000). While the endoreduplication cell cycle can be inhibited, it is an order of magnitude less sensitive than the mitotic cell cycle to physiological perturbation (Myers et al. 1990; Mambelli and Setter 1998).
In this study, we investigated the genetic regulation of endoreduplication in maize endosperm using inbred lines that differ in the quantity of endoreduplication. Measurements of nuclear DNA content were scored as quantitative traits, and their inheritance was investigated. Analyses of the variability of these traits predicted genetic regulation through the maternal lineage as the predominant mode of inheritance. By monitoring endoreduplication through multiple generations, we confirmed it is a heritable trait. Consequently, reciprocal backcrosses were initiated to introgress alleles causing a high level of endoreduplication into a low-endoreduplicating inbred background to assess the importance of this trait for kernel development.
MATERIALS AND METHODS
Plant material: Maize plants were grown at the University of Arizona West Campus Agricultural Facility in the spring and fall seasons of 1998, 1999, and 2000 and in the greenhouse during the winter of 2000. Pollinations and harvesting were performed in the morning. Ears were broken from the stalk at the shank and placed in crushed ice for transport to the laboratory. Stocks of the inbred lines A188, B37, B73, Mo17, Oh545, Va99, W64A, B37o2, B73o2, Oh545o2, Va99o2, and W64Ao2, open-pollinated varieties of 8-Row Flint and Yellow Flint, and the sweet corn Florida StaySweet are maintained in our laboratory. South American accessions Bolivia 1044 and Venezula 568, inbred lines Nc282 Nc306, Nc318, and Nc320, were provided by M. Goodman (North Carolina State University). The popcorn inbred lines A1-6, Hp58, Kp58k, Sg18, Sg32, and Sg1533 were provided by R. B. Ashmann (Purdue University). For the analyses of variance and mean components, a 32 design was employed where nine generations were created by crossing two parents and their F1 in each pairwise combination. For these experiments B73 was crossed with the dent corn Mo17 or the popcorns A1-6, Kp58k, and Sg18. For each set of crosses, the parental types, reciprocal F1, and four BC1 reciprocal generations were produced, a total of nine generations. Crosses between B73 and Kp58k were affected by dent sterility factors. These factors exist in some popcorns and lead to allele-specific pollen abortion and poor seed set when the popcorn serves as the maternal parent (Glover and Mertz 1987; Ziegler 2001). Thus, all F1 plants used to generate F2 and BC1 data in B73 × popcorn crosses were the progeny of popcorn pollen on B73 ears. In all cases except Kp58k × B73 F1, kernel abortion was not complete and enough F1 and BC1 kernels were obtained for analysis when the popcorn inbred was used as the female parent. Sg18 does not contain alleles affecting dent sterility (Kindiger and Beckett 1992).
Flow cytometric analyses: Developing kernels were carefully removed from the middle third of ears with a razor blade or scalpel. A razor blade was used to make an incision through the pericarp, and the pericarp, nucellus, and developing embryo were removed. The dissected endosperm was placed in a 60 × 15-cm round polystyrene petri plate on a ceramic floor tile resting on a bed of ice. The tissue was overlaid with 0.5 ml of ice-cold lysis buffer (200 mm Tris-HCl pH 7.5, 4 mm MgCl2, 0.1% Triton X-100, filtered through a 22-μm filter) and chopped using a new single-edged razor blade (no. 55411-050, VWR, South Plainfield, NJ). The homogenate was taken up into a 2-ml plastic pipette through four layers of cheese-cloth and transferred to a 3-cc syringe housing (Becton-Dickinson, Franklin Lakes, NJ) fitted with 100 μm nylon mesh (Sefar International, Kansas City, MO) at the tip. The petri plate was rinsed with an additional 0.5 ml ice-cold lysis buffer, and this wash was also passed through the nylon mesh. The filtrate was collected in a 55 × 12-mm polystyrene tube (no. 55.484, Sarstedt, Newton, NC). Lysis buffer was added to adjust the volume of the homogenate to 1 ml, and 4′,6-diamidino-2-phenylindole (DAPI; Sigma, St Louis) was added to a final concentration of 4 mg/ml. Samples were held on ice no longer than 20 min prior to analysis. All samples were analyzed with a Partec CAIII flow analyzer (Partec, Münster, Germany) fitted with the standard filter set for DAPI analysis. Sheath fluid consisted of 22 μm filtered deionized water. The flow cytometer was controlled by Partec's CA3 software package at a resolution of 512 channels. Offline data analysis and figure preparation were performed using WinMDI software (Ver 2.8) kindly donated by J. Trotter (Trotter 2000).
During the initial screening of germplasm, three to five endosperms were chopped together in a single petri dish and data from a minimum of 10,000 nuclei were collected for each sample. For all analyses subjected to statistical evaluation, endosperms were chopped individually, and at least five kernels were assayed from each ear. Samples were analyzed immediately after chopping, and a minimum of 15,000 nuclei were counted. Numerous buffer systems (Tris, MOPS, phosphate, and HEPES), DAPI concentrations (2–20 mg/ml), additives (citrate, polyvinyl pyrrolidone, dithiothreitol, Ficoll, and glycerol), incubation times (0–300 min postchopping), tissue storage procedures (0–6 days at 4°), and buffer component concentrations were tested. Flow cytometric analysis and microscopic analysis of DAPI-stained samples clearly indicated that the procedure described above was optimal for obtaining intact nuclei from fresh, developing maize endosperm.
Embryo rescue: Ears were harvested and sterilized by immersion in a solution of commercial bleach and water (20% v/v) with a drop of Tween-20 for 30 min. They were then immersed in sterile water two times for 15 min and placed in a sterile beaker. Kernels were removed from the ear using a sterile scalpel and placed in a sterile petri dish. The pericarp was removed with a razor blade, the endosperm placed in a petri plate for flow cytometric processing, and the embryo placed with the scutellum facing up in a 12 × 150-mm culture tube containing 3 ml of MS-RD rescue medium (4.33 g Murashige and Skoog salts supplemented with 100 mg/liter myo-inositol, 0.4 mg/liter nicotinic acid, 0.2 mg/liter thiamine-HCl, 20% sucrose, adjusted to pH 5.7–5.8 with 1 m KOH, solidified with 0.8% agar; Murashige and Skoog 1962). Flow cytometric analysis of endosperm nuclei was performed as described above. Embryos were placed in the dark at 25°, checked daily, and moved to a growth chamber (28°, 16L:8D) following seedling emergence. Seedlings were allowed to green and then transplanted to soil for growth to maturity in the greenhouse.
Statistical analyses: We routinely analyzed data of five kernels from three ears at 19 DAP for each generation. In the A1-6 × B73 and Kp58K × B73 experiments one generation failed. In all other cases, at least two ears and no less than eight kernels were analyzed per generation. The statistical output from manually gated histograms produced in the Win-MDI
Coefficients for genetic components of the variance
| Triploid zygotic | Diploid zygotic | Maternal sporophytic | Maternal zygotic Vazm | Paternal zygotic Vap | ||||||
|---|---|---|---|---|---|---|---|---|---|---|
| Coefficient name | Ve | Vat | Vdt1 | Vdt2 | Vad | Vdd | Vam | Vdm | ||
| B73 | 1 | 0 | 0 | 0 | 0 | 0 | 0 | 0 | 0 | 0 |
| Other parent | 1 | 0 | 0 | 0 | 0 | 0 | 0 | 0 | 0 | 0 |
| B73 × other parent | 1 | 0 | 0 | 1 | 0 | 0 | 0 | 0 | 0 | 0 |
| Other parent × B73 | 1 | 0 | 0 | 0 | 0 | 0 | 0 | 0 | 0 | 0 |
| F2 | 1 | 5/9 | 3/16 | 3/16 | ½ | ¼ | 0 | 0 | 1 | 1 |
| F1 × B73 | 1 | 4/9 | ¼ | 0 | ¼ | ¼ | 0 | 0 | 1 | 0 |
| F1 × other | 1 | 4/9 | ¼ | 0 | ¼ | ¼ | 0 | 0 | 1 | 0 |
| B73 × F1 | 1 | 1/9 | 0 | ¼ | ¼ | ¼ | 0 | 0 | 0 | 1 |
| Other × F1 | 1 | 1/9 | 0 | ¼ | ¼ | ¼ | 0 | 0 | 0 | 1 |
a, additive effect; d, dominance effect; e, error and environment; subscripts t, d, m, zm, and p refer to triploid, diploid, maternal sporophytic, zygotic maternal, and zygotic paternal modes of inheritance, respectively.
software program were imported into an Excel spread-sheet (Microsoft, Redmond, WA) where three values describing the nuclear DNA content were calculated for each endosperm. The mean ploidy of all nuclei, E3P, was calculated by multiplying the number of nuclei in each ploidy class by the number of genome copies (C) value and dividing the sum of these products by the total number of nuclei. The mean ploidy of nuclei with a C value greater than three, referred to as E6P, was calculated as for E3P, except the 3 C class was excluded. The recruitment of nuclei to an endoreduplication cell cycle was estimated by calculating the percentage of nuclei with >3 C DNA content and is referred to as %E.
The variances of E3P, E6P, and %E values from each cross were tested for variance components. Coefficients for genetic variance components were taken from Foolad and Jones (1992) with the exception of additional additive variance components considering zygotic parent-of-origin specific genetic components. All components tested are summarized in Table 1. Lowercase a stands for additive and d for dominance inheritance patterns. The subscripts refer to the mode of inheritance predicted by the coefficients with t, d, m, zm, and p referring to triploid, diploid, sporophytic maternal, zygotic maternal, and zygotic paternal patterns of inheritance, respectively. The subscripts one and two differentiate the two dominance coefficients predicted for the allelic interactions Aaa and Aaa in the triploid model. Mathematically indistinguishable models for variance components are obtained when models containing additive zygotic maternal and zygotic paternal components (Vazm and Vap) are compared with models containing additive zygotic maternal and additive diploid components (Vazm and Vad). The difference is simply that when Vazm and Vad are estimated, variance preferentially partitioned into Vad with respect to the Vazm and Vap predictions.
A maximum likelihood (ML) method (Hayman 1960), as modified in Lynch and Walsh (1997), was used to estimate variance components from the endoreduplication data. The variance of endoreduplication measurements from each ear were utilized as the dependent variable. These variances were weighted with the inverse of the unbiased estimate of their variance (Lynch and Walsh 1997). Regression was then carried out using the coefficients of genetic and environmental variance components presented in Table 1. The variances for each ear predicted by the regression results were tabulated, and the inverse of the unbiased estimates of these expected variances was calculated and used to weight the observed variances for a second iteration of regression. Regressions were repeated, recalculating the weighting term at each iteration. The weighted chi-square value was then calculated by summing the deviation of the observed and expected variances divided by the weighting factor. ML iterations were ceased when the weighted chi-square values changed <1 × 10⁻⁵ for three consecutive iterations. After convergence, goodness of fit was evaluated by means of a weighted chi-square. Weighted chi-squares involving categories with five or fewer members are suspect as measures of the fit for a model. As a solution, measurements were pooled for each genotype and the nine or eight generation variances were used as the observed variances to perform the weighted chi-square as before. The P value was calculated at one less than the number of generations minus the number of estimated parameters. As a further test of the models, the generation variances were used to estimate genetic parameters. Both methods returned qualitatively similar results. Estimates from ear variances are reported, as they are generally more conservative. The narrow sense heritabilities for each component and the total were calculated according to Falconer and MacKay (1996). Analysis of components of the covariance between E3P, E6P, and %E for genetic and environmental components was performed similarly to that for variance analysis. Covariances were generated by multiplying the standard deviations of two traits for each individual and averaging the total for each ear. Coefficients and ML methods were identical to that for variance components.
Multiple genetic models describing the additive and dominance components of mean values were also tested. Coefficients for sporophytic, standard triploid, and diploid inheritance were taken from the testa, endosperm, and embryo models, respectively, from Foolad and Jones (1992). A model was generated for zygotic parent-of-origin expression, which is mathematically equivalent to a completely additive sporophytic model. All coefficients discussed in the text are presented in Table 2. Lowercase letters and subscripts are used identically to those described for variance components. The mathematical conundrum between maternal models including paternal or diploid additive components described for variance components is also true for mean components in this crossing design. To perform tests for components of the mean and investigate models of inheritance, weighted least-squares regression analysis was used to estimate the genetic contribution to mean E3P, E6P, and %E using the SPSS statistical
Coefficients for genetic components of the mean
| Triploid zygotic | Diploid zygotic | Maternal sporophytic | Maternal zygotic azm | Paternal zygotic ap | ||||||
|---|---|---|---|---|---|---|---|---|---|---|
| Coefficient name | Mean | at | dt1 | dt2 | ad | dd | am | dm | ||
| B73 | 1 | −1 | 0 | 0 | −1 | 0 | −1 | 0 | −1 | −1 |
| Other parent | 1 | 1 | 0 | 0 | 1 | 0 | 1 | 0 | 1 | 1 |
| B73 × other parent | 1 | −1/3 | 0 | 1 | 0 | 0 | −1 | 0 | −1 | 1 |
| Other parent × B73 | 1 | 1/3 | 1 | 0 | 0 | 0 | 1 | 0 | 1 | −1 |
| F2 | 1 | 0 | ¼ | ¼ | 0 | ½ | 0 | 1 | 0 | 0 |
| F1 × B73 | 1 | −1/3 | ½ | 0 | −½ | ½ | 0 | 1 | 0 | −1 |
| F1 × other | 1 | 1/3 | 0 | ½ | ½ | ½ | 0 | 1 | 0 | 1 |
| B73 × F1 | 1 | −2/3 | ½ | 0 | −½ | ½ | −1 | 0 | −1 | 0 |
| Other × F1 | 1 | 2/3 | 0 | ½ | ½ | ½ | 1 | 0 | 1 | 0 |
a, additive effect; d, dominance effect; e, error and environment; subscripts t, d, m, zm, and p refer to triploid, diploid, maternal sporophytic, zygotic maternal, and zygotic paternal modes of inheritance, respectively.
package (v. 10.01 SPSS, Chicago). Mean values were calculated for each ear and considered the dependent variable. The genetic components described in Table 2 were used as the independent variables. Each mean was weighted with the inverse of its variance. Regression was used to estimate the values of the population mean, each component, and the component significance. To assess the significance of the model, the P value was calculated according to a chi-square distribution for the residuals of the regression where d.f. = (n − p) −1, n being the number of ears and p being the number of parameters estimated. A variety of models were tested in each case. First, the mean component models consisting of genetic factors present in the variance component analysis were tested. These models were supplemented with the maternal additive and dominance coefficients for the maternal sporophytic model, as they cannot be detected in the variance component analysis. If inclusion of maternal coefficients not detected in the variance component analysis did not improve the fit of the data, they were not reported. To confirm and extend these analyses, a model consisting of all the coefficients was simultaneously evaluated by weighted leastsquares regression. Coefficients were systematically added and removed until an optimal model was produced. Finally, each of the individual modes of inheritance was tested singly. The result of a mean component analysis using the additive and dominance triploid model, which is the assumed genetic model for an endosperm trait, is reported. For example, if the variance component analysis detected zygotic paternal effects (Vap), the mean value predicted by this model for the last BC1 generation is given by the equation y = 1 × ap+ 1 × m, if no maternal sporophytic effects are present, and by y = 1 × ap + 1 × am + 0 × dm + 1 × m, if sporophytic additive and dominance effects are expected, where y is the observed variable, m is the mean of the population, and all other variables are from Table 2. In this way the values for each genetic effect can be estimated by generating a series of equations from Table 2 specific to any combination of genetic predictions, by estimating a solution by regression, and by evaluating the solutions for fit to the data.
For the analysis of variance and covariance components in the recurrent backcross progeny, family means of the offspring were compared to individual maternal parent values. The narrow sense heritability was then estimated by the slope (b) of the regression line (Falconer and McKay 1996). As segregation occurred only on the maternal side, only the maternal contributions to the genetic variance were calculated from these offspring-parent regressions. Modes of inheritance, other than the simple diploid model, were taken into consideration such that h2 = 2/3 × b for triploid inheritance and h2 = b in maternal zygotic parent-of-origin-specific inheritance. Progeny family means were weighted to take into consideration the number of individuals and the family variance (Falconer and McKay 1996).
RESULTS
Identification of maize inbreds differing in the level of endoreduplication in developing endosperm: To assess the phenotypic variation in the degree of endoreduplication among various types of maize, we performed flow cytometric measurements of endosperm at several stages of development. In general, we found little variation in the maximum measured mean C value (E3P) among most midwestern dent (A188, B37, Mo17, Va99, W64A, Oh545), South American landraces (Bolivia 1044 and Venezuela 568), flint (8-Row Flint and Yellow Flint), and sweet corn genotypes. In contrast, a number of popcorn inbreds (A1-6, Sg18, Sg1533, Sg32, HP58) exhibited dramatically higher levels of endoreduplication.
Figure 1 shows flow cytometric histograms illustrating the highest E3P detected for selected genotypes, and it illustrates the variation in the degree of endoreduplication among maize popcorn and dent genotypes. Sg1533 and A1-6 have nearly identical E3P values, but they are clearly different with regard to the proportion of endoreduplicated nuclei (%E). In Sg1533, fewer nuclei undergo endoreduplication, but those that do engage in more cycles of DNA replication. In A1-6 endosperm, nearly all nuclei participate in endoreduplication. Similar differences in the relationship between E3P and %E can be observed by comparing the histograms of nuclei from Sg18, Kp58k, and B73. The phenotypic variability we detected between these inbreds suggested that endoreduplication occurs earlier, is more rapid, involves
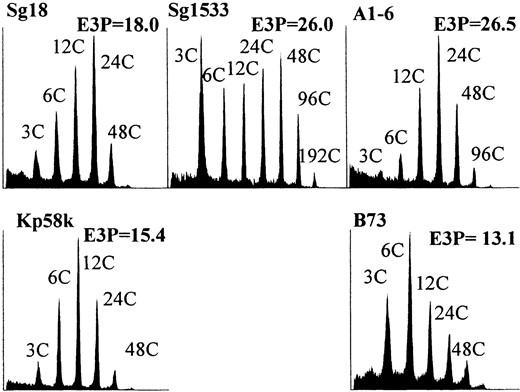
Flow cytometric measurement of mean nuclear ploidy (E3P) in selected inbred lines. Multiple endosperms from a single ear were combined for analysis. Histograms representing the endosperm with the highest measured ploidy for each inbred are illustrated. The x-axes are the log of the fluorescence intensity and the y-axes correspond to the relative frequency of a given intensity. The C value indicates the number of genome copies, and the E3P value describes the mean ploidy of all nuclei. The highest peak mean ploidy was attained at different stages of development for different inbreds as follows: B73, 23 DAP; Kp58k, 25 DAP; Sg18, 26 DAP; Sg1533, 29 DAP; and A1-6, 27 DAP.
a greater proportion of cells, or proceeds for a longer period of time in popcorns than in dent inbreds.
Developmental analysis of Sg18 × B73 crosses: To determine the timing of endoreduplication in genotypes with different levels of endoreduplication, we examined endosperms from B73 and Sg18 and (B73 × Sg18) × B73 at 13, 15, and 18 DAP (Figure 2). By 13 DAP, the E3P value for B73 endosperm was 9 C, and it increased to >10 C by 18 DAP. In Sg18, the E3P value at 13 DAP was ~13 C, and it did not increase up to 18 DAP. Similarly, the E3P value in the BC1 cross was 12 C at 13 DAP, and there was no further increase. The difference between the E3P values of the inbreds was significant by Student's t-test (P < 0.01) at each developmental stage. We attempted to measure endoreduplication in endosperm at later stages of development. However, samples from endosperms older than 19 DAP frequently clogged the tip at the base of the flow cell, making a large-scale analysis at developmental stages later than 19 DAP unfeasible. The observation of significant differences in endoreduplication between genotypes at 18 DAP suggested that a study of the genetic regulation of this trait was feasible.
Genetic analysis of endosperm endoreduplication in B73 × Mo17 crosses: To assay genetic factors influencing endoreduplication, crosses were made according to a 32 design, in which all nine pairwise crosses between B73, Mo17, and the F1 were generated. The nine means and variances calculated from this crossing design allowed for the detection of genetic components affecting endoreduplication expressed from the genome of the endosperm itself (zygotic expression) and the progenitor (sporophytic expression). Thus, this design facilitates
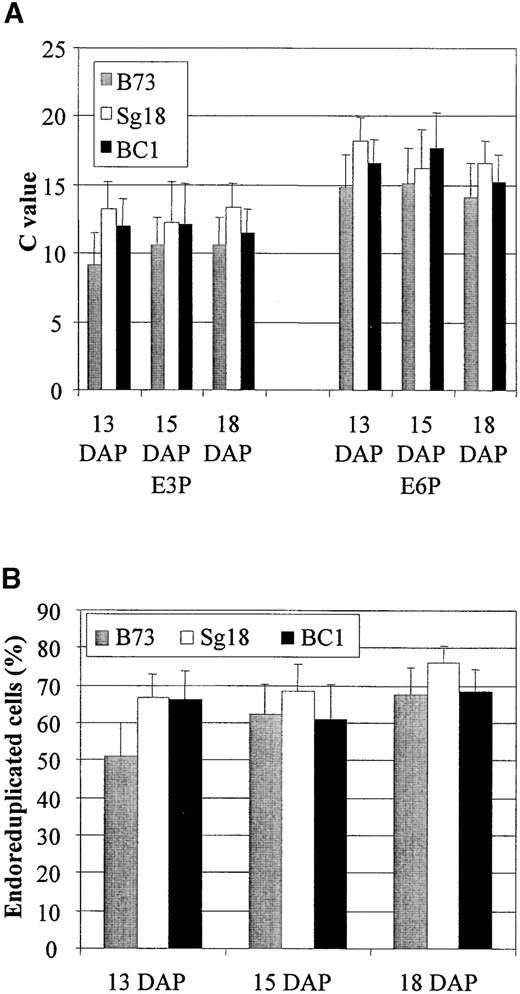
Measurement of ploidy level in B73, Sg18, and their BC1 endosperms at 13 to 18 DAP. (A) The E3P and E6P values indicate the mean ploidy and mean ploidy of endoreduplicated cells in the endosperms, while the error bars show the standard deviations of these measurements. (B) The %E indicates the frequency of cells with >3 C DNA content, while the error bars show the standard deviations of these measurements.
the testing of models in which genetic factors affecting differences in endoreduplication exhibit zygotic parent-of-origin specific inheritance, commonly referred to as parental imprinting. Each of the nine generations of B73 × Mo17 was grown in the fall of the 1999 field season, and single endosperms were subjected to flow cytometric analysis at 19 DAP.
To more completely describe the state of endoreduplication in the endosperm, three measurements of nuclear ploidy were calculated from the flow cytometric data, E3P, E6P, and %E. The mean ploidy (E3P) was calculated by weighting each nucleus by its respective ploidy. However, this value does not consider the relative distribution of nuclei in each ploidy class. The E3P value can be expressed algebraically as two potentially separate components, the mean ploidy of the endopolyploid nuclei (E6P) and the percentage of nuclei that endoreduplicate (%E). These two components can be used to calculate the E3P with the following formula:
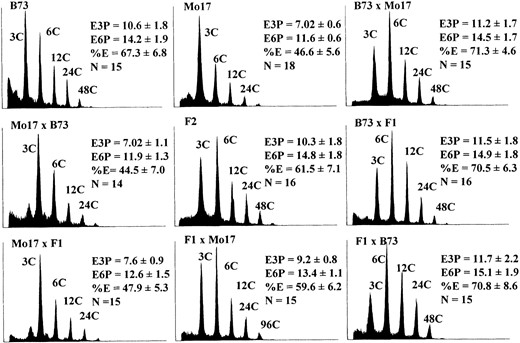
Endoreduplication phenotypes of nine B73 × Mo17 generations. Single endosperms were subjected to flow cytometric analysis. Representative histograms were selected for illustration based on their approximation of the mean ploidy value of the generation. The x-axes are the log of the fluorescence intensity and the y-axes correspond to the relative frequency of a given intensity. Means and standard errors were calculated from no fewer than 14 kernels. The C value indicates the number of genome copies per nucleus; E3P is the mean C value of all nuclei; E6P is the mean C value of endoreduplicated nuclei; and %E is the mean proportion of endoreduplicated cells.
E3P = (%E × E6P) + (3 × (1 − %E)). The E6P was calculated similarly to E3P, except the 3 C class was excluded. The %E was calculated by dividing the number of nuclei with a ploidy of 6 C or greater by the total number of nuclei. Figure 3 shows the E3P, E6P, and %E for each of the nine B73 × Mo17 generations, with the corresponding standard deviation and a representative flow cytometric histogram. Student's t-tests comparing the values for E3P, E6P, and %E between the parental lines were statistically significant (P < 0.01, data not shown). Moreover, Student's t-tests were unable to distinguish F1's from their respective ear parent (P > 0.05).
To investigate the mode of inheritance for the three endoreduplication traits, an analysis of variance components was performed. ML was employed to estimate the contribution of each of the factors in Table 1 to the nine generation variances in B73 × Mo17. ML estimates and their corresponding standard errors and P values and weighted chi-square values for each model are presented in Table 3. The variance in %E and E6P values was best predicted by a maternal parent-of-origin specific component, Vazm. Variance component analyses of these data yielded estimates with a rather poor fit (Table 3). The P values calculated were insufficiently small to reject these models (P > 0.05), and the addition of
Variance component analysis of the B73 × Mo17 cross
| Trait | Vazm | Ve | P value | χ2 |
|---|---|---|---|---|
| E3P | NS | NS | NS | NS |
| E6P | 0.17 ± 0.63 | 1.61** ± 0.34 | 0.06 | 14.9 |
| %E | 8.3 ± 9.7 | 29.9** ± 4.7 | 0.07 | 14.6 |
| Trait | Vazm | Ve | P value | χ2 |
|---|---|---|---|---|
| E3P | NS | NS | NS | NS |
| E6P | 0.17 ± 0.63 | 1.61** ± 0.34 | 0.06 | 14.9 |
| %E | 8.3 ± 9.7 | 29.9** ± 4.7 | 0.07 | 14.6 |
Significantly >0 at P < 0.05; **significant at P < 0.01. NS, no significant models detected.
further genetic coefficients did not improve the fit. The large chi-square values suggest that these results should be interpreted with caution. In all three analyses, the Mo17 parent was associated with lower means and variances (Figure 3), and this aspect of the data inflated the chi-square values for all models. A logarithmic scale transformation did not improve the fit of the model to the data (not shown). Variances from B73 and Mo17 generations were not equivalent for both E3P and E6P data (F-test, P < 0.05), suggesting that the two inbred lines differed in their sensitivity to the environment. Significant differences were also detected between Mo17 × B73 and either parental line, with the F1 variance being significantly greater than Mo17 and less than B73 (F-test, P < 0.05). However, our experimental design does not allow for an in-depth analysis of genotype by environment interactions. Nonetheless, it suggests that the assumption of variance equivalence in two inbred lines is not valid for this cross. The inclusion of a coefficient for the contributions of unequal variance by the parentals did improve the fit of the data (not shown). When this was done, chi-square values dropped and much of the error variance partitioned into the unequal variance term, but neither the coefficients of the genetic model nor the significance of Vazm changed. Given the statistical power of this variance component analysis and the rather modest estimates of Vazm provided, a much larger sample size would be required to identify significant components of the amplitudes described in Table 3. The failure to reject these models and the inability of a scale transformation to improve the fit suggest that the segregation variance in these crosses is simply insignificant.
To further test for the presence of genetic components in the variation of E3P, E6P, and %E in B73 × Mo17, an analysis of mean components was performed. Estimates of mean components were made, and the fit
Models describing the inheritance of endosperm ploidy in the B73 × Mo17 generations
| Triploid zygotic | Maternal | |||||||
|---|---|---|---|---|---|---|---|---|
| Trait/model testeda | Mean | at | dt1 | dt2 | am | dm | P value | χ2 |
| E3P/varcomp | — | — | — | — | — | — | — | |
| E3P/sporophytic | 9.33 | −2.1** | 0.98 | 2.0 | ||||
| E3P/triploid zygotic | 9.3 | −2.3* | −1.0 | 1.3 | 0.93 | 1.9 | ||
| E6P/varcomp | 13.5 | −1.6** | 0.98 | 2.1 | ||||
| E6P/triploid zygotic | 13.4 | −1.7* | −0.3 | 0.9 | 0.95 | 1.6 | ||
| %E/varcomp | 59.5 | −11.7** | 0.97 | 2.4 | ||||
| %E/triploid zygotic | 58.9 | −11.9* | −6.3 | 8.5 | 0.88 | 2.4 | ||
* Significantly different from zero at P < 0.05; **significant at P < 0.01.
Varcomp refers to the model defined in the variance component analysis and described in the text; all other models are specified in Table 2. (—) No models suggested.
of each model was tested by weighted chi-square (Foolad and Jones 1992; Lynch and Walsh 1997). A summary of the results describing the inheritance of mean values for endoreduplication traits in B73 × Mo17 is presented in Table 4. For all three traits, the data can be accounted for with a single maternal additive coefficient. Simultaneous regression of all coefficients resulted in significance only for the maternal additive coefficient (not shown). Neither the addition of a paternal additive component nor the inclusion of a dominant maternal coefficient significantly improved the fit of the data for any of the three traits. For E3P and E6P, the significance and size of the maternal additive mean component are inconsistent with maternal zygotic effects on the scale detected in the variance component analysis. These results are more consonant with additive sporophytic control of endosperm endoreduplication levels in B73 × Mo17.
The a priori genetic models for endosperm traits, the triploid models, were also tested for fit to the data. No models provided a better fit than that of the maternal sporophytic additive model. However, E3P, E6P, and %E can all be explained by the standard zygotic model (2m:1p). If a trait is under zygotic parent-specific control, the two dominance coefficients (dt1 and dt2) are expected to have opposite signs, compensating for the predicted additive effect (Table 2). Furthermore, if it were predominantly under maternal control, one would expect the at and dt1 coefficients to have the same sign (Table 2). This is the case for all three traits. Reworking the zygotic model for diploid zygotic inheritance, a phenomenon known to occur for some genes in the endosperm (Alleman and Doctor 2000) and possible if embryo genes control this phenotype in the endosperm, did not improve the fit of the data (data not shown).
Genetic analysis of endoreduplication in endosperm of B73 × popcorn crosses: To further address the genetic regulation of endoreduplication in maize endosperm, popcorn inbreds Sg18, A1-6, and Kp58k were crossed with B73, and a 32 design was used, as for the B73 × Mo17 crosses above. In the case of Kp58k and A1-6, one of the crosses failed (see materials and methods). The nine (or eight) generations for each of the three B73 × popcorn crosses were grown in the fall of 1999 field season, and endosperms from individual kernels were subjected to flow cytometric analyses at 19 DAP. As in the previous analysis, the models presented in Tables 1 and 2 were used to test for E3P, E6P, and %E variance and mean components by ML and weighted least-squares regression, respectively.
A set of representative histograms for the B73 × Sg18 cross is shown in Figure 4, which presents the mean E3P, E6P, and %E for each of the nine generations with the corresponding standard deviations. Student's t-tests between B73 and Sg18 inbred lines were significant for E3P and E6P (P < 0.01), but not for %E (P > 0.05). Again, as with B73 × Mo17, F1's could not be distinguished from their maternal progenitor (P > 0.05).
The mode of inheritance for each endoreduplication trait was first tested by variance component analysis. The results from the ML estimation of variance components for all three traits in the B73 × Sg18 generations are summarized in Table 5. Variance component analyses of E6P data identified maternal zygotic (Vazm) and paternal zygotic (Vap) components as the major genetic contributions to the variance. Variance component estimation from E3P and %E data, however, identified a single maternal zygotic component. Unlike the case for B73 × Mo17, Vazm estimates from E3P and E6P data were statistically significant. The maternal coefficient is not significantly different from zero in the best model to describe the %E variances. As with all three traits in B73 × Mo17, the values of Vazm calculated for the %E data and Vap for E6P are rather modest, and an increased sample size is required to detect significant components of this size. Together, these data strongly suggest that maternal zygotic effects are operating in E3P and E6P data sets in B73 × Sg18.
To confirm and extend these analyses of genetic components, an analysis of trait means was performed. The
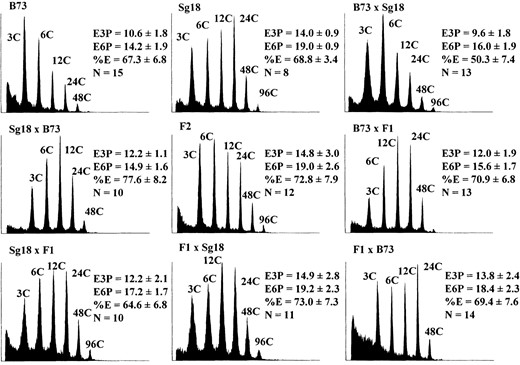
Endoreduplication phenotypes of nine B73 × Sg18 generations. Measurements and histogram selection were carried out as described in Figure 3. Calculations are from no fewer than eight kernels.
different modes of inheritance presented in Table 2 were tested as described above. Estimated mean components for the three endoreduplication traits of B73 × Sg18 crosses are summarized in Table 6. Analyses of E3P, E6P, and %E data using the coefficients predicted by the variance component analysis were significant. In all three cases, optimal models were produced when the maternal dominance coefficient from the maternal sporophytic model was included. All three mean components were significant for E6P, but only the maternal additive coefficient was significant for E3P. A model for %E mean values consisting of maternal additive and dominance coefficients could not be rejected despite the insignificance of either genetic coefficient. Additive and dominance maternal and additive paternal components were positive in sign for all three traits. Simultaneous regression of all coefficients on the data for any of the three traits led to the same model predicted by the variance component analysis. The standard triploid zygotic model could not be rejected for any of the three traits. However, coefficient signs were consistent with a trait under strong maternal zygotic influence for the E3P and E6P data. Thus, Sg18 alleles increase endoreduplication levels via zygotic parent-of-origin and maternal sporophytic effects.
The variances of E3P, E6P, and %E from B73 × A1-6 were also tested for the presence of genetic components. The E3P, E6P, and %E for these crosses are summarized in Figure 5 along with representative flow cytometric histograms. Endoreduplication measures of the parental, F1, and BC1 generations were indistinguishable from their ear parent by t-test (P > 0.5). Variance components for each of the three traits were estimated by ML using the coefficients presented in Table 1 and are summarized in Table 5. Models fitting the variance data for all three traits were identified. Data from E3P measurements were the best fit to a model consisting of a maternal zygotic component, Vazm, while E6P variances were best described by a combination of zygotic paternal and maternal effects, Vap and Vazm, respectively. Coefficients for maternal effects were significant for E3P and E6P models and were the only significant genetic coefficients
Variance component analysis of B73 × popcorn crosses
| Coefficients | ||||||
|---|---|---|---|---|---|---|
| Popcorn | Trait | Vap | Vazm | Ve | P value | χ2 |
| Sg18 | E3P | 5.5** ± 2.0 | 2.6** ± 0.37 | 0.26 | 10.0 | |
| E6P | 1.04 ± 1.5 | 3.7* ± 2.7 | 1.9** ± 0.51 | 0.85 | 4.0 | |
| %E | 12.9 ± 13.7 | 45.0** ± 6.6 | 0.77 | 4.9 | ||
| A1-6 | E3P | 4.4** ± 1.6 | 2.5** ± 0.50 | 0.80 | 3.8 | |
| E6P | 2.6 ± 1.7 | 4.4* ± 1.8 | 2.9** ± 0.70 | 0.69 | 3.9 | |
| %E | 5.9 ± 10.3 | 56.2** ± 5.5 | 0.20 | 10.9 | ||
*Significantly >0 at P < 0.05; **significant at P < 0.01.
Models describing the inheritance of mean endosperm ploidy traits in the B73 × Sg18 generations
| Triploid zygotic | Maternal | Paternal ap | |||||||
|---|---|---|---|---|---|---|---|---|---|
| Trait/model testeda | Mean | at | dt1 | dt2 | am | dm | P value | χ2 | |
| E3P/varcomp | 11.9 | 1.2** | 2.5 | 0.91 | 2.1 | ||||
| E3P/triploid zygotic | 12.5 | 1.5 | 3.2 | −0.5 | 0.75 | 3.4 | |||
| E6P/varcomp | 16.3 | 1.0* | 2.6* | 1.3* | 0.94 | 1.9 | |||
| E6P/triploid zygotic | 16.6 | 2.0 | 4.4 | −1.2 | 0.55 | 5.0 | |||
| %E/varcomp | 66.3 | 2.8 | 5.4 | 0.50 | 6.3 | ||||
| %E/triploid zygotic | 69.2 | 1.3 | 1.5 | 2.6 | 0.93 | 1.9 | |||
*Significantly different from zero at P < 0.05; **significant at P < 0.01.
Varcomp refers to the model defined in the variance component analysis and described in the text; all other models are specified in Table 2.
in the analysis of B73 × A16. Failure to detect significance of Vap may be attributable either to a lack of involvement in segregation variance or to the statistical power of this test, given the sample size. No genetic models contained significant coefficients in the analysis of the %E data. However, a model containing a maternal additive component could not be rejected and was the best fit to the data. These results strongly suggest that genes expressed from the maternal genome of the developing endosperm control E3P and E6P. These data weakly suggest paternal effects also play a role in the control of E6P.
Genetic components for the means of the three endoreduplication traits from B73 × A1-6 crosses were evaluated as described above, and the regression analyses are summarized in Table 7. Tests of the mean component models for E3P, E6P, and %E suggested by variance component analyses were significant for both E3P and E6P. Only the maternal additive coefficient was significant, and the inclusion of maternal dominance coefficients decreased the fit of the data. The paternal additive component of E6P was not significant, and unlike in the B73 × Sg18 experiment, was negative. As with the B73 × Mo17 crosses, the triploid zygotic additive and dominance model adequately described E3P or E6P (Table 4), but the sign of the coefficients is consistent with maternal control. Results of the analysis of %E means in this experiment were most consistent with no genetic influence, as the low chi-square value has more to do with low variation between generations for this trait (Table 7 and Figure 5). Thus, the analyses of E3P and E6P data from B73 × A16 strongly implicate zygotic maternal parent-of-origin specific inheritance.
Endoreduplication traits in the third popcorn cross, B73 × Kp58k, were subjected to the same types of statistical analyses described above. The mean values of E3P, E6P, and %E and the flow cytometric histograms for each of the generations are summarized in Figure 6. Student's t-tests of E3P, E6P, and %E at 19 DAP between parental inbreds were not significant (P > 0.05) for this cross, despite the apparent differences at later stages of development (Figure 1). Neither variance components
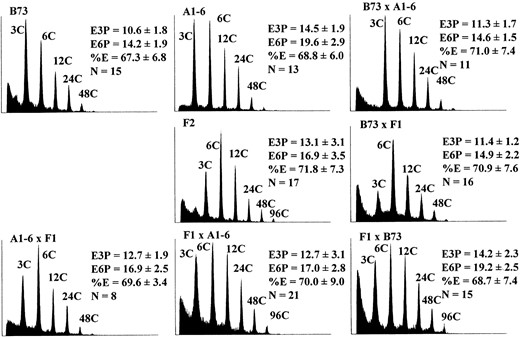
Endoreduplication phenotypes of eight B73 × A1-6 generations. Measurements and histogram selection were carried out as described in Figure 3. Means and standard errors were calculated from no fewer than eight kernels.
Models describing the inheritance of mean endosperm ploidy traits in the B73 × A1-6 generations
| Triploid zygotic | Maternal | Paternal ap | |||||||
|---|---|---|---|---|---|---|---|---|---|
| Trait/model testeda | Mean | at | dt1 | dt2 | am | dm | P value | χ2 | |
| E3P/varcomp | 13.2 | 1.9** | P > 0.99 | 0.54 | |||||
| E3P/triploid zygotic | 12.5 | 1.5 | 3.2 | −0.5 | 0.99 | 0.42 | |||
| E6P/varcomp | 17.3 | 2.7** | −0.2 | P > 0.99 | 0.97 | ||||
| E6P/triploid zygotic | 16.6 | 2.0 | 4.4 | −1.2 | 0.98 | 0.81 | |||
| %E/varcomp | 70.1 | 0.5 | P > 0.99 | 0.29 | |||||
| %E/triploid zygotic | 69.2 | 1.3 | 1.5 | 2.6 | P > 0.99 | 0.15 | |||
*Significantly different from zero at P < 0.05; **significant at P < 0.01.
Varcomp refers to the model defined in the variance component analysis and described in the text; all other models are specified in Table 2.
nor mean components for the three endoreduplication measures could be identified from the data collected for these crosses (data not shown). We concluded that higher endoreduplication levels at 19 DAP is not a general feature of popcorn germplasm.
Pleiotropy in the genetic control of endoreduplication traits: To assess the degree to which common genetic factors influence the three measurements of endoreduplication, an analysis of the components of covariance between them was done. A high phenotypic correlation between each of these traits was detected in all inbreds (data not shown). However, not all generations showed positive phenotypic correlation. To minimize reporting spurious associations, covariance component analyses were attempted only for crosses in which significant variance components were identified.
Genetic components of the covariance were estimated by ML with the same coefficients used for variance component estimation (Table 1), and these are presented in Table 8. Of all the trait combinations in both crosses, only the analysis of E3P and E6P covariance in B73 × A1-6 produced a significant model. Shared zygotic maternal regulation was predicted in this analysis. The covariance between E3P and %E data displayed positive phenotypic correlation and coefficients of the covariance could be estimated, but they failed to fit the data (P < 0.01; data not shown). Estimation of the components of the covariance for E6P and %E was unsuccessful due to a failure of the genetic models to fit the data, as above.
Selection for high endoreduplication individuals and experimental validation of heritability: One value of finding genetic variation in endoreduplication is that it allows the identification of kernel traits influenced by this process. Thus, we sought to introgress genes for high endoreduplication from Sg18 into B73 by a recurrent backcross procedure. For these crosses, pollen from B73 was used to fertilize B73 × Sg18 F1 ears and to generate BC1 kernels. Ears were harvested at 19 DAP and surface sterilized and the embryo and endosperm were dissected from individual kernels. Embryos were placed in germination medium while the corresponding
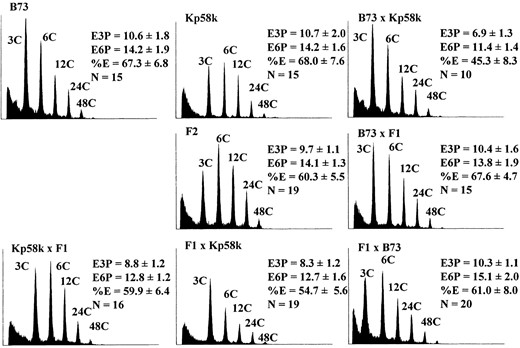
Flow cytometric phenotypes of eight B73 × Kp58k generations. Measurements and histogram selection were carried out as described in Figure 3, except that means and standard errors are from no fewer than 10 kernels.
Covariance component analysis of B73 × popcorn crosses
| Coefficients | ||||||
|---|---|---|---|---|---|---|
| Popcorn | Trait | CoVazm | CoVap | CoVe | P value | χ2 |
| Sg18 | E3P/E6P | NS | NS | NS | NS | NS |
| E3P/%E | NS | NS | NS | NS | NS | |
| E6P/%E | NS | NS | NS | NS | NS | |
| A1-6 | E3P/E6P | 3.7** ± 1.4 | 2.2** ± 0.5 | 0.52 | 6.13 | |
| E3P/%E | NS | NS | NS | NS | NS | |
| E6P%E | NS | NS | NS | NS | NS | |
*Significantly different from zero at P < 0.05; **significant at P < 0.01. NS, no significant models detected.
endosperm was used for flow cytometric analysis. We processed 86 BC1 kernels by this method. Subsequently, ears from 11 BC1 plants were fertilized with B73 pollen to generate BC2 kernels. Table 9 is a summary of the endoreduplication data collected from the BC1 and BC2 endosperms.
Regression analysis was used to determine if the endoreduplication characteristics of BC1 endosperms were accurate predictors of BC2 endoreduplication traits. The slope of the regression lines from these analyses are proportional to the narrow-sense heritability values (Falconer and McKay 1996). However, the relationship between the slope and the heritability is dependent on the mode of inheritance and crossing design (see materials and methods). The correlation, slope, and corresponding P values and standard errors calculated from these data are presented in Table 10, along with the heritability expected in such backcross progeny based on the variance components presented in Table 5. Heritabilities calculated for maternal zygotic inheritance from the backcross progeny data are well within the standard errors of those calculated for the 3 2 experiment. A high phenotypic correlation was observed for all three variables between the BC1 and BC2 generations. However, attempts to calculate the genetic correlation were unsuccessful and resulted in estimates greater than one (data not shown). This is expected for samples of this size (Lynch and Walsh 1997) and may be exacerbated by the shared environment within ears.
DISCUSSION
Two previous studies implicated maternal effects in the control of endoreduplication in maize endosperm. A difference in the mean ploidy (E3P) of nuclei in the central endosperm of Illinois High Protein and Illinois Low Protein maize was observed following Feulgen staining (Cavallini et al. 1995). When the E3P values were compared in reciprocal crosses, the F1 progeny were indistinguishable from the maternal parent. However, we found it difficult to determine how mean ploidies were reliably calculated on the basis of the data presented in the histograms (Cavallini et al. 1995; Figure 1). In another study, flow cytometry was used to evaluate endoreduplication in a variety of maize inbreds and their reciprocal crosses, F2 and F3 generations (Kowles et al. 1997). In this case, differences were observed in
B73 × Sg18 BC1 and mean BC2 values for endosperm endoreduplication traits
| Family size | BC1 trait | Mean BC2 trait ± SD | |||||
|---|---|---|---|---|---|---|---|
| Plant | E3P | E6P | %E | E3P | E6P | %E | |
| 15 | 45 | 23.6 | 29.2 | 76.2 | 17.8 ± 3.7 | 21.2 ± 3.0 | 80.4 ± 8.8 |
| 18 | 19 | 21.1 | 25.0 | 82.1 | 18.2 ± 3.2 | 22.1 ± 3.0 | 79.4 ± 7.1 |
| 24 | 18 | 10.4 | 16.2 | 55.8 | 11.2 ± 1.1 | 15.9 ± 1.3 | 63.9 ± 5.0 |
| 26 | 20 | 16.3 | 20.8 | 74.5 | 17.7 ± 2.7 | 21.6 ± 3.1 | 79.3 ± 4.6 |
| 59 | 20 | 16.7 | 22.4 | 70.6 | 19.2 ± 2.9 | 22.3 ± 2.7 | 83.8 ± 6.0 |
| 67 | 18 | 16.3 | 22.4 | 68.5 | 14.4 ± 1.8 | 18.0 ± 1.4 | 75.7 ± 6.0 |
| 73 | 9 | 11.8 | 16.5 | 65.3 | 12.5 ± 2.0 | 17.2 ± 1.6 | 66.1 ± 7.2 |
| 77 | 25 | 16.3 | 21.5 | 72.0 | 15.4 ± 2.3 | 19.0 ± 2.5 | 77.3 ± 3.7 |
| 79 | 15 | 16.0 | 21.1 | 71.8 | 15.4 ± 1.8 | 19.1 ± 1.8 | 76.9 ± 4.7 |
| 82 | 20 | 17.4 | 25.4 | 58.8 | 16.5 ± 2.7 | 20.3 ± 3.1 | 77.5 ± 4.6 |
| 83 | 23 | 9.0 | 16.6 | 44.3 | 15.2 ± 2.0 | 20.7 ± 1.5 | 68.4 ± 7.4 |
Heritability of endosperm endoreduplication traits in B73 × Sg18
| Offspring-parent | 32 design h2azm | |||
|---|---|---|---|---|
| Trait | Slope | SE | P value | |
| E3P | 0.409 | 0.13 | 0.014 | 0.579 |
| E6P | 0.300 | 0.14 | 0.064 | 0.557 |
| %E | 0.412 | 0.14 | 0.018 | 0.222 |
| Offspring-parent | 32 design h2azm | |||
|---|---|---|---|---|
| Trait | Slope | SE | P value | |
| E3P | 0.409 | 0.13 | 0.014 | 0.579 |
| E6P | 0.300 | 0.14 | 0.064 | 0.557 |
| %E | 0.412 | 0.14 | 0.018 | 0.222 |
flow cytometric histogram peak asymmetry from endosperms of different inbred backgrounds. These peak asymmetries appeared more like the maternal than the paternal parent in 86% of the crosses analyzed, suggesting maternal control of this phenotype. When the variance of endosperm E3P values was compared between generations, the parental, F1, and F2 generations had similar variance, while the variance of the F3 generation was fourfold higher. The authors discussed the results of crosses in which maternal or paternal control of endosperm mean ploidy were observed, but the data were not presented (Kowles et al. 1997). The statistical method employed was an F-test for variance equivalence between the variances of generations, rather than the test of a genetic model. In both the Cavallini et al. (1995) and Kowles et al. (1997) studies, the crossing design of the experiments did not permit a thorough analysis of the inheritance of endoreduplication traits.
In this study, we set out to measure the genetic contribution to variation in endoreduplication between maize genotypes. Our approach differed from previously described studies of endoreduplication in several ways. First, we labeled nuclei with a more DNA-specific fluorochrome, and we did not fix tissue samples prior to nuclear isolation and analysis. This might explain why we did not observe genotype-dependent peak shapes in flow cytometric histograms (Kowles et al. 1997). Rather, our flow cytometric data showed a normal distribution of fluorescence intensity around peak means in all genotypes. Second, we did not attempt to measure endoreduplication in selected regions of the kernel. Perhaps this is why we did not observe dramatic differences in E3P values between normal and o2 endosperms in the B37, B73, Oh545, Va99, or W64A inbreds (data not shown), as was observed by microphotometry of the central endosperm cells (Kowles and Phillips 1985). Third, three traits were calculated from each flow cytometric histogram to more accurately describe endoreduplication. Despite the differences between our data and those previously reported, measurements of E3P in dent inbreds by flow cytometry were similar (Kowles et al. 1990, 1997; Schweizer et al. 1995).
The three endoreduplication traits (E3P, E6P, and %E) calculated from the flow cytometric data address different aspects of endoreduplication. Previous studies typically reported the mean ploidy (E3P) of the endosperm, which is a combined measure of the frequency of endoreduplicated cells in a population of cells and the average number of DNA rereplication cycles in these cells. We propose that the mechanisms for initiation and reiteration of the endoreduplication cell cycle need not share the same regulatory components. Indeed, when a covariance component analysis was performed on E6P and %E data, no significant relationship was detected (Table 8). The mean ploidy of nuclei >3 C, the E6P value, is perhaps the most accurate single estimate of the number of rounds of DNA rereplication. Although 6 C nuclei are typically considered in G2, we included 6 C nuclei in our calculations of %E and E6P. Previous observations of a negligible mitotic index by 14 DAP (Kowles and Phillips 1985) suggest that the vast majority of 19-DAP 6 C nuclei are not poised to divide.
We observed differences in endoreduplication between inbred lines as early as 13 DAP, and routine flow cytometric analysis of nuclei from single endosperms was possible between 13 and 19 DAP (Figures 2, 3, 4, 5 and 6). In some cases, we were able to assay endoreduplication at later stages of development, and the results suggested this process continues beyond 19 DAP (cf. Figure 1 and Figures 2, 3, 4, 5 and 6). The interpretation of data regarding ploidy level after 20 DAP is complicated by the fact that cells in the central starchy endosperm begin to undergo cell death at this time (Young et al. 1997; Young and Gallie 2000). We do not know the relationship between endoreduplication traits at 19 DAP and the final levels of endoreduplication. There is also no clear relationship between endoreduplication at 19 DAP and mature kernel phenotypes, such as starch and protein content. However, we selected 19 DAP as the best developmental stage for large-scale analyses of endoreduplication, because, among the possible stages for measurement, it should be closest to the final level of endoreduplication.
Modes of inheritance: In this study, we attempted to partition maternal genetic contributions into sporophytic and gametophytic components via quantitative genetics. A number of published plant genetic studies have utilized maternal genetic components without considering zygotic parent-of-origin-specific effects. Up to this point, most studies of zygotic parent-of-origin-specific inheritance relied on embryo lethal phenotypes or molecular markers (e.g., differential mRNA accumulation or DNA methylation). Quantitative genetic experiments, such as the one described in this work, allow for the detection of zygotic parent-of-origin inheritance, if such a mechanism is operating on the measured trait. This could benefit the study of gametophyte-regulated events and parental imprinting during seed development. The study of nonlethal phenotypes affected by uni-parental gene expression may be more informative about the traits influencing seed development, and under selection, in the natural and cultivated history of maize (see below).
The analyses presented here strongly suggest maternal genetic control of endoreduplication in maize endosperm as a general phenomenon. Robust results were obtained for maternal influence on endoreduplication levels in the B73 × Mo17, B73 × Sg18, and B73 × A1-6 crosses (Tables 3, 4, 5, 6 and 7). Variance component analyses did not detect any significant genetic components for B73 × Mo17, a result consistent with sporophytic or cytoplasmic inheritance of endoreduplication traits. Comparison of variances from parental and F1 generations by F-tests demonstrated significant differences. Theoretically, the variances of these four generations should be equivalent and reflect the deviation in measurements caused by error and the environment. The simplest explanation for these results is a differential sensitivity to the environment for these two genotypes. While an intriguing suggestion, the design of our experiments did not allow for a more thorough examination of genotype by environment interactions for this cross. Nonetheless, the failure to detect segregational or “breakout” variance in the F2 and BC1 generations is unlikely to be due to a masking effect by the genotype by environment interaction effect. Mean component analyses in this cross of the three endoreduplication traits detected additive maternal effects (Table 4) and t-tests between generations were consistent with maternal control. These results suggest that the genes affecting variation in E3P, E6P, and %E traits in B73 × Mo17 are expressed from the ear parent. As B73 and Mo17 are midwestern dent-type inbreds, these results are consistent with previous conclusions about maternal sporophytic control made by Kowles et al. (1997) from crosses between multiple midwestern dent varieties. However, our crossing design is not optimal for the detection of cytoplasmic influence and cytoplasmic effects may be important maternal components influencing endoreduplication trait mean values. In contrast to these results, significant genetic components of the variance were detected in both B73 × A1-6 and B73 × Sg18 crosses. In both crosses, maternal zygotic components were significant in models describing E3P and E6P variances (Table 5). Mean component analyses detected significant maternal additive effects, consistent with zygotic maternal effects (Tables 6 and 7). In the popcorn analyses, additional maternal sporophytic effects cannot be ruled out, and sporophytic maternal effects may influence the magnitude of the maternal additive mean components. In the B73 × Sg18 mean component analyses, the addition of a maternal dominance coefficient, which is specific to maternal sporophytic inheritance, improved the fit of the mean component model to the data, but was significant only for E6P data.
Despite the narrow germplasm base of popcorns (Senior et al. 1998), no one model of inheritance was able to explain the variation in endoreduplication between popcorns and B73 (Tables 5, 6 and 7). Indeed, there was no detectable genetic variability between Kp58k and B73 at 19 DAP for any of the traits analyzed. Additionally, the inclusion of a paternal zygotic component improved the fit for E6P data for the B73 × Sg18 and B7s × A1-6 experiments. The paternal additive coefficient was not significant in the variance component analyses but was in the mean component analysis of B73 × Sg18 (Tables 5 and 6). As noted previously, it is impossible to distinguish between a maternal and paternal zygotic model, and a maternal zygotic and diploid additive model in this crossing design. An experiment in which individual loci, and not the mass action of multiple independent loci, are taken into account (e.g., QTL mapping) is one method to distinguish between maternal effects with paternal parent-of-origin or additive diploid effects in these crosses.
The presence of additive zygotic genetic effects influencing endoreduplication traits was partially confirmed by offspring-parent regression in B73 × Sg18. Significant regressions were returned for both E3P and %E, but not E6P (Table 10). Design of the offspring-parent experiment excluded paternally expressed genes, which were detected for E6P. The relationship of the slope of the regression line (b) to the heritability (h2) in this experiment is difficult to judge. If zygotic maternal expression is the only mode of inheritance, then the slope and the h2 value are the same. However, if multiple modes are operating simultaneously, the relationship between the two numbers must be arrived at experimentally. Moreover, if any genes influence both sporophytic and zygotic maternal effects, our estimate of h2 will be upwardly biased.
Conclusions regarding the %E values for the crosses analyzed in this study are the most problematic. Mo17, which has a relatively larger kernel and less endoreduplication than B73, was the only inbred in which Student's t-tests on %E values were significantly different from those of B73. One possible explanation for this is that a delay in the onset of endoreduplication in B73 × Mo17, with no change in endocycle rate, was measured at 19 DAP. The %E of inbreds A1-6 and Sg18, which have smaller kernels and greater levels of endoreduplication than B73, were not different from B73 at 19 DAP by t-test, nor were any significant genetic components detected. If cell ploidy and size are correlated, this suggests that cell number is dramatically reduced in these popcorns as compared to Mo17, B73, and Kp58k. Unlike the other two traits, the Ve components of the %E variance component analyses were by far the largest, suggesting that the majority of the variation in %E cannot be accounted for in this experimental design. In contrast, the estimate of h2 obtained in the offspring-parent regression analysis of B73 × Sg18 was the highest of the three traits (Table 10).
The results of this study neither demonstrate nor detract from the hypothesis that the phase change from a mitotic to an endoreduplication cell cycle and the iteration of endoreduplication cycles up to 19 DAP share regulatory genetic mechanisms. In all crosses, the %E and E6P measurements of parental inbreds showed positive correlation (data not shown). The colinearity of %E and E6P in inbred lines suggests environmental variation might similarly influence both traits. However, of the four trait/cross combinations with significant genetic variance components, only the covariance of one combination was described by a significant model (Table 8). Additionally, covariance analysis was not possible by offspring-parent regression. Nongenetic maternal coregulation of these traits, causing sibling covariance, is a reasonable explanation for the failures of both of these tests, given that multiple kernels were sampled from fewer ears. Thus, these covariance analyses are inconclusive and suggest that while E3P, E6P, and %E are correlated characters, the nature of their relationships and the presence or absence of genetic and environmental coregulation remain uncertain.
Relationship between endoreduplication and kernel growth: The detection of zygotic maternal control of endoreduplication could be the result of either gametophytically expressed genes exerting an effect on endosperm development or imprinting of genes expressed in the developing endosperm. None of the results obtained from this study are able to distinguish between these two mechanisms; however, previous data suggest that phenomena linked to genetic imprinting are operating in maize endosperm and are related to endoreduplication. Interploidy crosses in which a paternal excess is delivered to the endosperm produce a normal phenotype until the endoreduplication phase of development. Defects in endosperm cell differentiation and storage product accumulation then become evident (Charlton et al. 1995). The popcorn inbreds Sg18 and A1-6, but not the lesser endoreduplicated Kp58k, are highly fecund ear parents for maize × Tripsacum dactyloides crosses (Kindiger and Beckett 1992). If the presence and dosage of imprinted factors explains endosperm-based fertility barriers in Angiosperms (Birchler 1993), then increased fecundity and endoreduplication can be explained by an alteration in the effective dose of parent-of-origin effect genes. Most models for the establishment and maintenance of genetic imprinting postulate that it is a mechanism to alter the effective dose of genes affecting fitness (Hurst and McVean 1998). As imprinting is a stable evolutionary strategy, traits displaying this property need not currently contribute to fitness or be under selection. Thus, endoreduplication could have been selected before or after the domestication of maize. Indeed, teosinte endosperm undergoes endoreduplication (B. P. Dilkes, unpublished results).
Endosperm has a well-established role in providing nutrition to the developing embryo and seedling. If early endoreduplication in this tissue serves to fix endosperm cell number, this process could influence resource management. Consonant with this possiblity, the alleles responsible for an increase in endoreduplication (by 19 DAP) were acquired from the parent with the smaller kernel (Tables 4, 6, and 7). Likewise, if the number of chromatids possessing a copy of a gene, and not the number of cells possessing the gene, determines expression level, iterations of endoreduplication might be expected to increase metabolic output. Indeed, endoreduplication in maize endosperm is associated with an increase in chromosomal HMG proteins, which are thought to influence activation of storage protein gene transcription (Zhao and Grafi 2000). In this light, it is interesting that paternal effects were estimable for E6P but not for the other traits.
Acknowledgement
The authors thank the following persons and agencies for their support in carrying out the work described in this article. The authors are supremely grateful to Dr. Brenda Hunter and Georgina Lambert for technical support and assistance. The authors thank Dr. Robert Leonard for use of the Partec flow analyzer and inspiration, Dr. Bruce Walsh for assisting B.P.D. with quantitative genetic concepts, the Department of Sociology for computational resources, and Jason and Christy Clark Miller for statistical resources and discussions. Additionally, the authors thank Dr. Ramin Yadegari, Dr. Bruce Walsh, and members of the Larkins laboratory for critical reading of the manuscript at various stages of completion. The work described in this article was supported by a Department of Energy Grant (DE-96ER20242) to B.A.L. Additionally, R.A.D. and C.M.C. were supported by scholarships from Conselho Nacional de Desenvolvimento Cientifico e Tecnologico, Brazil.
Footnotes
Communicating editor: J. A. Birchler
LITERATURE CITED
