


Abstract
Negative interference describes a situation where two genetic regions have more double crossovers than would be expected considering the crossover rate of each region. We detected negative crossover interference while attempting to genetically map translocation breakpoints in maize. In an attempt to find precedent examples we determined there was negative interference among previously published translocation breakpoint mapping data in maize. It appears that negative interference was greater when the combined map length of the adjacent regions was smaller. Even positive interference appears to have been reduced when the combined lengths of adjacent regions were below 40 cM. Both phenomena can be explained by a reduction in crossovers near the breakpoints or, more specifically, by a failure of regions near breakpoints to become competent for crossovers. A mathematical explanation is provided.
THE occurrence of a crossover in one genetic region is usually associated with a decreased probability of a concomitant crossover in an adjacent region. This phenomenon is called positive crossover interference. Crossover interference in a genetic mapping experiment is often quantified as a value between zero and one, zero being no interference and one being complete interference (i.e., no double crossovers). Rarely, the opposite effect is found: a crossover in one region is associated with an increased probability of a concomitant crossover in an adjacent region. This phenomenon is called negative crossover interference since it is quantified as a negative number.
Instances of negative interference have been reported in simple meiotic organisms such as yeast (e.g., Lindegren 1955), Neurospora (e.g., Fincham 1974), and occasionally even in more complex eukaryotes such as Drosophila (e.g., Sinclair 1975). There was also a report of negative crossover interference in maize involving intragenic recombination of the gl1 locus (Salamini and Lorenzoni 1970).
We encountered an instance of negative interference while mapping reciprocal translocation breakpoints in maize, using classical genetic markers. Reciprocal translocations result from nonhomologous chromosomes exchanging regions. Breakpoints are where the nonhomologous regions are joined. The results of these mapping experiments are reported here. We also summarize published data from similar experiments that yielded other instances of negative interference. We propose that negative interference in translocation heterozygotes results from a reduced rate of the genetic regions near the breakpoint to become competent for crossovers. The arguments of Säll and Bengtsson (1989) have been adapted to explain how a reduction in competency could affect coincidence.
MATERIALS AND METHODS
All four stocks used in this study had breakpoints on the short arm of chromosome 1 (1S) and the long arm of chromosome 3 (3L). The breakpoints for T1-3(8995) were described as 1S.49 and 3L.06, for T1-3k as 1S.17 and 3L.34, for T1-3(5597) as 1S.77 and 3L.48, and for T1-3(5982) as 1S.77 and 3L.66 (Longley 1961). Translocation breakpoints were determined as the proportion of a pachytene chromosome arm that is proximal to the breakpoint, i.e., the interstitial segment. Figure 1 uses T1-3k as an example. At pachytene, the homologous regions of the translocation chromosomes and normal chromosomes synapse and form a quadrivalent cross-like structure. The center of the cross indicates the position of the breakpoints with moderate precision.
The breakpoints were mapped against three genetic loci that span 3L. Homozygous recessive tasselseed4 (ts4) conditions for pistillate floret development in the tassel as well as irregular kernel rows on the ear (Phipps 1928). Homozygous recessive liguleless2 (lg2) results in ligules and auricles being absent or nearly so (Brink 1933). Homozygous recessive anthocyananinless1 (a1) blocks the development of anthocyanin pigment (Emerson 1918). The most proximal locus relative to the centromere was ts4 and the most distal was a1. All four translocation stocks were homozygous for the dominant wild-type alleles at these loci.
The translocation stocks used in the mapping crosses were structural heterozygotes (T/N); i.e., the reciprocal translocation chromosomes (T) were heterozygous with their normal homologues (N). Because meioses in translocation heterozygotes result in chromosomal deficiencies, T/N plants are semisterile, meaning 50% abortion of pollen and ovules (Burnham 1962). Semisterility was used as a genetic trait to map breakpoint position. Each translocation stock was crossed with a normal chromosome (N/N) stock that was homozygous recessive
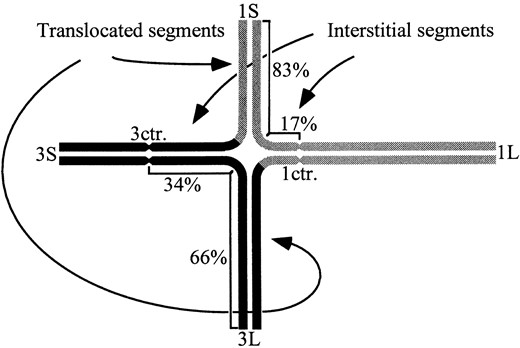
Quadrivalent formed by N/T1-3k. Normal chromosome 1 (upper right) is represented by a continuous shaded line. Normal chromosome 3 (lower left) is represented by a continuous solid line. The 3-1 translocation chromosome (upper left) and 1-3 translocation chromosome (lower right) are represented by lines that are both shaded and solid, indicating homology with the normal chromosomes. Centromeres (ctr.) are indicated by constrictions. Chromosome arms are labeled according to whether they are the short arm (S) or the long arm (L). The relative lengths of the interstitial and translocated segments are shown as percentages of the normal chromosome arm at pachytene.
for ts4, lg2, and a1. This cross produced mapping heterozygotes that segregated 1:1 for T/N and N/N plants. Some N/N plants were used as controls. The mapping heterozygotes were grown and testcrossed with N/N stocks that were again homozygous recessive for ts4, lg2, and a1. Usually, the mapping heterozygotes were testcrossed as females; i.e., their ears were pollinated with N ts4 lg2 a1 pollen. In one case, the mapping heterozygotes were testcrossed as males; i.e., their pollen was brought onto the ears of N ts4 lg2 a1 plants. The resulting kernels were separated according to color and were planted for screening. Pollen sterility was determined in the field using a 40× hand lens. Tassel and ligule phenotypes were scored on mature plants.
Most of the mapping experiments had three regions that were defined by three genetic loci and a 3L breakpoint (Table 2), which resulted in a parental and seven recombinant classes. The crossover rate for each genetic region was determined by adding the proportional size of each relevant class. Coincidence was determined for each pair of adjacent genetic regions.
RESULTS
Female testcross with no translocation present: Mapping data from N/N plants were obtained as a control (Table 1). The ts4-lg2 region was 27.3 cM and the lg2-a1 region was 32.5 cM. There was no detectable crossover interference (C = 0.99, SC = 0.13). The lack of detectable interference was probably due to the large genetic size of the two regions.
Female testcross for the 3L.06 breakpoint: The 3L.06 breakpoint of T1-3(8995) mapped to a position that was proximal to lg2 (Table 2). The ts4-lg2 region (24.1 cM) was slightly smaller than the control but the difference was not significant. Map data from translocation heterozygotes are expected to have reductions in crossovers close to the breakpoints (Anderson 1934; Burnham 1934). The lg2-a1 region (37.2 cM) was larger than what was found with N/N plants. Burnham (1934) showed a similar increase in a nonadjacent region in mapping with T5-9a. More remarkable was the presence of significant interference between ts4-lg2 and lg2-a1 (C = 0.45, SC = 0.09) even though the breakpoint was outside of the two regions.
Female testcross for the 3L.34 breakpoint: The 3L.34 breakpoint for T1-3k was tightly linked (0.6 cM) to lg2 (Table 2). The crossover rate in the ts4-lg2 region (22.0 cM) was less than what was found with N/N plants. The lg2-a1 region appeared also to have a lower rate of crossovers than N/N plants. The combined size of the lg2-T (0.6 cM) and T-a1 (27.1 cM) regions was 27.7 cM compared to 32.5 cM for the lg2-a1 region of the normal chromosome 3 (Table 1). Notable was negative interference for the lg2-T and T-a1 regions (C = 2.77, SC = 0.81). We show the order as ts4-lg2-T-a1, but the data
Mapping data obtained with normal chromosome 3
| Recombinants | |||||||||||||||
|---|---|---|---|---|---|---|---|---|---|---|---|---|---|---|---|
| Parental | Region 1 | Region 2 | Regions 1 and 2 | Crossover rate (cM) | Coefficient of coincidence | ||||||||||
| ts4 lg2 a1 | + + + | + lg2 a1 | ts4+ + | + + a1 | ts4 lg2+ | ts4+ a1 | + lg2 + | Totals (N) | Region | R | S | Adjacent regions | C | Sc | |
| 72 | 79 | 33 | 24 | 38 | 35 | 15 | 12 | 308 | ts4-lg2 | 27.3 | 2.5 | ts4-lg2-a1 | 0.99 | 0.13 | |
| Class subtotal | 151 | 57 | 73 | 27 | lg2-a1 | 32.5 | 2.7 | ||||||||
| Proportion (X) | 0.490 | 0.185 | 0.237 | 0.088 | |||||||||||
Data were obtained from the cross ts4 lg2 a1/+ + + × ts4 lg2 a1/ts4 lg2 a1.
do not argue strongly against ts4-T-lg2-a1. Although nominally significant (P < 0.05, z-score), the observation of negative interference resulted from only three double crossovers. All three double crossover plants received special scrutiny in phenotypic scoring and the genetic constitutions of the two individuals with the ts4 lg2 T a1/ts4 lg2 N a1 genotype were confirmed in a subsequent generation. Even so, we attempted to obtain further mapping data but changed the direction of the testcross.
The most notable difference between the male heterozygote and the female heterozygote maps for 3L.34 (Table 2) was an increased crossover rate in the T-a1 region (35.9 vs. 27.1 cM, respectively). Heterofertilization results in some kernels having embryos and endosperms that are nonconcordant for the a1 genotype, so some noncrossover plants would be assigned to a T-a1 crossover class and vice versa. Because misclassification is reciprocal, the rate of misclassification would have to be >19% to perturb the data by 9 cM. Although Sprague (1932) reported up to 25% heterofertilization in some strains, typical rates were 1 to 2% (Sarkar and Coe 1971). The ts4-lg2 region (18.2 cM) was smaller than what was found for the female heterozygote (Table 2). Although not statistically significant, the negative interference for lg2-T-a1 (C = 1.59, SC = 0.52) was consistent with the 3L.34 female testcross data. The male heterozygote data resulted in the same gene order and similar negative interference without the possibility of confounding effects from tertiary trisomies.
Female testcross for the 3L.48 breakpoint: The 3L.48 breakpoint of T1-3(5597) was tightly linked to lg2 at 1.8 cM (Table 2). The ts4-lg2 region (22.3 cM) and the T-a1 region (26.6 cM) were also remarkably similar to the
Mapping data obtained with translocation heterozygotes
| Stock | Breakpoint | Parental | Recombinants | Totals (N) | Crossover rate (cM) | Coefficient of coincidence | |||||||||||||||||||
| Region 1 | Region 2 | Region 3 | Regions 1 and 2 | Regions 1 and 3 | Regions 2 and 3 | Regions 1-3 | |||||||||||||||||||
| N ts4 lg2 a1 | T + + + | T ts4 lg2 a1 | N + + + | T + lg2 a1 | N ts + + | T + + a1 | N ts4 lg2 + | N + lg2 a1 | T ts4 + + | N + + a1 | T ts4 lg2 + | N ts4 + a1 | T + lg2 + | N ts4 + a1 | T + lg2 + | T ts4 + a1 | N + lg2 + | Region | R | S | Adjacent regions | C | Sc | ||
| Tl-3 (8995) | 3L.06 | 85 | 93 | 5 | 7 | 39 | 49 | 60 | 80 | 1 | 0 | 4 | 3 | 8 | 8 | 0 | 2 | 444 | T-ts4 | 5.0 | 1.0 | T-ts4-lg2 | 0.57 | 0.30 | |
| Class subtotal Proportion (X) | 178 0.401 | 12 0.027 | 88 0.198 | 140 0.315 | 1 0.002 | 7 0.016 | 16 0.016 | 2 0.005 | ts4-lg2 lg2-a1 | 24.1 37.2 | 2.0 2.3 | ts4-lg2-a1 | 0.45 | 0.09* | |||||||||||
| Stock | Breakpoint | ts4 lg2 N a1 | + + T + | + lg2 N a1 | ts4 + T + | + + N a1 | ts4 lg2 T + | + + T a1 | ts4 lg2 N + | ts4 + N a1 | + lg2 T + | ts4 + T a1 | + lg2 N + | ts4 + T a1 | + lg2 N + | ts4 lg2 T a1 | + + N + | + lg2 T a1 | ts4 + N + | Region | R | S | Adjacent regions | C | Sc |
| Tl-3k | 3L.34 | 177 | 185 | 51 | 47 | 0 | 0 | 69 | 59 | 1 | 0 | 18 | 22 | 2 | 1 | 0 | 0 | 632 | ts4-lg2 | 22.0 | 1.6 | ts4-lg2-T | 1.14 | 0.98 | |
| Class subtotal | 362 | 98 | 0 | 128 | 1 | 40 | 3 | 0 | Ig2-T | 0.6 | 0.3 | lg2-T-al | 2.77 | 0.81* | |||||||||||
| Proportion (X) | 0.573 | 0.155 | 0.000 | 0.203 | 0.002 | 0.063 | 0.005 | 0.000 | T -a1 | 27.1 | 1.8 | ||||||||||||||
| Tl-3k (male) | 3L.34 | 83 | 95 | 23 | 14 | 2 | 1 | 40 | 54 | 0 | 0 | 13 | 11 | 0 | 3 | 1 | 0 | 340 | ts4-lg2 | 18.2 | 2.1 | ts4-lg2-T | 0.78 | 0.72 | |
| Class subtotal | 178 | 37 | 3 | 94 | 0 | 24 | 3 | 1 | Ig-T | 2.1 | 0.8 | lg2-T-a1 | 1.59 | 0.52 | |||||||||||
| Proportion (X) | 0.524 | 0.109 | 0.009 | 0.276 | 0.000 | 0.071 | 0.009 | 0.003 | T -a1 | 35.9 | 2.6 | ||||||||||||||
| T1-3(5597) | 3L.48 | 272 | 291 | 87 | 78 | 7 | 4 | 125 | 83 | 2 | 1 | 36 | 21 | 2 | 2 | 0 | 0 | 1011 | ts4-lg2 | 22.3 | 1.3 | ts4-lg2-T | 0.75 | 0.39 | |
| Class subtotal | 563 | 165 | 11 | 208 | 3 | 57 | 4 | 0 | Ig2-T | 1.8 | 0.4 | lg2-T-al | 0.84 | 0.37 | |||||||||||
| Proportion (X) | 0.557 | 0.163 | 0.011 | 0.206 | 0.003 | 0.056 | 0.004 | 0.000 | T -a1 | 26.6 | 1.4 | ||||||||||||||
| T1-3(5982) | 3L.66 | 61 | 69 | 27 | 35 | 9 | 10 | 14 | 27 | 0 | 1 | 7 | 7 | 4 | 1 | 1 | 0 | 273 | ts4-lg2 | 28.6 | 2.7 | ts4-lg2-T | 0.27 | 0.18* | |
| Class subtotal | 130 | 62 | 19 | 41 | 1 | 14 | 5 | 1 | Ig2-T | 9.5 | 1.8 | lg2-T-al | 1.03 | 0.35 | |||||||||||
| Proportion (X) | 0.476 | 0.227 | 0.070 | 0.150 | 0.004 | 0.051 | 0.018 | 0.004 | T -a1 | 22.3 | 2.5 | ||||||||||||||
The data for 3L.06 were obtained from the cross N ts4 lg2 a1/T + + + × N ts4 lg2 a1/N ts4 lg2 a1. The data for 3L.34, 3L.48, and 3L.66 were obtained from the cross ts4 lg2 N al/+ + T + × ts4 lg2 N al/ts4 lg2 N a1. The data for 3L.34 (male) were obtained from the cross ts4 lg2 N al/ts4 lg2 N a1 × ts4 lg2 N al/+ + T +.
Value of C is significantly different from 1.00 (z-score, P ≤ 0.05).
3L.34 data. The main difference was that with 3L.48 there was no significant interference for lg2-T-a1 (C = 0.84, SC = 0.37).
To confirm that the two stocks possessed different reciprocal translocations, a T1-3k/N × T1-3(5597)/N cross was made. The progeny should segregate in a 1:1:1:1 ratio for the following individuals: N/N, T1-3k/N, T1-3(5597)/N, and T1-3k/T1-3(5597). The breakpoints for T1-3k and T1-3(5597) are such that a T1-3k/T1-3(5597) individual would be semisterile. Thus only N/N would be fully fertile and the remainder would be semisterile (1:3 ratio). If for some reason, such as a pedigree error, the two stocks possessed the same translocations, then the plants should segregate 1:2:1 for N/N, T/N, and T/T. Translocation homozygotes (T/T) are 100% fertile so fully fertile and semisterile plants would segregate at a 1:1 ratio. Thirty-three plants were screened; 7 were fully fertile and 26 were semisterile. This result was significantly different from a 1:1 ratio (P < 0.01) but not from a 1:3 ratio (0.5 < P < 0.7) per χ2 goodness of fit. Despite the similarity of the mapping data, these stocks possessed different translocations.
Female testcross for the 3L.66 breakpoint: The 3L.66 breakpoint of T1-3(5982) also mapped between lg2 and a1 (Table 2) and was closer to lg2 (9.5 cM) than to a1 (22.3 cM). The ts4-lg2 region (28.6 cM) was about the same as found with N/N. The ts4-lg2-T regions experienced significant interference (C = 0.27, SC = 0.18) while lg2-T-a1 did not (C = 1.03, SC = 0.35).
Translocation homozygote mapping: The recovery of ts4 lg2 T a1 double crossovers for T1-3k (3L.34), T1-3(5597) (3L.48), and T1-3(5982) (3L.66) allowed us to confirm all of their breakpoint positions. Individuals were produced that were structurally homozygous (T/T) but genetically heterozygous (i.e., ts4 lg2 a1/+ + +). These plants were testcrossed as females with ts4 lg2 N a1 pollen. Loci separated by a breakpoint will show independent assortment when mapped with translocation homozygotes. These data are presented in Table 3; a summary of the data is shown in Table 4. For these three translocations, the map distances for ts4-lg2 were significantly different from 50 cM (indicating linkage) but the map distances for lg2-a1 were not. These results indicate that in each case the breakpoints were located between lg2 and a1.
DISCUSSION
The original intent of this study was to genetically place four 3L translocation breakpoints. The four reciprocal translocation stocks were a subset of stocks we had developed to enhance Activator transposon tagging in maize (Auger and Sheridan 1999). Although negative interference was detected, it was a single instance based upon only a few double crossovers using widely spaced classical genetic markers. We were curious whether this one instance was anecdotal or had precedent.
Mapping data with translocation homozygotes
| Stock | Brakpoint | Recombinants | ||||||||||||||
|---|---|---|---|---|---|---|---|---|---|---|---|---|---|---|---|---|
| Parental | Region 1 | Region 2 | Regions 1 and 2 | Crossover rate (cM) | Coefficient of coincidence | |||||||||||
| ts4 lg2 a1 | + + + | + lg2 a1 | ts4 + + | + + a1 | ts4 lg2 + | ts4 + a1 | + lg2 + | Totals (N) | Region | R | S | Adjecant regions | C | Sc | ||
| Tl-3k | 3L.34 | 26 | 20 | 15 | 15 | 35 | 28 | 21 | 17 | 177 | ts4-lg2 | 38.4 | 3.7 | ts4-lg2-a1 | 0.98 | 0.08 |
| Class subtotal | 46 | 30 | 63 | 38 | lg2-a1 | 57.1 | 3.7 | |||||||||
| Proportion (X) | 0.260 | 0.169 | 0.356 | 0.215 | ||||||||||||
| Tl-3(5597) | 3L.48 | 48 | 52 | 18 | 26 | 46 | 37 | 26 | 21 | 274 | ts4-lg2 | 33.2 | 2.8 | ts4-lg2-a1 | 1.09 | 0.09 |
| Class subtotal | 100 | 44 | 83 | 47 | lg2-a1 | 47.4 | 3.0 | |||||||||
| Proportion (X) | 0.365 | 0.161 | 0.303 | 0.172 | ||||||||||||
| Tl-3(5982) | 3L.66 | 33 | 34 | 27 | 21 | 34 | 35 | 16 | 13 | 213 | ts4-lg2 | 36.2 | 3.3 | ts4-lg2-a1 | 0.82 | 0.10 |
| Class subtotal | 67 | 48 | 69 | 29 | lg2-a1 | 46.0 | 3.4 | |||||||||
| Proportion (X) | 0.315 | 0.225 | 0.324 | 0.136 | ||||||||||||
All crosses were ts4 lg2T a1/+ + T + × ts4 lg2 N al/ts4 lg2 N a1.
Summary of mapping ts4, lg2, and a1 on structurally homozygous chromosomes
| ts4-lg2 | lg2-a1 | |||
|---|---|---|---|---|
| R (cM) | S | R (cM) | S | |
| 3L N | 27.3* | 2.5 | 32.5* | 2.7 |
| 3L.34 | 38.4* | 3.7 | 57.1 | 3.7 |
| 3L.48 | 33.2* | 2.9 | 47.4 | 3.0 |
| 3L.66 | 36.2* | 3.3 | 46.0 | 3.4 |
| ts4-lg2 | lg2-a1 | |||
|---|---|---|---|---|
| R (cM) | S | R (cM) | S | |
| 3L N | 27.3* | 2.5 | 32.5* | 2.7 |
| 3L.34 | 38.4* | 3.7 | 57.1 | 3.7 |
| 3L.48 | 33.2* | 2.9 | 47.4 | 3.0 |
| 3L.66 | 36.2* | 3.3 | 46.0 | 3.4 |
Significantly different from 50 cM (P ≤ 0.05).
Reports of negative interference in meiotic organisms are rare and usually involve genetic regions that are very small (e.g., Salamini and Lorenzoni 1970). This was clearly not true in our case. Gene conversion (e.g., Lindegren 1955; Sinclair 1975) could not be the cause of negative interference in our data since the middle marker was a breakpoint, which is structural and not subject to conversion. There are a few published examples of negative crossover interference involving reciprocal translocations. Pearson and Wood (1980) found negative crossover interference when mapping three loci in mosquitoes (Aedes aegypti) that were heterozygous for a reciprocal translocation. Although the breakpoint was not used as a genetic marker, it was located between the outside markers. Tadmor et al. (1987) found negative interference in some interspecific hybrids of lentils (Lens spp.). The interspecific hybrids that resulted in negative crossover interference were heterozygous for an ancient reciprocal translocation. As with the mosquito, the regions showing negative interference spanned the translocation breakpoint.
Sybenga (1970; Sybenga and Mastenbroek 1980) described a type of interference peculiar to translocation heterozygotes. An interstitial segment tends to experience interference with either of the adjacent translocated segments, but has negative interference with the other interstitial segment. Likewise, translocated segments tend to have negative interference with each other. Sybenga (1970) attributed this phenomenon to complications in pairing. Our case of negative interference, as well as those of mosquitoes (Pearson and Wood 1980) and lentils (Tadmor et al. 1987), does not fit the phenomenon described by Sybenga (1970; Sybenga and Mastenbroek 1980) because negative interference was between the interstitial and terminal segments.
Summary of the data of E. G. Anderson: Anderson (1938, 1939, 1941; Anderson and Brink 1940; Anderson et al. 1955) published a series of articles presenting data from translocation breakpoint mapping in maize. Coincidence values were not routinely presented but could be calculated from the data tables. We compiled these data and computed coincidence for 142 different three-point mapping experiments involving breakpoints. Of the 60 mapping experiments where C > 1, 11 were significant (P < 0.05) and therefore exhibited negative interference. Figure 2 shows C plotted against the sum of the map lengths of the two regions for which C was determined. Triangles indicate mapping experiments where the breakpoint was the middle marker; squares indicate that the breakpoint was an outside marker. Our experiment for 3L.34 (female heterozygote) is included as an open triangle (Figure 2). It appears that C correlates negatively with the combined length of the two intervals for which C was computed (ρ = −0.83, Pearson correlation).
Curiously, all significant examples of negative interference from Anderson et al. (1955) came from mapping experiments on chromosome 4. This raises the possibility that chromosome 4 is somehow more subject to this phenomenon. Alternatively, it could be that this result was due to the relatively close spacing of the mapping markers. The sum of the map size of adjacent regions averaged 26.5 cM for chromosome 4 mapping experiments (Anderson et al. 1955) and 41.5 cM for all of the other chromosomes (Anderson 1938, 1939, 1941; Anderson and Brink 1940). If negative interference is associated with smaller region sizes, then the closer spacing of genetic markers on chromosome 4 may have been an important factor in yielding negative interference.
Anderson (1938, 1939, 1941; Anderson and Brink 1940; Anderson et al. 1955) also had 15 instances of significant positive interference where there was at least one crossover (i.e., where 1 > C > 0). These data are plotted in a fashion similar to the examples of negative interference (Figure 3). All but one (exception indicated as a triangle) had a breakpoint as an outside marker. In our mapping data, there was one case of positive interference involving breakpoint 3L.66 (Table 2). Here also, the breakpoint was an outside marker. Its data point (open square) is included in Figure 3. Interestingly, there appear to be different trends depending upon whether the sum of the two regions is more or less than ~40 cM. Above 40 cM, C correlates with combined region size (ρ = 0.99). Below 40 cM, the correlation reverses (ρ = −0.66). It appears therefore that regardless of whether interference is positive or negative, the value of C correlates negatively with the combined size of regions <40 cM.
Proposed explanation for negative interference in translocation heterozygotes: We propose that the negative interference detected in our mapping and in Anderson et al. (1955) was a consequence of a reduction in the rate of achieving competence for crossovers in the vicinity of the breakpoints. A reduction in crossovers in the regions near the breakpoints has long been attributed to the variable degree of asynapsis in those regions (McClintock 1933; Burnham 1934). A variable degree of asynapsis could also affect C if the crossover
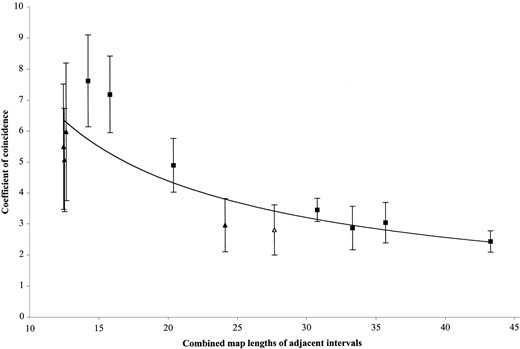
Coefficients of coincidence (C) for 12 translocation heterozygote mapping experiments that had significant negative interference. The value of C in each experiment is plotted against the combined size (centimorgans) of the two regions from which C was determined. The data suggest a trend where C correlates negatively with the combined size of the adjacent regions. Squares indicate the breakpoint was an outside marker; triangles indicate the breakpoint was the middle marker. Data from Anderson (1938, 1939, 1941; Anderson and Brink 1940; Anderson et al. 1955) are shown with solid triangles or solid squares and our data point is indicated by an open triangle. Error bars indicate standard error (SC). The trend curve was a best-fit selection of the graphing program (Microsoft Excel).
process involves at least two steps: first, the regional achievement of competence for crossovers as reflected by synapsis and, second, the selection of crossover sites.
Consider the cross-shaped structures formed by homologues at pachytene in translocation heterozygotes (Figure 4). At the center of the cross, there is an asynaptic region of variable size. Because the degree of synapsis around the breakpoints is variable, we infer that the competency for crossovers near the breakpoints is concomitantly variable. Figure 4 portrays two possible configurations of synapsis in translocation heterozygotes. Three genetic markers are indicated by the letters A,
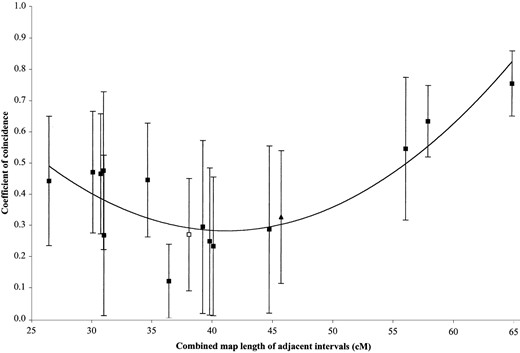
Coefficients of coincidence (C) for 16 translocation heterozygote mapping experiments that had significant positive interference. The value of C in each experiment is plotted against the combined size (centimorgans) of the two regions from which C was determined. The data indicate two trends: C correlates negatively with the combined size of intervals <40 cM and correlates positively >40 cM. Squares indicate the breakpoint was an outside marker; a triangle indicates the breakpoint was the middle marker. Data points from Anderson (1938, 1939, 1941; Anderson and Brink 1940; Anderson et al. 1955) are indicated by solid triangles or solid squares and our data point is indicated by the open square. Error bars indicate standard error (SC). The trend curve was a best-fit selection of the graphing program (Microsoft Excel).
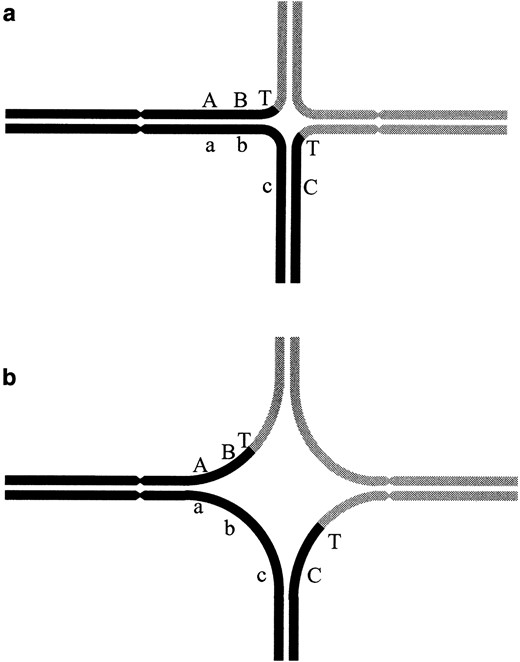
Translocation heterozygote quadrivalents with different degrees of asynapsis around the breakpoints. (a) A quadrivalent with maximal synapsis. (b) A quadrivalent with a large degree of asynapsis. The two normal chromosomes are indicated by a continuous solid and a continuous shaded line. The shade of the segments on the translocation chromosomes indicates homology with the normal chromosome. Centromeres are indicated by constrictions. Breakpoints are indicated by T and genetic markers are indicated by A, B, and C.
B, and C. The translocation breakpoints are labeled with the letter T. When synapsis is most nearly complete (Figure 4a) we expect that the crossover rates in all of the regions are most nearly normal. In contrast, the large degree of asynapsis around the breakpoint (Figure 4b) is associated with the elimination of crossovers in the A-B, B-T, and T-C regions. If these were the only two possible states, then the observed crossover rate for any of these regions would be the product of the rate of full synapsis, p, times the rate of selecting crossover sites in that region, r. Because normal homologues are nearly always fully synapsed (p = 1), the observed crossover rate typically reflects only the mechanism for selection of crossover sites. With a translocation heterozygote, the synapsis rate near a breakpoint is reduced (p < 1) and as a result so is the observed crossover rate. The closer that a genetic locus is to the breakpoint, the greater the likelihood that the region between it and the breakpoint will be asynaptic. Consider the regions defined by B-T-C (Figure 4). The closer that loci B and C are to T, the more often region B-T-C will be in the asynaptic region as portrayed in Figure 4b. The farther away B and C are from T, the more often B-T and T-C regions will be synapsed to some extent and thus be eligible for crossover.
Säll and Bengtsson (1989) demonstrated that additional factors can perturb AsE(C). Specifically, if a sample combines members of two subpopulations in the proportions of p and q, and one subpopulation (p) has a higher rate of recombination than the other (q), apparent negative interference could result even in the presence of actual positive interference. The potential for apparent negative interference is maximized in situations when the lower crossover rate approaches zero. Importantly, the effect is not limited to the situation with only two crossover rates; multiple crossover rates will also result in an increase of AsE(C).
The equation AsE(C) = c/p can be used to examine the phenomena observed in Figures 2 and 3. According to that equation negative interference will be observed whenever p < c. Evidence is mounting that the synaptonemal complex is necessary to establish interference (e.g., Sym and Roeder 1994). Even when there is maximal synapsis (Figure 4a), the synaptonemal complex is disrupted at the breakpoints. Therefore, when the middle locus is a breakpoint we expect c = 1 and AsE(C) is determined solely by the extent of successful synapsis. Anderson (1938, 1939, 1941; Anderson and Brink 1940; Anderson et al. 1955) had 53 mapping experiments with a breakpoint as the middle marker; 6 were significant (Figures 2 and 3, indicated with triangles) and 5 of those had negative interference.
Negative interference should be more difficult to achieve when the breakpoint is an outside marker. Consider the regions defined by A-B-T in Figure 4. The closer that A is to T, the less likely A-B-T will be synapsed. But when A-B-T is fully synapsed (Figure 4a), there should be interference (c < 1), which is also a function of genetic distance (e.g., Kosambi 1944). Therefore, since both c and p are expected to decrease as the size of A-B-T decreases, it becomes more difficult for p to exceed c. Anderson (1938, 1939, 1941; Anderson and Brink 1940; Anderson et al. 1955) had 89 mapping experiments with a breakpoint as an outside marker. Of the 21 significant mapping experiments, only 7 had negative interference (Figure 2).
Of the 16 cases of positive interference (Figure 3), those with combined regions under 40 cM appear to have an inflated value of C. This suggests that 40 cM is the approximate maximum genetic distance of asynapsis. If so, p ≪ 1 only when the combined regions are <40 cM. Above 40 cM, AsE(C) appears to be determined mostly by c, which decreases as the size of the region decreases. The increased scattering of points <40 cM in Figure 3 may be due to c being related to genetic distance (Rappolt et al. 1994) while p is related to physical distance. Since the crossover rate per physical distance is variable along a chromosome, it is unlikely that a simple function describes the relationship of c to p.
While the model AsE(C) = c/p may explain the occurrence of negative interference in translocation heterozygotes, it raises the question as to why negative interference is not the rule when a breakpoint is the middle marker. We suggest that there is an interaction with the effect described by Sybenga (1970; Sybenga and Mastenbroek 1980) since it results in positive interference without the mediation of the synaptonemal complex. This interaction would also explain why, in Figure 2, all of the mapping experiments with a breakpoint as the middle marker (triangles) are below the trend line. Anderson and Brink (1940) had one instance of significant positive interference when the breakpoint was the middle locus (Figure 3, triangle). This may have also resulted from Sybenga's (1970; Sybenga and Mastenbroek 1980) interference. The outside markers, ts4 and a1, were >45 cM apart so the effect of p upon AsE(C) was likely minimal. Coincidentally, ts4 and a1 were two of the markers used to produce our data, but we found no significant positive interference for ts4-T-a1 for any of the translocations in our study (data not shown but derived from Table 2).
The proposed explanation for negative interference in translocation heterozygotes may have wider implications. For a crossover to take place, a series of steps must be completed. Each step has its own probability of completion and each step is contingent upon the successful completion of the previous step. Some steps, such as correct homologue recognition, are conditional to large genetic expanses; others, such as the resolution of a crossover, are conditional to a single locus. What is measured in a mapping experiment is the product of the probabilities of all the necessary events within regions defined by markers. We propose that p defines the probability that some genetic expanse becomes competent for crossovers. Undetectable under normal circumstances, p becomes an identifiable factor only when the process that it represents is perturbed. Whenever negative crossover interference is encountered, it may be a reflection of that perturbance. Determining the basis of such a conditional step will help elucidate the sequence of events that results in crossovers.
Acknowledgement
We thank E. H. Coe for his critical reading and C. E. Ostlie for her grammatical review. We thank J. A. Birchler for his comments and suggestions. The reciprocal translocation stocks were provided by the Maize Genetics Cooperation Stock Center at the University of Illinois, Urbana, IL. W.F.S. acknowledges support from U.S. Department of Agriculture Special Research Grant. D.L.A. acknowledges support from U.S. Department of Agriculture Cooperative State Research, Education, and Extension Service and the Department of Energy Biosciences Program.
Footnotes
Communicating editor: B. S. Gill
LITERATURE CITED
