


Abstract
The genetic basis underlying inbreeding depression and heterosis for three grain yield components of rice was investigated in five interrelated mapping populations using a complete RFLP linkage map, replicated phenotyping, and the mixed model approach. The populations included 254 F10 recombinant inbred lines (RILs) derived from a cross between Lemont (japonica) and Teqing (indica), two backcross (BC) and two testcross populations derived from crosses between the RILs and the parents plus two testers (Zhong413 and IR64). For the yield components, the RILs showed significant inbreeding depression and hybrid breakdown, and the BC and testcross populations showed high levels of heterosis. The average performance of the BC or testcross hybrids was largely determined by heterosis. The inbreeding depression values of individual RILs were negatively associated with the heterosis measurements of the BC or testcross hybrids. We identified many epistatic QTL pairs and a few main-effect QTL responsible for >65% of the phenotypic variation of the yield components in each of the populations. Most epistasis occurred between complementary loci, suggesting that grain yield components were associated more with multilocus genotypes than with specific alleles at individual loci. Overdominance was also an important property of most loci associated with heterosis, particularly for panicles per plant and grains per panicle. Two independent groups of genes appeared to affect grain weight: one showing primarily nonadditive gene action explained 62.1% of the heterotic variation of the trait, and the other exhibiting only additive gene action accounted for 28.1% of the total trait variation of the F1 mean values. We found no evidence suggesting that pseudooverdominance from the repulsive linkage of completely or partially dominant QTL for yield components resulted in the overdominant QTL for grain yield. Pronounced overdominance resulting from epistasis expressed by multilocus genotypes appeared to explain the long-standing dilemma of how inbreeding depression could arise from overdominant genes.
INBREEDING depression, the overall decline in fitness-related traits arising from increased homozygosity, and heterosis, the superiority of F1 hybrids relative to parental performance, are fundamentally concerned with outbreeding and inbreeding. The negative effect of inbreeding and the positive effect of outbreeding have been known since ancient civilization (Goldman 1998; Filho 1999). Inbreeding depression and heterosis are considered two aspects of the same phenomenon (Falconer 1981; Mather and Jinks 1982). Heterosis is the opposite of inbreeding depression in the sense that the vigor lost as a consequence of inbreeding is recovered by crossing (Filho 1999). In agriculture, the use of heterosis in different crop plants and animals has achieved great success and is considered essential to meeting the world's food needs (Duvick 1999; Phillips 1999).
Despite its tremendous success in plant and animal breeding, the genetic basis of heterosis remains uncertain. Theories include dominance (Bruce 1910), overdominance (Shull 1908; East 1936), and certain types of epistasis (Stuber et al. 1973, 1992). In all cases, inbreeding depression is considered due to segregation and expression of deleterious recessive alleles in the homozygous state in inbred progenies (Allard 1960; Simmonds 1979; Filho 1999). Results from recent quantitative trait locus (QTL) mapping studies in major crops have done little to alleviate the controversy regarding the genetic basis of heterosis. Stuber et al. (1992) reported that overdominance was observed at most QTL for grain yield and components in two maize backcross F3 (BCF3) hybrid populations. However, Xiao et al. (1994) concluded that dominance is the major genetic basis of heterosis of most QTL segregating in two rice BCF1 populations. Li et al. (1997a,b) reported that hybrid breakdown (part of inbreeding depression) in an intersubspecific F4 population was largely due to additive epistatic loci, which implies epistasis as a genetic basis of heterosis. Yu et al. (1997) also reported that additive epistasis was largely responsible for the grain yield and its components in an F3 population of rice. Recently, we reported that epistasis and overdominance are the major genetic bases of inbreeding depression and heterosis for grain yield and biomass in five related rice mapping populations (Li et al. 2001). However, it remains unclear if the observed epistasis and apparent overdominance of the yield QTL actually resulted from the multiplicative actions of partially or completely dominant QTL affecting yield components, since yield per plant was the product of its three direct components, panicles per plant, grains per panicle, and grain weight. In this article, this possibility was examined by exploring the relative importance of main-effect QTL and digenic epistatic loci associated with inbreeding depression and heterosis of the three grain yield components in the five related mapping populations.
MATERIALS AND METHODS
Development of the experimental populations: A set of 254 F10 recombination inbred lines (RILs) derived from a cross between Lemont (japonica) and Teqing (indica), two BC1F1 populations, including 172 LTBCF1 hybrids (RILs × Lemont) and 177 TQBCF1 hybrids (RILs × Teqing), and two testcross populations, including 192 Z413 test F1 hybrids (the RILs × Zhong 413) and 187 IR64 test F1 hybrids (the RILs × IR64), were developed and used in this study (Li et al. 2001). One of the testers, Zhong 413, is a widely compatible restorer line developed in China and the other, IR64, is an indica cultivar developed in IRRI. IR64 is a popular restorer line for cytoplasmic male sterility rice lines and the most widely grown variety in South and Southeast Asia.
Phenotypic evaluation: As described previously (Li et al. 2001), two separate experiments were conducted at two locations, Zhejiang Agricultural University (ZAU) and China National Rice Research Institute (CNRRI) in 1996. In the ZAU experiment, the RILs, parents, F1 plants, and the two BC1F1 populations (LTBCF1s and TQBCF1s), and a check hybrid, Shanyou63 (the most widely grown commercial hybrid cultivar in China), were planted in the seedling nursery on May 25, 1996. The 25-day-old seedlings were transplanted into three-row plots, each consisting of a single row of the female RIL and the two BC1F1 hybrids (the RIL × Lemont and Teqing). The plots were arranged in a randomized complete block design with two replications. Each row within a plot consisted of 15 plants with a spacing of 20 cm between plants within each row and 35 cm between rows. Four check plots consisting of Lemont, Teqing, F1 (Lemont × Teqing), and Shanyou63 were randomly arranged in each replication. In the CNRRI experiment, the same three-row plots, each consisting of one row of a RIL and two rows of testcross F1 hybrids (the RIL × the testers, Z413 and IR64), were used. In addition, six check plots consisting of Lemont, Teqing, F1, Z413, IR64, and Shanyou63 were also included in each replication. The field arrangement in CNRRI was the same as the ZAU experiment except that three replications were used.
At the maturity stage, three representative plants from the middle of each row plot were sampled and dried in an oven. Each sampled plant was evaluated for grain yield and three major yield components, effective panicles per plant (PP), filled grains per panicle (GP), and 1000-grain weight (GW, in grams).
Genotyping and RFLP map construction: Genomic DNA of the RILs, parental lines, and testers was extracted from freshly harvested leaves of 25-day-old seedlings grown in the green-house at Texas A&M University. Restriction fragment length polymorphism (RFLP) mapping was conducted using published procedures (Li et al. 1995) and 179 well-distributed RFLP markers from Cornell University and the Japanese Rice Genome Research Program. The RILs were also evaluated for two morphological markers, C (apiculus color) and gl-1 (glabrous leaf) in the field. An additional marker, the reaction to phenol (Ph), was evaluated for the RILs, parents, and testers. A complete linkage map with 182 markers spanning 1918.7 cM and covering 12 rice chromosomes with an average interval of 11.3 cM between markers, was constructed using MAP-MAKER/EXP version 3.0 (Lincoln et al. 1992), as described previously (Li et al. 1999, 2001).
Data analyses: The original data of the three yield components and the square-root-transformed data for GP of the RI, BCF1, and testcross hybrid populations were used in the data analyses with each population analyzed separately. SAS PROC GLM (SAS Institute 1996) was used to test the differences among the RILs and the BC/testcross hybrids. Equations for calculating values of hybrid breakdown (a component of inbreeding depression) of individual RILs and the midparental heterosis for the three traits of individual BC/testcross hybrids are listed in Table 1. In addition, two other relative heterosis measurements were calculated as follows: the better parental heterosis, HBP = 100 × (F1 − BP)/BP, and the competitive heterosis, HC = 100 × (F1 − Shanyou63)/Shanyou63, where BP and Shanyou63 were the better parent and the check hybrid, respectively.
For mapping main-effect and epistatic QTL, data from each of the mapping populations were analyzed separately. The mean values of individual RILs for the three yield components and the genotypic data at the 182 RFLP loci of the RILs were used as input data to identify QTL showing additive gene action. The mean midparental heterosis, HMP, and the mean values of individual BC and testcross F1 hybrids for the three traits were used to identify QTL contributing to heterosis. The mixed linear model and the computer software QTLMAPPER v. 1.0 were used for interval mapping of main-effect and epistatic QTL in each of the mapping populations, as described previously (Wang et al. 1999; Li et al. 2001). QTL mapping was carried out in three steps using the computer software. First, significant markers were identified across the genome using stepwise regression analyses based on single marker genotypes for putative main-effect QTL and based on all possible pairwise marker pairs for epistatic QTL with a threshold of P ≤ 0.005. Then, all putative main-effect and epistatic QTL were identified using interval mapping in putative QTL regions identified in the first step, with all QTL fixed in the model to control the background genetic variation. Finally, genetic parameters (effects and test statistics) associated with significant main-effect and epistatic QTL were simultaneously estimated at the positions of respective LOD peaks in individual putative QTL regions (each putative QTL region covered two marker intervals) using the model and the restricted maximum likelihood estimation method (Wang et al. 1999). The threshold was 0.005 for main-effect QTL and P ≤ 0.001 for epistatic QTL.
RESULTS
Inbreeding depression and heterosis: Table 2 shows the summary statistics for the yield components of the parents, F1 (Lemont × Teqing), RILs, two BCF1 populations, and two testcross F1 populations, as well as the
Equations for calculating HB of the Lemont/Teqing RILs and the midparental heterosis (HMP) of the two BCF1 and two testcross F1 populations
| Populationa | N | Equationsb |
|---|---|---|
| RILs | 254 | HB = RIL − MP, where MP = (Lemont + Teqing)/2 |
| LTBCF1 | 172 | HMP = F1 − MP, where MP = (RIL + Lemont)/2 |
| TQBCF1 | 177 | Hmp = F1 − MP, where MP = (RIL + Teqing)/2 |
| Z413BCF1 | 192 | HMP = F1 − MP, where MP = (RIL + Z413)/2 |
| IR64BCF1 | 187 | HMP = F1 − MP, where MP = (RIL + IR64)/2 |
LTBCF1s and TQBCF1s are two BCF1 populations obtained by crossing the RILs with the parents, Lemont (LT) and Teqing (TQ), while Z413F1s and IR64F1s are two testcross F1 populations obtained by crossing the RILs with the testers Zhong 413 (Z413) and IR64.
F1 are mean trait values of individual BC or testcross hybrids while RIL is the corresponding female RIL parent for each of the BC or testcross hybrids.
estimated hybrid breakdown (HB) and the HMP of the BCF1 and testcross F1 hybrids. The male parent, Teqing (indica), had significantly greater trait values for PP, GP, and GW than Lemont (japonica) in both experiments. The PP, GP, and GW values of the F1 plants were 9.7, 157.6, and 24.9 g in the ZAU experiment, and 11.8, 201.9, and 24.8 g in the CNRRI experiment. The midparental heterosis of the F1 plants for PP, GP, and GW was 2.6 (36.7%), 73.2 (86.6%), and 0.7 (2.8%) in ZAU, and 1.0 (9.3%), 89 (78.8%), and 1.4 (6.0%) in CNRRI, respectively.
Hybrid breakdown of the RILs: In both ZAU and CNRRI experiments, significant reductions of the RILs for PP and GP were observed as a result of hybrid breakdown, but not for GW (Table 2). In ZAU, the mean deviation of the RILs from the midparental values was −0.9 (−12.6%) ranging from −6.8 (−95.1%) to 11.8 (165.0%) for PP, −13.5 (−16.0%) ranging from −63.1 (−74.7%) to 85.1 (100.8%) for GP, and −0.1 (0.5%) ranging from −12.5 (51.5%) to 6.8 (28.0%) for GW, respectively (Table 2 and Figure 1). The number of RILs having significantly higher values than the better parent, Teqing, was two for PP, two for GP, and nine for GW, respectively. In the CNRRI experiment, the mean hybrid breakdown of the RI population was −0.8 (−7.4%) for PP, −27.2 (−24.1%) for GP, and −1.8 (−7.7%) for GW, respectively. Six RILs had significantly higher mean values than Teqing for PP and GW, but none for GP.
Heterosis in the BC and testcross F1 populations: Significant levels of heterosis for PP, GP, and GW were observed in the BCF1 and testcross hybrid populations and heterosis values of individual BC/testcross F1 hybrids varied considerably (Table 2 and Figure 1). In the CNRRI experiment, the IR64F1 population showed a much greater level of heterosis than the Z413F1 population for all three traits. In the ZAU experiment, the two BCF1 populations showed the same levels of heterosis for PP and GP, but LTBCF1s exhibited greater mean heterosis for GW than TQBCF1s. Within each of the populations, individual F1 hybrids varied considerably in their mean values and heterosis measurements (Figure 1). For PP and GP, most F1 hybrids showed highly significant positive heterosis. Many hybrids showed significant negative heterosis for the three yield components, particularly for GW.
In the ZAU experiment, the mean values of the LTBCF1 and TQBCF1 populations were 8.7 and 9.6 for PP, 107.8 and 129.2 for GP, and 26.0 and 25.4 g for GW, respectively. The heterosis values were 2.6 (42.0%) and 2.3 (31.5%) for PP, 42.5 (65.1%) and 39.2 (43.5%) for GP, and 2.7 (11.2%) and 0.4 g (1.6%) for GW in the LTBCF1 and TQBCF1 populations, respectively. The top 20 high-yielding hybrids in the LTBCF1 population had a mean heterosis of 5.3 (86.2%) for PP, 128.9 (197.4%) for GP, and 2.9 (12.0%) for GW, respectively. The top 20 high-yielding hybrids in the TQBCF1 population had a mean heterosis of 6.6 (90.4%) for PP, 123.7 (137.4%) for GP, and 5.8 (23.1%) for GW, respectively.
In the CNRRI experiment, the mean values of the Z413F1 and IR64F1 populations were 13.8 and 15.9 for PP, 142.5 and 134.0 for GP, and 24.5 and 24.8 g for GW, respectively. Their mean HMP values were 2.7 (24.3%) and 4.1 (34.7%) for PP, 10.1 (7.6%) and 46.9 (58.4%) for GP, and 0.9 g (3.8%) and 2.1 g (8.8%) for GW. The top 20% high-yielding hybrids in the Z413F1 population had a mean heterosis of 7.2 (64.9%) for PP, 50.6 (38.2%) for GP, and 3.9 (16.5%) for GW, respectively. The top 20 high-yielding hybrids in the IR64F1 population had a mean heterosis of 9.9 (83.9%) for PP, 99.2 (117.1%) for GP, and 5.7 (25.1%) for GW, respectively. The competitive heterosis, HC, of the top 20 high-yielding hybrids of the Z413F1 and IR64CF1 populations was −0.3 (−1.6%) and 3.1 (16.7%) for PP, 56.8 (45.0%) and 57.7 (45.7%) for GP, and 1.4 (5.4%) and 3.3 (12.5%) for GW, respectively.
The relationships between the mean trait values of RILs, heterosis, and F1 performance: Table 3 shows the correlation coefficients between the mean values of individual F1 hybrids, their heterosis, and the mean values
Summary statistics on inbreeding depression of the Lemont/Teqing RILs and the midparental heterosis (HMP) of two backcross F1 (RILs × parents) and two testcross F1 populations (RILs × two testers, Z413 and IR64)
| Panicles per plant (PP) | Grains per panicle (GP) | 1000-grain weight (GW, g) | |||||||
|---|---|---|---|---|---|---|---|---|---|
| Mean | SD | Range | Mean | SD | Range | Mean | SD | Range | |
| Zhejiang Agricultural University | |||||||||
| Lemont (LT) | 6.0 | 1.1 | 59.7 | 3.2 | 22.5 | 1.3 | |||
| Teqing (TQ) | 8.3 | 1.2 | 109.2 | 3.6 | 26.0 | 1.7 | |||
| F1 (LT × TQ) | 9.7 | 1.5 | 157.6 | 4.0 | 24.9 | 2.0 | |||
| HMP | 2.6 | 73.2 | 0.7 | ||||||
| CK (SY63) | 12.5 | 2.7 | 83.1 | 2.6 | 31.0 | 1.6 | |||
| LTBCF1 | 8.7 | 2.0 | 4.0 ~ 15.5 | 107.8 | 49.6 | 34.4 ~ 276.4 | 26.0 | 3.0 | 20.1 ~ 34.2 |
| (LTBC) HMP | 2.6 | 2.5 | −5.3 ~ 9.8 | 42.5 | 50.4 | −44.2 ~ 191.5 | 2.7 | 3.1 | −8.6 ~ 9.2 |
| TQBCF1 | 9.6 | 2.1 | 5.3 ~ 14.5 | 129.2 | 38.0 | 48.9 ~ 283.7 | 25.4 | 2.9 | 17.9 ~ 34.6 |
| (TQBC) HMP | 2.3 | 2.4 | −5.7 ~ 8.2 | 39.2 | 40.5 | −42.5 ~ 199.0 | 0.4 | 2.9 | −6.9 ~ 8.4 |
| RILs | 6.3 | 2.5 | 2.3 ~ 20.0 | 70.9 | 29.8 | 21.4 ~ 169.5 | 24.2 | 4.0 | 15.0 ~ 34.4 |
| HBa | −0.9 | 2.5 | −6.8 ~ 11.8 | −13.5 | 29.8 | −63.1 ~ 85.1 | −0.1 | 4.0 | −12.5 ~ 6.8 |
| China National Rice Research Institute | |||||||||
| Lemont (LT) | 9.1 | 2.0 | 59.5 | 6.7 | 21.3 | 1.6 | |||
| Teqing (TQ) | 12.5 | 1.9 | 166.4 | 20.2 | 25.5 | 1.6 | |||
| F1 (LT × TQ) | 11.8 | 2.6 | 201.9 | 15.2 | 24.8 | 0.7 | |||
| HMP | 1.0 | 89.0 | 1.4 | ||||||
| CK (SY63) | 18.6 | 1.9 | 126.2 | 21.5 | 26.1 | 1.2 | |||
| Z413 | 12.2 | 1.2 | 179.0 | 16.4 | 25.6 | 1.5 | |||
| IR64 | 13.6 | 1.8 | 83.5 | 14.9 | 23.7 | 0.5 | |||
| Z413F1 | 13.8 | 2.6 | 7.3 ~ 25.0 | 142.5 | 37.4 | 52.1 ~ 233.1 | 24.5 | 2.4 | 9.9 ~ 31.3 |
| (Z413F1) HMP | 2.7 | 2.7 | −3.5 ~ 11.3 | 10.1 | 38.9 | −104.6 ~ 106.8 | 0.9 | 2.2 | −12.3 ~ 7.7 |
| IR64F1 | 15.9 | 2.9 | 9.2 ~ 27.5 | 134.0 | 27.9 | 64.4 ~ 234.2 | 24.8 | 2.2 | 13.0 ~ 30.9 |
| (IR64F1) HMP | 4.1 | 3.0 | −3.3 ~ 16.0 | 49.4 | 29.5 | −21.4 ~ 155.4 | 2.1 | 2.2 | −9.8 ~ 8.3 |
| RILs | 10.0 | 2.5 | 5.3 ~ 16.7 | 85.8 | 27.5 | 18.9 ~ 181.0 | 21.6 | 2.7 | 14.7 ~ 31.1 |
| HB | −0.8 | 2.5 | −5.5 − 5.9 | −27.2 | 27.5 | −84.6 − 77.6 | −1.8 | 2.68 | −10.7 ~ 7.7 |
HB = RIL − MP, where HB is hybrid breakdown and MP = (Lemont + Teqing)/2.
of their maternal RILs for the yield components. The mean values of the RILs and heterosis of the BC/testcross F1 hybrids for all three traits were distributed in opposite directions around the midparental value (at the zero point) with varied degrees of overlapping in different populations (Figure 1). There was no correlation between the mean trait values of the RILs and their F1 performance of BC or testcross hybrids for PP and GP. However, the mean F1 values of GW in LTBCF1, TQBCF1, Z413F1, and IR64F1 populations was positively associated with the mean trait values of the RILs with determination coefficients of 0.27, 0.31, 0.42, and 0.34, respectively (P < 0.0001).
The mean trait values of individual BC and testcross hybrids for PP, GP, and GW were largely determined by the levels of heterosis. The correlation between the F1 mean values and HMP in the LTBCF1, TQBCF1, Z413F1, and IR64F1 populations was 0.851, 0.838, 0.890, and 0.915 for PP; 0.951, 0.930, 0.937, and 0.862 for GP; and 0.803, 0.758, 0.838, and 0.812 for GW, respectively. The mean trait values of individual RILs were negatively correlated (P < 0.0001) with their heterosis values in all BC and testcross populations (Table 3). This negative association between the mean trait values of the RILs and the heterosis of their BC/testcross hybrids was stronger for PP (r =−0.586, −0.489, −0.290, and −0.247) than for GP (−0.363, −0.292, −0.265, and −0.367) and GW (−0.359, −0.383, −0.143, and −0.272) in the LTBCF1, TQBCF1, Z413F1, and IR64F1 populations.
The contributions of PP, GP, and GW to grain yield: All three yield components contributed significantly to the grain yield per plant in all five populations. Regression analyses indicated that the contributions (partial R2) to the total variances of the grain yield in the LTBCF1, TQBCF1, Z413F1, and IR64F1 populations were 21.2, 34.4, 24.0, and 37.4% for PP; 71.1, 54.4, 66.1, and 49.4% for GP; and 7.7, 11.2, 9.9, and 13.2% for GW, respectively. For the RILs, the partial R2 was 31.6%, 60.5%, and 7.9% for PP, GP, and GW in the ZAU experiment, and 34.1, 55.6, and 10.3% in the CNRRI experiment.
Correlation between the traits was weak and inconsistent across the populations and experiments. For the RILs, a weak positive correlation (r = 0.21, P = 0.005) was observed between PP and GW in the CNRRI experiment,
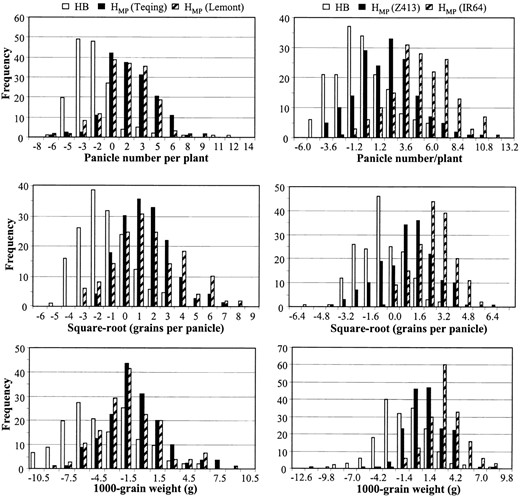
Frequency distribution of hybrid breakdown (HB = RILs − MP) of the Lemont/Teqing RILs and the midparental heterosis (HMP) for three yield components in the two backcross and two testcross F1 populations.
but a weak negative correlation (r =−0.31, P = 0.0002) was present between PP and GP in the ZAU experiment. Negative correlation between PP and GP was observed in the two BCF1 populations, but was much stronger in the LTBCF1s (r =−0.59, P < 0.0001) than in the LTBCF1s (r =−0.22, P = 0.01). In the Z413F1 population, a weak positive correlation (r = 0.21, P = 0.01) was present between PP and GW, but PP was negatively correlated with GP (r =−0.20, P = 0.008) in the IR64F1 population.
Main-effect QTL associated with the mean trait values of the RILs and heterosis of the BC/testcross F1 hybrids: Table 4 shows 30 main-effect QTL affecting the three yield components identified in the RILs and the BC/testcross F1 populations. On average, these main-effect QTL explained a small portion of the total phenotypic variance in each of the populations (11.3%, ranging from 0 to 32.8% for PP, 20.4%, ranging from 11.0 to 26.1% for GP, and 9.0%, ranging from 0 to 15.2% for GW, respectively).
PP: Three main-effect QTL were detected in the RILs (one in ZAU and two in CNRRI) and mapped to chromosomes 3 and 4. The Teqing allele at all three QTL increased the panicle number. The QTL on chromosome 4 was detected with a large LOD score of 10.3 and explained 18.7% of the total variation. In addition, five main-effect QTL were identified in the BC and testcross populations, which were mapped to chromosomes 1, 3,
Phenotypic correlation (r) and determination coefficients (R2) for grain yield components between HB of the Lemont/Teqing RILs and the midparental heterosis (HMP) in the two BCF1 and two testcross F1 populations
| Between HB and F1 mean | Between HMP and F1 mean | Between HB and HMP | |||||||||||
|---|---|---|---|---|---|---|---|---|---|---|---|---|---|
| LTBCF1 | TQBCF1 | Z413F1 | IR64F1 | LTBCF1 | TQBCF1 | Z413F1 | IR64F1 | LTBCF1 | TQBCF1 | Z413F1 | IR64F1 | ||
| pp | r | −0.073 | 0.066 | 0.178 | 0.164 | 0.851 | 0.838 | 0.890 | 0.915 | −0.586 | −0.489 | −0.290 | −0.247 |
| R2 | 0.005 | 0.004 | 0.032 | 0.027 | 0.724 | 0.703 | 0.792 | 0.838 | 0.344 | 0.239 | 0.084 | 0.061 | |
| GP | r | −0.058 | 0.079 | 0.089 | 0.153 | 0.951 | 0.930 | 0.937 | 0.862 | −0.363 | −0.292 | −0.265 | −0.367 |
| R2 | 0.003 | 0.006 | 0.008 | 0.024 | 0.905 | 0.866 | 0.878 | 0.743 | 0.132 | 0.085 | 0.070 | 0.134 | |
| GW | r | 0.268 | 0.311 | 0.421 | 0.340 | 0.803 | 0.758 | 0.838 | 0.812 | −0.359 | −0.383 | −0.143 | −0.272 |
| R2 | 0.072 | 0.097 | 0.177 | 0.116 | 0.645 | 0.575 | 0.702 | 0.659 | 0.129 | 0.147 | 0.020 | 0.074 | |
4, 6, and 7, respectively. Two of the five QTL (chromosomes 4 and 7) were additive, while the other three (chromosomes 1, 3, and 6) appeared to be overdominant as their effects estimated from heterosis values were equal to or greater than those estimated from F1 mean values. These three QTL had dominance effects for increased panicle number.
GP: Four main-effect QTL affecting GP (one in ZAU and three in CNRRI) were identified in the RILs and mapped to chromosomes 1, 3, 6, and 9. The Teqing allele at all QTL increased GP. Eleven main-effect QTL affecting F1 mean values and/or heterosis were detected in the BC or testcross F1 populations. Of these, two (between C225c and G2132a on chromosome 8 and between RG1094f and C16 on chromosome 10) were additive as they were detectable only by the F1 mean values. One QTL (between G103b and RZ698 on chromosome 9) detected in the LTBCF1s appeared to be dominant. The remaining 8 QTL appeared to be overdominant since the QTL effects estimated from heterosis values were equal to or greater than their effects estimated from F1 mean values. These QTL were mapped to chromosomes 3, 4, 6, 8, 9, and 12.
GW: Three main-effect QTL affecting GW were identified in the RILs (one in ZAU and two in CNRRI) and mapped to chromosomes 1, 5, and 10. The Teqing allele at all three QTL increased GW. Five additional main-effect QTL were identified in the two BC and one test-cross (Z413F1) populations. The only additive QTL was detected on chromosome 1 in the TQBCF1, with the Teqing allele associated with increased GW. The other four QTL appeared to be overdominant. The dominance effects at three QTL on the chromosomes 1, 4, and 10 caused increased GW while another QTL on chromosome 10 resulted in reduced GW.
Epistatic loci associated with hybrid breakdown in the RILs and heterosis in F1 populations: Table 5 shows 35 digenic epistatic QTL pairs associated with hybrid breakdown of the RILs, which explained the majority of the total phenotypic variances for the yield components (36.0 and 51.0% for PP, 57.6 and 49.2% for GP, and 49.6 and 45.5% for GW) in the CNRRI and ZAU experiments, respectively. In addition, 73 pairs of epistatic QTL affecting the mean performance and heterosis in the BC/testcross F1 populations were identified. On average, these epistatic QTL explained significant portions of the total phenotypic variances for the traits (48.8% for PP, 37.4% for GP, and 43.1% for GW) in the BC/testcross F1 populations (Tables 6, 7 and 8).
Epistatic QTL affecting hybrid breakdown of the RILs: Eleven pairs of epistatic QTL associated with PP of the RILs were identified. Six detected in ZAU and 5 in CNRRI explained 36.0 and 51.0% of the total phenotypic variation for PP in the two locations. Four of the epistatic QTL effects were positive and the remaining seven were negative. Three of the epistatic QTL (on chromosomes 7, 11, and 12) had significant main effects
Main-effect QTL associated with panicles/plant (PP), grains/panicle (GP), and 1000-grain weight (GW) in the Lemont/Teqing RILs, and heterosis (HMP) in their BCF1 and testcross F1 populations in the ZAU and CNRRI experiments
| RILs | F1 | HMP | |||||||||||
|---|---|---|---|---|---|---|---|---|---|---|---|---|---|
| Population | Location | Traits | Chromosome | Marker interval | LOD | Effect | R2 | LOD | Effect | R2 | LOD | Effect | R2 |
| RILs | ZAU | PP | 3 | RG482–CDO795a | 4.42 | −0.75 | 7.9 | ||||||
| RILs | CNRRI | PP | 3 | C515–RG348a | 6.67 | −0.70 | 8.9 | ||||||
| RILs | CNRRI | PP | 4 | Ph–G379 | 10.26 | −0.97 | 18.7 | ||||||
| TQBCF1 | ZAU | PP | 1 | CDOl 18–CDO455 | 4.24 | 0.82 | 12.5 | 4.43 | 0.85 | 14.9 | |||
| TQBCF1 | ZAU | PP | 7 | RG678–G20 | 2.91 | 0.48 | 5.5 | ||||||
| TQBCF1 | ZAU | PP | 6 | RG653–RZ508 | 4.13 | 0.76 | 8.3 | 4.11 | 0.88 | 14.8 | |||
| Z413F1 | CNRRI | PP | 3 | RG341b–C74a | 2.88 | 0.70 | 9.5 | ||||||
| Z413F1 | CNRRI | PP | 4 | Ph–G379 | 3.59 | 0.73 | 12.2 | ||||||
| RILs | ZAU | GP | 1 | RZ14–C944b | 4.16 | −0.56 | 12.3 | ||||||
| RILs | CNRRI | GP | 3 | G249–RG418 | 6.85 | −0.63 | 13.8 | ||||||
| RILs | CNRRI | GP | 6 | RG653–RZ508 | 5.67 | −0.58 | 14.0 | ||||||
| RILs | CNRRI | GP | 9 | G103b–RZ698 | 4.22 | −0.42 | 7.9 | ||||||
| LTBCF1 | ZAU | GP | 9 | G103b–RZ698 | 4.64 | −1.15 | 16.7 | 3.01 | 0.49 | 5.3 | |||
| TQBCF1 | ZAU | GP | 6 | C235a–G294d | 3.41 | 0.58 | 14.8 | 4.55 | 0.66 | 15.3 | |||
| TQBCF1 | ZAU | GP | 9 | RG451–RZ404 | 2.91 | 0.43 | 6.1 | ||||||
| TQBCF1 | ZAU | GP | 10 | RG1094f–C16 | 3.17 | 0.62 | 10.6 | ||||||
| Z413F1 | CNRRI | GP | 3 | G249–RG418 | 3.28 | 0.50 | 9.6 | ||||||
| Z413F1 | CNRRI | GP | 4 | Ph–G379 | 5.93 | 0.53 | 14.1 | 5.02 | 0.54 | 11.2 | |||
| IR64F1 | CNRRI | GP | 3 | C515–RG348a | 3.67 | 0.27 | 5.2 | 5.11 | 0.46 | 9.0 | |||
| IR64F1 | CNRRI | GP | 6 | G1314b–HHU37 | 2.61 | 0.36 | 5.1 | ||||||
| IR64F1 | CNRRI | GP | 8 | C225c–G2132a | 2.53 | −0.29 | 6.1 | ||||||
| IR64F1 | CNRRI | GP | 9 | CDO395–CDO1081 | 3.98 | −0.37 | 7.3 | 1.75 | −0.29 | 5.2 | |||
| IR64F1 | CNRRI | GP | 12 | RG901–G402 | 2.77 | −0.32 | 7.5 | 3.52 | −0.33 | 6.8 | |||
| RI | ZAU | GW | 10 | G1084–RZ400 | 2.89 | −1.10 | 10.5 | ||||||
| RI | CNRRI | GW | 1 | CDOl 18–CDO455 | 3.18 | −0.62 | 6.6 | ||||||
| RI | CNRRI | GW | 5 | R569a–RG13 | 4.32 | −0.87 | 11.1 | ||||||
| LTBCF1 | ZAU | GW | 11 | RZ781–C975 | 1.84 | 0.80 | 6.1 | 3.75 | 1.00 | 8.3 | |||
| LTBCF1 | ZAU | GW | 10 | G89–G1084 | 3.16 | 1.21 | 12.1 | ||||||
| TQBCF1 | ZAU | GW | 10 | RG561–C223 | 2.49 | −0.71 | 8.4 | 4.24 | −1.12 | 15.7 | |||
| TQBCF1 | ZAU | GW | 1 | RG236–RZ801 | 3.55 | 0.75 | 6.2 | ||||||
| Z413F1 | CNRRI | GW | 4 | RZ590–RG214 | 2.01 | 0.47 | 5.0 | ||||||
In the RI population, QTL effects were associated with the Lemont allele (the effect due to substitution of the Teqing allele by the Lemont allele). In the BC populations, QTL effects for F1 and HMP were estimated by the difference between the heterozygote and the homozygote. In the testcross populations, QTL effects for F1 and heterosis were estimated by the difference between the heterozygote (tester/Lemont) and the heterozygote (tester/Teqing). The genetic expectation of the QTL effect is the additive gene effect (a) when estimated from the RILs, the additive and dominance effects (a + d) from the F1 mean values, and the dominance effect (d) from HMP values in the BC populations.
Digenic epistatic QTL affecting hybrid breakdown of grain yield components–panicles/plant (PP), grains/panicle (GP), and 1000-grain weight (GW) of the Teqing/Lemont recombinant inbred population in two environments
| QTLi Marker interval | QTLj Marker interval | QTL effect | ||||||||
|---|---|---|---|---|---|---|---|---|---|---|
| Location | Trait | Chromosome | Chromosome | LOD | ai | aj | aaij | R2 (%) | ||
| ZAU | PP | 1 | RZ382–RG532 | 2 | RZ273–RG139 | 3.56 | −0.80*** | 7.6 | ||
| ZAU | PP | 2 | RZ446a–RG654 | 4 | G271–C949 | 3.74 | −0.68*** | 5.6 | ||
| ZAU | PP | 5 | R569a–RG13 | 10 | RG752–RG1094f | 5.59 | 1.10*** | 13.3 | ||
| ZAU | PP | 7 | RG29–G370b | 10 | RG1094f–C16 | 6.07 | −0.90*** | 9.2 | ||
| ZAU | PP | 7 | RG30–RG29 | 11 | G44–RG1094b | 5.53 | 0.83*** | −0.60** | −0.81*** | 7.7 |
| ZAU | PP | 2 | RZ386a–D07l 8 | 11 | RG1094b–RZ53 | 4.05 | −0.81*** | 7.6 | ||
| CNRRI | PP | 1 | CDO348–CDO226a | 6 | G200a–RZ667 | 7.07 | −0.69*** | 6.5 | ||
| CNRRI | PP | 1 | RG472–RG447 | 11 | RZ53–RZ781 | 3.70 | −0.52*** | 5.2 | ||
| CNRRI | PP | 4 | RZ590b–RG214 | 8 | C1073a–G187 | 4.57 | 0.52*** | 5.2 | ||
| CNRRI | PP | 4 | RG1094e–Y1065Lc | 6 | RZ682–C236 | 4.64 | 072*** | 7.2 | ||
| CNRRI | PP | 11 | RZ537b–RG16 | 12 | RG901–G402 | 8.34 | −0.36* | 0.94*** | 11.9 | |
| ZAU | GP | 2 | RZ260–RZ273 | 2 | RZ386a–CDO7l8 | 3.93 | −0.29* | 0.43*** | 6.3 | |
| ZAU | GP | 2 | G1327–RG634 | 11 | C975–RG1022 | 2.97 | 0.50*** | 8.6 | ||
| ZAU | GP | 4 | Ph–G379 | 6 | RG653–RZ508 | 2.98 | −0.58*** | 11.7 | ||
| ZAU | GP | 4 | C949–RG449 | 7 | CDO385–C285 | 4.14 | −0.29* | q45*** | 7.9 | |
| ZAU | GP | 7 | RG678–G20 | 7 | RG29–G370b | 4.95 | −0.80*** | 14.7 | ||
| CNRRI | GP | 2 | RG256–RZ260 | 12 | RZ257–RZ797a | 6.74 | 0.55*** | 10.1 | ||
| CNRRI | GP | 2 | RZ273–RG139 | 3 | RZ284–RZ403b | 6.02 | 0.46*** | 8.4 | ||
| CNRRI | GP | 3 | RG348a–C636x | 3 | CDO337–C944a | 5.45 | Q42*** | 7.8 | ||
| CNRRI | GP | 4 | G379–RZ740 | 7 | BCD855–CDO385 | 3.31 | −0.37*** | 6.9 | ||
| CNRRI | GP | 4 | G271–C949 | 11 | RZ797b–RG1094d | 6.20 | 0.49*** | 9.1 | ||
| CNRRI | GP | 6 | G1314b–HHU37 | 8 | C424b–RZ143 | 4.22 | −0.23* | 0.36*** | 6.7 | |
| CNRRI | GP | 7 | C586–CDO405 | 9 | R662b–G103a | 3.59 | 0.47*** | 8.6 | ||
| ZAU | GW | 1 | RG811–R210 | 6 | G1314b–HHU37 | 2.65 | −1.08*** | 6.0 | ||
| ZAU | GW | 1 | C131–RG472 | 4 | RG1094e–Y1065Lc | 3.09 | −1.18*** | 7.1 | ||
| ZAU | GW | 2 | RZ599–RZ476b | 9 | CDO82–CDO226b | 4.02 | 1.28*** | 8.3 | ||
| ZAU | GW | 3 | RZ403b–RG482 | 3 | RZ474–C746 | 3.40 | −1.27*** | 8.2 | ||
| ZAU | GW | 3 | CDO795a–RZ474 | 6 | C–G200a | 3.45 | 1.08*** | 6.0 | ||
| ZAU | GW | 6 | C235a–G294d | 8 | RZ143–C825 | 5.30 | 1.39*** | 9.9 | ||
| CNRRI | GW | 1 | RZ14–C944b | 9 | CDO82–CDO226b | 3.89 | 0.42* | 0.75*** | 8.3 | |
| CNRRI | GW | 2 | RZ446b–RZ446a | 3 | G249–RG418 | 3.59 | −0.49** | 5.3 | ||
| CNRRI | GW | 3 | G249–RG418 | 11 | RZ536a–L457b | 5.20 | 0.84*** | 9.3 | ||
| CNRRI | GW | 4 | RG143–G177 | 12 | RG20q–RG91q | 3.84 | −0.60*** | 6.6 | ||
| CNRRI | GW | 6 | RZ667–C235a | 10 | G89–G1084 | 4.18 | −0.37* | 0.85*** | 9.5 | |
| CNRRI | GW | 6 | RG653–RZ508 | 12 | G1106–RG901 | 3.83 | −0.96*** | 10.6 | ||
ai and aj are the main effects of the loci i and j, arising from the substitution of the Lemont allele by the Teqing allele, and aaij is the epistatic effect between loci i and j, as defined by Mather and Jinks (1982). R2 is the proportion of the total phenotypic variation explained by the aaij. *Significance levels of P < 0.05. ** Significance levels of P < 0.001. *** Significance levels of P < 0.0001.
on PP. The Teqing allele at two of the QTL resulted in increased PP while the Lemont allele caused increased PP (Table 5).
For GP, 12 pairs (5 in ZAU and 7 in CNRRI) of epistatic QTL were identified, which explained, respectively, 57.6 and 49.2% of the total phenotypic variation in the RILs in the two locations. Nine of the epistatic QTL effects were positive and the remaining three were negative. Three of the epistatic QTL (on chromosomes 2, 6, and 7) had significant main effects on GP, at which the Teqing allele was associated with increased GP. For GW, 12 pairs (6 in each of the locations) of epistatic QTL were identified, which explained 49.6 and 45.5% of the total phenotypic variation of the RILs in ZAU and CNRRI, respectively. Six of the epistatic QTL effects were positive and the remaining six were negative. Two of the epistatic QTL (on chromosomes 1 and 6) had significant main effects on GW. The allele at one of the QTL for increased GW was from Teqing while the other was from Lemont.
Epistatic QTL associated with heterosis for the yield components in the BC and testcross populations: Table 6 shows 25 epistatic QTL pairs affecting PP identified from the F1 mean and/or heterosis of the BC/testcross populations, including 8 in the LTBCF1s, 5 in the TQBCF1s, 5 in the Z413F1s, and 7 in the IR64F1s, respectively. The proportions of the total phenotypic variances of the F1 mean and heterosis values explained by the epistatic QTL pairs were 64.2 and 84.1% in the LTBCF1s, 40.8 and 46.3% in the TQBCF1s, 38.4 and 29.7% in the Z413F1s, and 44.7 and 42.1% in the IR64F1s, respectively. Twenty of the epistatic QTL pairs appeared to be overdominant, while the remaining 5 were additive as they were detected only from the F1 mean values. Twelve of the 25 epistatic effects were positive and the remaining 13 were negative. Significant main effects were detected at nine of the epistatic loci (chromosomes 1, 2, 6, 9, and 12), five of which were additive, and the remaining four appeared overdominant (all four associated with increased PP).
Table 7 shows 19 epistatic QTL pairs affecting GP identified from the F1 mean and/or heterosis of the BC/testcross populations, including 6 in the LTBCF1s, 5 in the TQBCF1s, 5 in the Z413F1s, and 3 in the IR64F1s, respectively. The proportions of the total phenotypic variances of the F1 mean and heterosis values explained by the epistatic QTL pairs were 54.1 and 64.0% in the LTBCF1s, 40.2 and 30.3% in the TQBCF1s, 35.6 and 37.9% in the Z413F1s, and 18.8 and 18.2% in the IR64F1s, respectively. Seventeen of the epistatic QTL pairs appeared to be overdominant, while the remaining 2 were additive. Ten of the 19 epistatic effects were positive and the remaining 9 were negative. Eight of the epistatic loci (chromosomes 3, 4, 5, 8, 9, and 11) showed significant overdominance effects, five of which increased GP and the other three of which reduced GP.
Table 8 shows 29 epistatic QTL pairs affecting GW detected from the F1 mean or heterosis of the BC/testcross populations, including 9 in the LTBCF1s, 6 in the TQBCF1s, 7 in the Z413F1s, and 7 in the IR64F1s, respectively. The proportions of the total phenotypic variances of the F1 mean and heterosis values explained by the epistatic QTL pairs were 51.1 and 40.2% in the LTBCF1s, 41.9 and 58.7% in the TQBCF1s, 48.9 and 28.0% in the Z413F1s, and 42.5 and 33.6% in the IR64F1s, respectively. Eleven of the epistatic QTL pairs were additive and the remaining 18 appeared to be overdominant. For the additive epistatic QTL, 7 of the epistatic effects were positive and the other 4 were negative. For the overdominant ones, 10 epistatic effects were positive and the remaining 8 were negative. Five of the epistatic loci (chromosomes 1, 6, and 7) showed significant main effects.
DISCUSSION AND CONCLUSIONS
The observed hybrid breakdown of the RILs and heterosis of the BC/testcross F1 populations were highly significant for PP and GP but not for GW, although the IR64F1 population showed significant heterosis for GW. The overall magnitudes of hybrid breakdown and heterosis for the yield components were much less pronounced than grain yield itself (Li et al. 2001). The observed levels of hybrid breakdown or heterosis were GY > GP > PP ≫ GW and so were their contributions to grain yield and the amounts of variation. The opposite was true for their heritability, h2 estimates (GY < GP < PP ≪ GW; data not shown). This tendency toward more complex fitness or yield traits showing much greater levels of heterosis and inbreeding depression has been universally observed in both plants and animals. In evolution, seed abundance plays a much greater role for plant survival in nature than seed size. For grain crops such as rice, seed size is expected to contribute little to plant survival since the common grain sizes of most cultivars contain an excess of endosperm as a result of long-term artificial selection.
Genetic basis of inbreeding depression and heterosis for the three yield components: In our previous article, we reached two conclusions regarding the genetic basis of inbreeding depression and heterosis for grain yield and biomass for the same five mapping populations (Li et al. 2001). The first conclusion that the prevalent epistasis for the loci involved appeared to hold true for the three yield components. Our results indicated that the epistatic QTL explained a much greater portion of the total variation than the main-effect QTL for the yield components. Relatively speaking, however, the main-effect QTL accounted for a slightly greater portion of the total variation for the yield components than for grain yield. This was consistent with our previous results from the F4 progeny of the Lemont/Teqing cross, which indicated that more complex traits tend to be determined by a greater number of and more complex epistasis
Digenic epistatic QTL affecting F1 hybrid performance and heterosis (HMP) of panicles/plant (PP) detected in the Lemont (LT)/Teqing (TQ) BCF1 (RILs × LT and TQ) and two testcross F1 (RILs × Z413 and IR64) populations
| QTLi Marker interval | QTLj Marker interval | F1 | HMP | |||||||||||
|---|---|---|---|---|---|---|---|---|---|---|---|---|---|---|
| Pop. | Chromosome | Chromosome | LOD | aI | aj | aaij | R2 (%) | LOD | ai | aj | aaij | R2 (%) | ||
| LT | 1 | RZ14–C944b | 3 | C746–CDO337 | 4.09 | −0.64 | 11.1 | |||||||
| LT | 1 | RG140–RZ288 | 9 | G103b–RZ698 | 4.33 | 0.51** | 0.38* | −0.51** | 7.8 | 5.68 | −1.00*** | 17.3 | ||
| LT | 2 | RG256–RZ260a | 2 | G45–RZ386a | 2.78 | 0.53** | 8.1 | 5.78 | 0.83*** | 12.1 | ||||
| LT | 2 | RZ260a–RZ273 | 9 | RZ698–G95 | 3.73 | 0.34* | 0.58*** | 9.1 | 5.71 | 0.91*** | 14.5 | |||
| LT | 5 | RG556–gl1 | 10 | C16–RG561 | 3.25 | −0.62** | 10.2 | 2.31 | −0.66*** | 7.6 | ||||
| LT | 6 | RZ762–C76 | 6 | G294a–G1468b | 5.73 | 0.34* | 0.86*** | 12.7 | ||||||
| LT | 8 | G56a–R662a | 10 | RZ400–RG241a | 2.82 | −0.52** | 8.0 | 5.34 | −0.88*** | 13.5 | ||||
| LT | 9 | G103b–RZ698 | 11 | RZ900–G44 | 6.06 | 0.44** | 0.64*** | 10.9 | 3.06 | 0.44** | 0.42* | 6.4 | ||
| TQ | 3 | RG341b–C74a | 6 | RG653–RZ508 | 4.11 | −0.88*** | 14.9 | 4.58 | −0.95*** | 13.1 | ||||
| TQ | 3 | CDO795a–RZ474 | 6 | RZ762–C76 | 2.52 | −0.60*** | 6.8 | |||||||
| TQ | 4 | RG449–RZ69 | 6 | G1314b–HHU37 | 4.46 | 0.85*** | 13.9 | 3.67 | 0.87*** | 10.8 | ||||
| TQ | 4 | RZ69–RG190 | 6 | C–G200a | 2.57 | −0.46** | 5.2 | 5.68 | −0.81*** | 9.4 | ||||
| TQ | 9 | RG570a–RG451 | 12 | RG869–L102 | 3.71 | 0.95*** | 13.1 | |||||||
| Z413 | 1 | RZ288–C131 | 12 | RZ397–RZ257 | 4.57 | 0.81*** | 8.6 | 3.84 | 0.40* | 0.77*** | 9.4 | |||
| Z413 | 2 | RG256–RZ260a | 4 | G379–RZ740 | 2.54 | 0.62** | 5.0 | 3.85 | 0.80*** | 10.3 | ||||
| Z413 | 4 | HHU39–RG143 | 8 | C1073a–G187 | 3.98 | −0.75*** | 7.4 | 3.4 | −0.79*** | 10.0 | ||||
| Z413 | 6 | C236–RG653 | 12 | RG91q–RG341a | 3.69 | 1.07*** | −0.66** | −0.87*** | 9.8 | |||||
| Z413 | 8 | C1073a–G187 | 9 | RZ777–CDO82 | 2.72 | −0.76*** | 7.6 | |||||||
| IR64 | 1 | C112–RG236 | 4 | Ph–G379 | 3.44 | −0.78*** | 6.3 | 3.55 | −0.74*** | 5.5 | ||||
| IR64 | 1 | CDO118–CDO455 | 3 | C74a–RG450 | 5.37 | −1.04*** | 11.3 | 2.42 | −0.71*** | 5.1 | ||||
| IR64 | 2 | RZ273–RG139 | 8 | G104–G1314a | 4.94 | 1.01*** | 10.6 | 4.39 | 0.45* | 0.83*** | 7.1 | |||
| IR64 | 3 | RG104–C515 | 10 | G1084–RZ400 | 4.50 | 0.83*** | 7.2 | 4.05 | 0.83*** | 6.9 | ||||
| IR64 | 4 | HHU39–RG143 | 5 | RG556–gl1 | 4.84 | 0.95*** | 9.3 | |||||||
| IR64 | 1 | RZ801–RZ14 | 2 | RG520–RZ446b | 3.75 | −0.83*** | 7.0 | |||||||
| IR64 | 4 | RG449–RZ69 | 11 | L457b–G2132b | 4.16 | 1.02*** | 10.5 | |||||||
ai and aj are the main effects of the loci i and j, estimated by the difference between heterozygote, the homozygote in the BCF1 populations (LT and TQ), and by the differences between the two heterozygotes (tester/Teqing − tester/Lemont) in the testcross populations (Z413 and IR64) using the F1 mean and HMP measurements; aaij is the epistatic effect between loci i and j, as defined by Mather and Jinks (1982). * Significance levels of P < 0.05. ** Significance levels of P < 0.001. *** Significance levels of P < 0.0001.
Digenic epistatic QTL affecting F1 hybrid performance and heterosis (HMP) of grains/plant (GP) detected in the Lemont (LT)/Teqing (TQ) BCF1 (RILs × LT and TQ) and two testcross F1 (RILs × Z413 and IR64) populations
| QTLi Marker interval | QTLj Marker interval | F1 | HMP | |||||||||||
|---|---|---|---|---|---|---|---|---|---|---|---|---|---|---|
| Pop. | Chromosome | Chromosome | LOD | aI | aj | aaij | R2 (%) | LOD | ai | aj | aaij | R2 (%) | ||
| LT | 1 | C112–RG236 | 11 | RZ53–RZ781 | 3.35 | −0.99*** | 12.3 | 4.61 | −1.31*** | 17.5 | ||||
| LT | 1 | R210–RZ382 | 2 | RG83–G1327 | 2.90 | 0.80*** | 8.1 | |||||||
| LT | 3 | RG450–RG100 | 8 | G187–G56a | 2.64 | 1.03*** | 13.3 | 2.36 | 1.14** | 13.2 | ||||
| LT | 5 | RG556–gl1 | 8 | C424b–RZ143 | 4.19 | −0.73** | −1.00*** | 10.2 | ||||||
| LT | 6 | RZ762–C76 | 8 | G187–G56a | 2.21 | 0.68** | 5.9 | 4.38 | 1.27*** | 16.5 | ||||
| LT | 9 | RZ777–CDO82 | 10 | C16–RG561 | 3.89 | −0.50* | −1.07*** | 14.5 | 3.42 | −0.72** | −0.81** | 6.6 | ||
| TQ | 1 | RG462–CDO118 | 6 | G200a–RZ667 | 3.57 | 0.50*** | 7.0 | 3.88 | 0.53*** | 6.0 | ||||
| TQ | 1 | CDO455–RZ776a | 1 | RG472–RG447 | 2.67 | 0.42** | 4.9 | |||||||
| TQ | 4 | HHU39a–RG143 | 11 | RG16–RZ797b | 3.99 | 0.27* | 0.58*** | 9.3 | 2.95 | 0.27* | 0.46** | 4.5 | ||
| TQ | 4 | G177–RZ590b | 6 | RG424–G1314b | 5.28 | −0.63*** | 10.9 | 4.07 | 0.45** | −0.64*** | 9.0 | |||
| TQ | 4 | RG214–Ph | 11 | RZ781–C975 | 3.14 | −0.54*** | 8.1 | 4.44 | −0.70*** | 10.8 | ||||
| TQ | 3 | C746–CDO337 | 6 | G1314b–HHU37 | 2.11 | 0.47** | 4.7 | |||||||
| TQ | 5 | RG556–gl1 | 11 | RG1109–RZ537b | 2.16 | −0.47** | 4.8 | |||||||
| Z413 | 1 | RZ14–C944b | 6 | G1468b–RG424 | 2.10 | 0.35** | 5.4 | 2.27 | 0.38** | 5.1 | ||||
| Z413 | 1 | CDO118–CDO455 | 5 | Y1049–R569a | 2.68 | −0.50*** | 8.4 | 4.31 | −0.67*** | 12.2 | ||||
| Z413 | 1 | C131–RG472 | 4 | RG1094e–Y1065Lc | 4.03 | 0.55*** | 10.1 | 3.5 | 0.52*** | 7.7 | ||||
| Z413 | 2 | RG139–C624x | 8 | C825a–CSU754 | 3.4 | 0.40** | −0.44*** | 6.4 | 3.05 | 0.43** | −0.42** | 7.5 | ||
| Z413 | 4 | Ph–G379 | 8 | G187–G56a | 2.38 | 0.34** | −0.36 | 5.3 | 2.65 | −0.39** | 5.4 | |||
| IR64 | 3 | G249–RG418 | 11 | RG1109–RZ537b | 2.16 | −0.29** | 6.4 | 4.81 | 0.26** | −0.20* | −0.35** | 6.4 | ||
| IR64 | 4 | G177–RZ590b | 11 | RG16–RZ797b | 4.15 | −0.19* | 0.33*** | 8.0 | 5.22 | −0.26** | 0.36*** | 6.6 | ||
| IR64 | 8 | C825a–CSU754 | 11 | RZ797b–RG1094d | 2.28 | −0.27** | 0.20* | 4.4 | 3.41 | −0.32** | 0.32** | 5.2 | ||
ai and aj are the main effects of the loci i and j, estimated by the difference between heterozygote, the homozygote in the BCF1 populations (LT and TQ), and by the differences between the two heterozygotes (tester/Teqing − tester/Lemont) in the testcross populations (Z413 and IR64) using the F1 mean and HMP measurements; aaij is the epistatic effect between loci i and j, as defined by Mather and Jinks (1982). * Significance levels of P < 0.05. ** Significance levels of P < 0.001. *** Significance levels of P < 0.0001.
Digenic epistatic QTL affecting F1 hybrid performance and heterosis (HMP) of 1000 grain weight (GW, g) detected in the Lemont (LT)/Teqing (TQ) BCF1 (RILs × LT and TQ) and two testcross F1 (RILs × Z413 and IR64) populations
| QTLi Marker interval | WTLj Marker interval | F1 | HMP | |||||||||||
|---|---|---|---|---|---|---|---|---|---|---|---|---|---|---|
| Pop. | Chromosome | Chromosome | LOD | aI | aj | aaij | R2 (%) | LOD | ai | aj | aaij | R2 (%) | ||
| LT | 1 | C944b–RG957 | 5 | RG13–CDSR49 | 3.10 | −0.86*** | 6.6 | |||||||
| LT | 2 | RZ476a–RZ599 | 3 | RG348a–C636x | 3.90 | −1.06*** | 9.2 | |||||||
| LT | 2 | G45–RZ386a | 5 | RG13–CDSR49 | 3.58 | 1.29*** | 13.8 | |||||||
| LT | 4 | G177–RZ590b | 11 | G44–RG1094b | 2.55 | −0.67** | 4.0 | |||||||
| LT | 5 | RG13–CDSR49 | 12 | G1106–RG901a | 3.51 | 0.86*** | 6.5 | |||||||
| LT | 6 | RG653–Z508 | 7 | RG29–G370b | 6.81 | 0.89** | 27.5 | |||||||
| LT | 6 | HHU37–RZ682 | 9 | G95–R662b | 2.96 | 0.86*** | 6.5 | |||||||
| LT | 6 | RZ516–RZ2 | 9 | RG451–RZ404 | 4.32 | 1.11*** | 10.2 | |||||||
| LT | 7 | RG29–G370b | 8 | G187–G56a | 3.37 | −0.92*** | 7.0 | |||||||
| TQ | 1 | RG236–RZ801 | 8 | C1073a–G187 | 5.47 | 0.75** | 1.14*** | 14.8 | 2.29 | 0.83** | 6.7 | |||
| TQ | 2 | RG83–G1327 | 3 | C746–CDO337 | 3.63 | 0.80*** | 6.2 | |||||||
| TQ | 2 | C624x–G45 | 8 | G187–G56a | 5.20 | −1.19*** | 16.1 | 3.44 | −1.01*** | 10.0 | ||||
| TQ | 5 | RG556–gl1 | 9 | RZ698–G95 | 2.41 | −0.64** | 5.1 | 2.58 | −0.90*** | 7.9 | ||||
| TQ | 5 | R569a–RG13 | 8 | G104–G1314a | 2.09 | −0.77** | 5.9 | 6.42 | −1.39*** | 18.8 | ||||
| TQ | 8 | C225c–G2132a | 12 | RG901a–G402 | 3.20 | 0.97*** | 9.1 | |||||||
| Z413 | 1 | RZ288–C131 | 10 | RG561–C223 | 2.73 | −0.58** | 5.3 | 1.76 | −0.46* | 4.5 | ||||
| Z413 | 3 | C515–RG348a | 6 | RG424–G1314b | 6.42 | −0.46** | 0.93*** | 11.1 | ||||||
| Z413 | 4 | RG214–Ph | 9 | RZ777–CDO82 | 2.85 | −0.54** | 5.7 | |||||||
| Z413 | 5 | RG556–gl1 | 6 | G294d–G294a | 2.05 | 0.50** | 4.9 | |||||||
| Z413 | 6 | G1314b–HHU37 | 7 | BCD855–CDO385 | 4.99 | 0.91*** | 10.6 | 3.59 | 0.81*** | 12.9 | ||||
| Z413 | 8 | G1314a–G2140 | 10 | RG561–C223 | 7.09 | −1.02*** | 13.6 | |||||||
| Z413 | 8 | RZ323a–C225c | 12 | G1106–RG901a | 5.50 | 0.85*** | 9.3 | |||||||
| IR64 | 1 | RG957–RG462 | 1 | RZ288–C131 | 4.92 | −0.69*** | 8.4 | 5.40 | 0.30* | −0.72*** | 10.0 | |||
| IR64 | 1 | CDO348–CDO226a | 12 | RG20q–RG91q | 2.82 | 0.51*** | 4.7 | |||||||
| IR64 | 2 | G1327–RG634 | 11 | RZ900–G44 | 2.60 | 0.57** | 5.6 | 3.63 | 0.61*** | 7.1 | ||||
| IR64 | 3 | RG482–CDO795a | 6 | G1314b–HHU37 | 4.94 | −0.30* | 0.64*** | 7.1 | ||||||
| IR64 | 4 | RG1094e–Y1065Lc | 8 | C225c–G2132a | 3.37 | 0.60*** | 6.3 | 2.59 | 0.66*** | 8.3 | ||||
| IR64 | 4 | RG1094e–Y1065Lc | 9 | CDO395–CDO1081 | 4.06 | −0 77*** | 10.4 | |||||||
| IR64 | 6 | G1314b–HHU37 | 9 | RG570a–RG451 | 2.94 | 0.66*** | 8.2 | |||||||
ai and aj are the main effects of the loci i and j, estimated by the difference between heterozygote, the homozygote in the BCF1 populations (LT and TQ), and by the differences between the two heterozygotes (tester/Teqing − tester/Lemont) in the testcross populations (Z413 and IR64) using the F1 mean and HMP measurements; aaij is the epistatic effect between loci i and j, as defined by Mather and Jinks (1982). * Significance levels of P < 0.05. ** Significance levels of P < 0.001. *** Significance levels of P < 0.0001.
(Li et al. 1997a). Similar to the grain yield (Li et al. 2001), the same general pattern of epistasis affecting the yield components was revealed for the yield components; i.e., most epistasis (79.4% in the RILs and 77.2% in the BC/testcross populations) occurred between complementary loci with no detectable main effects. In many fewer cases (17.6% in the RILs and 21.0% in the BC/testcross populations), epistasis occurred between a main-effect QTL and a complementary locus and in only one case between main-effect QTL. This result resembles the observation in the F4 progeny of the same cross (Li et al. 1997a). Thus, our results provide strong evidence for the presence of pronounced epistasis for grain yield or fitness-related traits in rice, which has been suggested by a large number of empirical studies in other selfing and outcrossing plant species (Allard 1988; Lamkey and Edwards 1999). The predominance of epistasis between complementary loci observed in this study suggests that fitness traits and grain yield are associated more with multilocus genotypes than with specific alleles at individual loci. Accurate detection and parameter estimation of epistasis then can be more easily achieved by direct comparison of differences among multilocus genotypes using reduced genetic models (Li 1997).
Our second conclusion (Li et al. 2001) that overdominance is an important property of most loci associated with heterosis for grain yield also appeared to hold true for the three yield components. Similar to grain yield, the parameters at most main-effect and epistatic QTL estimated from the heterosis values were greater than, or equal to, in magnitude, those from the F1 mean values for GP and PP. This suggested that these QTL were overdominant. It is interesting to note that QTL affecting GW could be divided into two independent groups. The first group showed primarily nonadditive gene action and explained 62.1% of the total variation in the trait heterosis (average across the four BC/testcross populations), while the other exhibited additive gene action and did not contribute to the trait heterosis. On average, this latter group of genes accounted for 28.1% of the total trait variation of the F1 mean values (Tables 6, 7 and 8), which was consistent with the relatively high heritability of GW observed in this study and many previous studies. In fact, we found that this was generally true for most quantitative traits studied in these populations except heading date, for which more main-effect QTL showing partial or complete dominance were detected (Li 2001; data not shown).
The apparent overdominance at both main-effect and epistatic QTL for grain yield and its components observed in the four related BC and testcross populations was overwhelming. Moreover, it is expressed more often as a common feature of multilocus genotypes than as the allelic interaction at single main-effect QTL (Crow 1952). Because of the resolution of 10–20 cM of our molecular linkage map, it is difficult to distinguish the true overdominance from pseudooverdominance generated by repulsion-phase linkage between genes of partial or complete dominance (Crow 1952; Stuber 1994, 1997). Also, many empirical studies indicate the presence of negative correlation between grain yield components, which suggests that apparent overdominance at QTL for grain yield might actually result from the multiplicative actions of tightly linked yield component QTL with opposite effects on yield. When we looked closely at the correspondences of the main-effect QTL affecting grain yield and its components (Figure 2, Tables 4, 5, 6, 7 and 8), we found that, of the 22 overdominant main-effect QTL affecting grain yield, 12 (44.4%) were associated with the main-effect QTL for one of the yield components (8 for GP, 2 for PP, and 2 for GW). In all cases, the QTL effects for yield and the components were in the same direction for increased trait values (and grain yield). Similarly, of the 24 overdominant epistatic QTL pairs affecting yield, 10 (41.7%) were attributed to the overdominant QTL pairs affecting GP, and in all cases, the epistatic effects were in the same direction for yield and GP. In only three cases (chromosomes 4, 6, and 9), the overdominant main-effect QTL affecting two of the components were mapped to the same locations of the yield QTL in the same population, but the QTL effects were in the same direction for increased trait values in all three cases. Thus, there was no evidence, at least in our study, suggesting that the overdominant QTL for grain yield were due to the pseudooverdominance from the repulsive linkage of completely or partially dominant QTL for yield components. It would be even less likely that the apparent overdominance at large numbers of the observed epistatic QTL was all attributable to pseudooverdominance. Crow (1999) pointed out that the dominance hypothesis can explain, at most, 5% of the yield heterosis in maize, while the commonly observed heterosis is often 30% or greater in maize, which is most likely due to overdominance. However, there is a major dilemma regarding how inbreeding depression is explained by the overdominance theory in which the mutation load is at the minimum (Crow 1999). In this respect, our results provide an adequate explanation. As discussed in our previous article (Li et al. 2001), inbreeding depression in rice contains two parts, the nonadditive genetic component resulting from disappearance of overdominance due to homozygosity and the additive genetic one arising from breakdown of co-adapted indica or japonica gene complexes by recombination and homozygosity. The significant genetic overlap, revealed by correlation analyses, between genes for heterosis and hybrid breakdown indicates that epistasis is the key for resolving this dilemma, as indicated by Goodnight (1999). One may imagine that the genetic load from recessive mutants of large deleterious effects in genomes of selfing plant species such as rice should be at the minimum because of its quick exposure, by selfing, to the strong natural
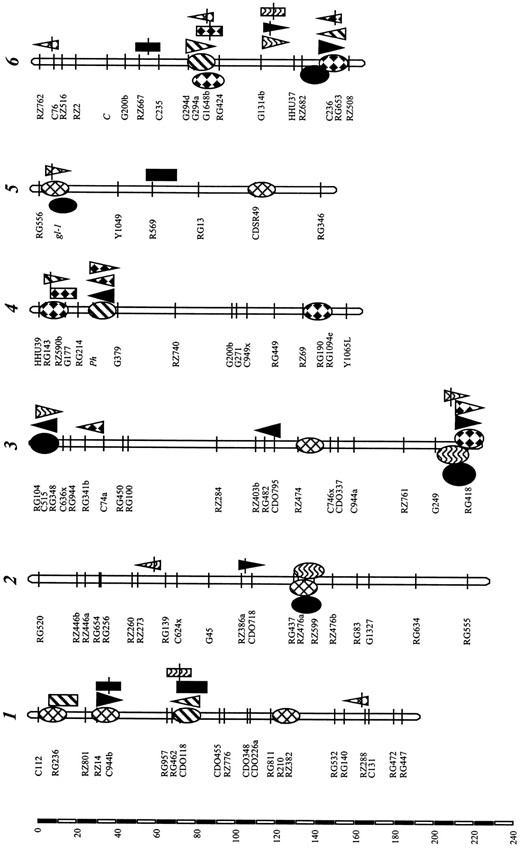
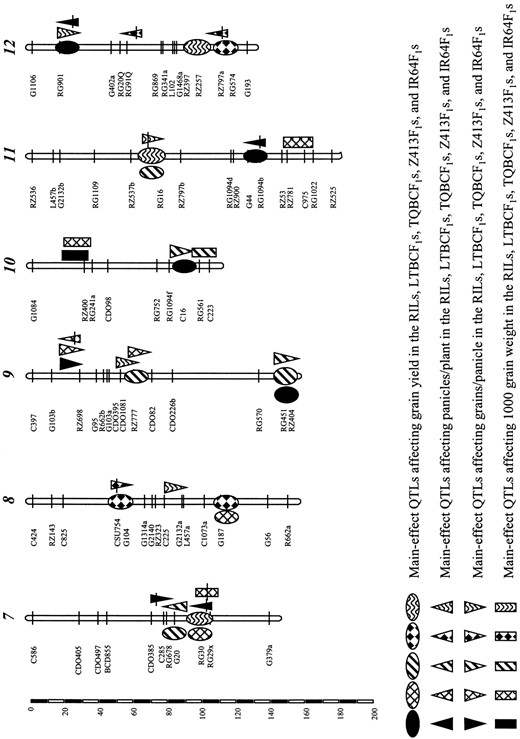
Genomic locations for main-effect QTL affecting grain yield and its components, associated with hybrid breakdown of the Lemont/Teqing recombinant inbred lines and heterosis of their two BCF1 and two testcross F1 populations. Symbols divided by horizontal lines are epistatic QTL having significant main effects on the yield components.
and artificial selection for increased yield (and fitness). Otherwise, one would have to explain why selection should favor such a high level of genetic load across the rice genome maintained by repulsion linkage (Li et al. 2001). Also, the genetic load from recessive deleterious mutants in the current maize populations is expected to be low. This is because strong and long-term selection for increased yield, elevated recombination in breeding populations by outcrossing, and reinforced selfing for development of inbred parents should have eliminated most deleterious mutants. This argument is evidenced by the many-fold increase in the yields of the current maize inbreds since the beginning of the century (Duvick 1999). Even with such an increase in the yield level of maize inbreds, there is no sign for a corresponding decrease in heterosis for most maize hybrids (Duvick 1999). Thus, it is not unlikely that the pronounced epistasis and overdominance we observed in rice may have played an important role in the heterosis observed in maize and other plant and animal species, although epistasis has not been adequately tested and characterized in most of these species.
It should be pointed out that as the collective effect on a specific trait, of all genes showing nonadditive action, heterosis is part of the genetic basis of that trait. According to evidence from numerous classical quantitative genetic studies, it would be expected that the genetic basis of heterosis may vary considerably, depending on specific traits and materials involved, even though to most plant and animal breeders, heterosis very often stands for complex fitness-related traits of economic importance. Thus, results of complete or partial dominance at main-effect QTL for yield components and other quantitative traits may not provide sufficient evidence supporting the dominance theory of heterosis, unless the other alternative hypotheses are adequately tested (Xiao et al. 1994).
Implications for rice improvement: Indirect selection for grain yield components to improve yield potential in grain crops has been a common selection strategy practiced by many plant breeders, which is based on the expected contributions of component traits to yield. However, numerous classic genetic studies have clearly shown that the phenotypic relationships between yield and its components in grain crops are complex and that the genetic basis of the relationships in segregating breeding populations remains poorly understood. Results from this study have several implications for rice breeding for improved yield potential.
First, to break the yield ceiling of hybrid rice cultivars, simultaneous selection for all three yield components, with emphasis on increased panicle size (more grains per panicle), should be much more efficient than selecting for single components. This is so because the levels of heterosis and genetic variation in the segregating populations (particularly for intersubspecific crosses), and the contribution to grain yield, were much greater for panicle size than for panicle number and grain weight, while genes/QTL affecting the three yield components appeared to be independent. This result is consistent with empirical experiences with the common rice hybrid cultivars (Zeng et al. 1979). Second, selection for improved yield potential of parental lines may not necessarily result in the expected gain in the hybrids. In this study, we found that none of the top 20 high-yielding RILs had high levels of trait heterosis and very few of them resulted in top high-yielding BC/testcross F1 hybrids. This coincides well with Filho's statement (1999, p. 73) that “Strong inbreeding depression will result in a high heterosis expression,” suggesting that separate efforts should be taken for breeding high-yielding inbred and hybrid cultivars in rice. Finally, prediction of yield heterosis of hybrids using either molecular markers or phenotypic values of parental lines would be impossible because of the complexity of the genetic basis associated with heterosis.
Acknowlegement
We are grateful to Drs. S. Tansley and S. McCouch of Cornell University and the Japanese Rice Genome Research Program for providing us with DNA probes. This research was supported by a grant from the Rockefeller Foundation to Z. K. Li and A. H. Paterson and by a grant from the Chinese Ministry of Agriculture to C. S. Ying and L. J. Luo. L. J. Luo, D. L. Wang, and H. W. Mei were also supported by the RF fellowships.
Footnotes
Communicating editor: Z-B. Zeng
LITERATURE CITED
