


Abstract
Drosophila melanogaster appears to be well suited as a model organism for quantitative pharmacogenetic analysis. A genome-wide deficiency screen for haploinsufficient effects on prepupal heart rate identified nine regions of the genome that significantly reduce (five deficiencies) or increase (four deficiencies) heart rate across a range of genetic backgrounds. Candidate genes include several neurotransmitter receptor loci, particularly monoamine receptors, consistent with results of prior pharmacological manipulations of heart rate, as well as genes associated with paralytic phenotypes. Significant genetic variation is also shown to exist for a suite of four autonomic behaviors that are exhibited spontaneously upon decapitation, namely, grooming, grasping, righting, and quivering. Overall activity levels are increased by application of particular concentrations of the drugs octopamine and nicotine, but due to high environmental variance both within and among replicate vials, the significance of genetic variation among wild-type lines for response to the drugs is difficult to establish. An interval mapping design was also used to map two or three QTL for each behavioral trait in a set of recombinant inbred lines derived from the laboratory stocks Oregon-R and 2b.
MOLECULAR dissection of complex multifactorial traits is emerging as one of the major challenges for geneticists in the next few decades. Behavior, cardiovascular disease, and cancer susceptibility are three prominent human examples, genetic analysis of which is being driven by advances in statistical and computational methods as well as the advent of high-throughput genotyping techniques (Collins et al. 1999). Genome scans for associations between single nucleotide polymorphisms and disease have been undertaken as a first step toward the identification of the genetic components of multifactorial diseases such as schizophrenia (Williams et al. 1999) and severe depression (Friddle et al. 2000), but results are inconclusive and tempered by concerns over statistical power, among other factors (Bull et al. 1999; Zhao et al. 1999). Consequently, a renewed emphasis on association studies between candidate genes and particular traits is apparent (Catalano 1999; O’Donovan and Owen 1999). There is a pressing need for model systems that will allow critical assessment of both statistical methodologies and physiological conclusions in relation to behavioral traits in particular.
Drosophila melanogaster presents numerous advantages for quantitative genetic analysis, as evidenced by the contributions made toward our understanding of the molecular basis of variation in complex traits such as central metabolism and bristle number (Mackay 1996). In addition to resources such as high-resolution genetic and physical maps, extensive collections of mutations, and detailed knowledge of the distribution of nucleotide variation (Moriyama and Powell 1996), flies offer compelling experimental advantages relating to the ability to manipulate the genetic background and control the environment. With respect to behavior, it can be argued that neuronal organization is likely to be more simple than in mammals (and hence that fewer genes should contribute to any given trait), that there is no cultural transmission that confounds genetic with other familial factors, and that panmixia removes complications due to population stratification.
Biogenic monoamines are a class of neurotransmitter with highly conserved roles in synaptic transmission in all animals (Walker et al. 1996). Dopamine and serotonin are thought to be crucial modulators of mood and personality dimensions, as well as of response to environmental stimuli, by virtue of their activity in the limbic system and hypothalamus of mammals (Nicholls et al. 1992), and also modulate heart rate and other targets of the sympathetic nervous system (Dangman and Miura 1991). In insects, dopamine, serotonin, and octopamine are well-studied neurotransmitters, administration of which modulates numerous physiological functions including heart rate (Gu and Singh 1995; Johnson et al. 1997; Zornik et al. 1999) and locomotor activity (Yellman et al. 1997; Hirsh 1998). Receptors for these monoamines are also highly conserved in evolution (Hen 1993), tend to be present in several copies per genome, and show complex patterns of expression and alternative splicing. Monoamine activity is further regulated by transporters that remove them from synapses and by numerous enzymes that affect their biosynthesis. Since dopa is a precursor for cuticle formation (Sugumaran et al. 1992) and melanin biosynthesis (Walter et al. 1996), genes involved in monoamine metabolism also have pleiotropic effects on scleratization and pigmentation (True et al. 1999).
The Drosophila dorsal vessel is homologous to the vertebrate heart, as shown by conservation of developmental genetic mechanisms (Bodmer and Venkatesh 1998) as well as of several aspects of function (Rizki 1978). Physiological similarities include the role of potassium and calcium ion channels in modulation of beat length (Gu and Singh 1995), as well as the use of pacemakers that are responsive to numerous neurotransmitters, including monoamines and neuropeptides (Zornik et al. 1999). Heart rate can be recorded in living immobile prepupae simply by capturing the fluctuation in light intensity due to movement of the dorsal vessel in the posterior body cavity and similarly in dissected embryonic, larval, or adult preparations. There is extensive genetic variation for Drosophila heart rate, which among wild-type lines at 25° ranges from a mean per line of just under 2 to approaching 3.5 beats per second (Robbins et al. 1999). The variance of beat length within an individual tends to be slightly less than the between-individual variation within a line, which is similar to the average difference between lines of 0.2 to 0.3 beats per second.
Genetic approaches have been applied to the dissection of numerous behaviors in flies, most extensively of learning (Dubnau and Tully 1998), circadian rhythm (Rosbash 1995), and mating behavior (Yamamoto and Nakano 1998), but also including more specific activities such as foraging (Osborne et al. 1997), olfactory avoidance (Anholt et al. 1996), grooming (Phillis et al. 1993), drug responses, and, recently, spontaneous reflex behaviors in decapitated adults (Hirsh 1998). Standard laboratory strains are relatively inactive upon beheading, but will stand on all six legs for several days, occasionally grooming, especially if one of their mechanoreceptor bristles is touched. Hirsh and coworkers have shown that placement of a droplet of one of the biogenic monoamines elicits grooming activity at a much higher rate and will also induce the headless flies to start walking around in circles (Yellman et al. 1997). Octopamine is the most active monoamine, there is some sex specificity to the response (males tend to show slightly heightened locomotion relative to females), and mutations in the dopamine enzymatic pathway alter the responses as well as levels of monoamines in the animals.
Here we show that there is actually genetic variation among wild-type lines, marginally for the response to drug application to headless flies, but unambiguously in the level and types of spontaneous activities immediately following decapitation. These include grooming, quivering, grasping, and the ability to self-right. Results are presented that imply that quantitative trait loci for autonomic behaviors can be mapped, but methodological constraints due to the difficulty in controlling the genetic background are discussed. It is concluded that Drosophila has enormous potential for genetic dissection of neurotransmitter-related behaviors, as long as effects are tested across multiple genetic backgrounds. As in other organisms, candidate gene approaches may be more enlightening than genome scans.
MATERIALS AND METHODS
Flies and behavior assays: All stocks were obtained from the Bloomington Stock Center (full genotypes are available from FlyBase or by request). The green balancers (Ferrandon et al. 1998) have P{w[+ mC] = ActGFP} insertions on FM7i, CyO, and TM3,Ser (stocks 4559, 4533, and 4534, respectively). This allows progeny to be genotyped as pupae, since the guts of pupae carrying a green balancer fluoresce brightly. Flies were maintained on 10 ml standard cornmeal medium supplemented with live yeast in plastic vials in a growth room maintained at 25° and 80% humidity on a 12-hr light-dark cycle.
Heart rate assays were performed as described (Robbins et al. 1999) by electronic capture of the fluctuation in transmitted light intensity due to movement of the dorsal vessel of a white prepupa placed on a microscope stage. For the initial deficiency screen the temperature in the lab remained constant at 24 ± 2°. For the crosses to wild-type backgrounds, measurements were made in a separate dark room so that green fluorescence could be observed immediately following recording, but the temperature fluctuated over the range 18° to 26° as indicated in Figure 2. The six wild-type lines derived from a variety of localities were chosen to cover the full wild-type range of pupal heart rate and, in order of increasing rate, were: A8 (2.0 beats per second), W14 (2.7), W6 (2.8), A1 (2.8), W11 (3.0), and A20 (3.3). Each isofemale line was inbred by at least 10 generations of pair mating and so were nearly isogenic. Several virgin females of the wild-type line were crossed in multiple replicates to two male progeny that carried the green balancer, derived from the cross of females of the deficiency stock to males of the relevant green balancer stock. Heart rate was scored in white prepupae derived from this cross, allowing for comparison of deficiency/wild-type and balancer/wild-type siblings. Pupae were taken at random from replicates until at least 20 individuals were scored per cross. This crossing scheme also helps to homogenize the two chromosomes not being compared, reducing their contribution to genotypic variance from the original stocks.
Headless behavior assays were performed in a growth room maintained at 25° by tipping up to 50 flies into an empty vial, which was placed on ice for 3-5 min to lightly anaesthetize the flies. These were then knocked onto the base of a dissecting microscope in pairs, and a single cut at the neck was made with a pair of microscissors until 5 flies of each sex were beheaded. As they awoke over the next 2-3 min, headless flies were nudged into an upright position and allowed to stand and recover for a further 2 min. The four behaviors were assayed over the next 5 min, 1 fly at a time. Subsequently, a droplet of 10 mm octopamine [Sigma (St. Louis) O0250] or 0.3% nicotine (Sigma N0267) in 10 mm sodium phosphate buffer (pH 6.0) was applied to the severed neck of each fly with a micropipette for 5 sec, and the enhanced activity was scored over the succeeding 15 sec.
Statistics: Analysis of variance was performed using PROC GLM in SAS (SAS Institute 1990). For heart rate, the model was y = B + G + B × G + E, where B refers to the wild-type background, G the genotype (deficiency or green balancer), and E the error term. All effects were fixed, since the backgrounds were chosen a priori to cover the range of wild-type values, and the crosses can be replicated at will. Replication was not included as a separate term since individuals were taken from different numbers of crosses according to the fecundity of each cross. Consequently, the E mean square was used as the error term for all three effect tests.
For headless behaviors, the model was y = L + V(L) + E, where L refers to the isofemale line (derived from a collection of Kenyan stocks) and V(L) is the replicate vial within line term; or, simply, y = L + E, where the proportion of individuals within a vial that showed each individual behavior was the data point (Table 3). A randomized block design was employed such that day effects were not confounded with lines (no line was scored more than once on any given day, and different combinations of lines were scored each day), but the design was not completely orthogonal since only a subset of lines were scored each day. Both the line and vial effects were random variables. Arcsin transformation of proportion values did not affect the significance values for any of the traits. Variance components were calculated using PROC VAR-COMP, and broad sense heritability was estimated simply as VLine/VTotal (Falconer and Mackay 1996, p. 123). The genetic correlation was estimated as the covariance between line means for pairs of phenotypes, divided by the square root of the product of the two among line variance components (Falconer and Mackay 1996, p. 316).
Interval mapping: The set of 94 recombinant inbred lines derived from the cross of Oregon-R and Russian 2b (Nuzhdin et al. 1997), as well as a recombination map based on retrotransposon insertion sites in the polytene chromosomes, were provided by J. Leips and T. Mackay. Twenty lines were excluded due to consistently poor growth, leaving the set of 74 lines analyzed here. The four autonomic activities were scored on five flies of each sex for six replicate vials in a randomized block design spread over 4 months (February to May 2000) with between five and eight vials scored per day. Composite interval mapping was performed using QTL Cartographer Windows Version 1.01 (Basten et al. 1999) downloaded from http://statgen.ncsu.edu/qtlcart/, with a 10 cm window size and five background parameters in Model 6 chosen by forward selection. Likelihood ratio (LR) significance thresholds were determined by ranking the highest LR observed in 1000 random permutations of each data set and taking the 950th value. Putative quantitative trait locus (QTL) peaks were then retested by linear multiple regression using JMP Version 3 (SAS Institute 1995) according to models of the form Y = Mi + Mj + Mi × Mj + e, where Y is the trait of interest for both sexes combined and Mi and Mj are marker genotypes closest to the QTL peak. Leverage plots (Sall 1990) in Figure 5 were generated from these analyses.
RESULTS
Deficiency screen for modifiers of heart rate: An efficient method for identifying mutations that have a subtle or quantitative effect on a trait is to screen a panel of deficiency-bearing chromosomes for haploinsufficient phenotypes. A kit of 134 deficiency chromosomes that collectively cover ∼70% of the D. melanogaster genome was used to screen for hemizygotes that have reduced or increased heart rate relative to the remainder of the sample. Most of the deficiencies remove part of a cytological band on polytene chromosome spreads, which corresponds to <1% of the genome, but in some cases may include up to 100 genes, at least 1 of which is homozygous lethal. The chromosomes are maintained over a balancer, and pupae are assumed to be heterozygous for the balancer and deficiency-bearing chromosomes in an inbred background or, in the case of X-linked deficiencies, to be either heterozygous females or males carrying the balancer. Many of the deficiencies overlap slightly, but most regions of the genome were only included in one deficiency.
Heart rates were initially scored in five pupae with each chromsome taken from at least two separate bottle stocks. For the more extreme chromosomes, five more pupae were measured, but no qualitative changes in mean rate were observed. Table 1 shows the complete list of chromosomes, the extent of each deficiency, the mean prepupal heart rate, and standard deviation of the rate between individuals. The results are presented graphically in Figure 1, which shows that there is a continuous distribution of rates between 2 and 3 beats per second, with a half dozen lines on either side of these values that are qualitatively extreme.
The average rate per chromosome for the entire set of deficiencies was 2.52 beats per second, with a standard deviation of 0.37 and a range of 1.88 beats per second, very similar to the values we observed for a set of highly inbred wild-type lines (Robbins et al. 1999). Rates were slightly higher on the X chromosome, possibly reflecting an excess of females (which have slightly higher heart rates than males) and deficit of deficiency-bearing males. Differences among deficiency chromosomes were highly significant (P < 0.0001).
Confirmation of deficiency effects in different genetic backgrounds: Since all but a few of the chromosomes have mean heart rates within two standard deviation units of the mean, it is possible that the apparent haploinsufficient phenotypes of the more extreme chromosomes might be due to segregating “wild-type” polymorphism rather than the deficiencies per se. In general, each deficiency was isolated in different laboratories and therefore in different genetic backgrounds, and several different balancers were used in the stocks. To reduce these sources of variation, 15 chromosomes were retested in up to six different wild-type backgrounds and with just one second chromosome and one third chromosome balancer. The retested chromosomes were selected from the seven highest and seven lowest heart rates in the initial screen and supplemented with 6 other randomly selected moderately extreme chromosomes; 5 of these 20 chromosomes were subviable in several of the wild-type backgrounds and so were discounted.
Haploinsufficient effects were tested in these crosses as a significant main effect of genotype in a two-way analysis of variance with background as a cross-classified fixed effect. The six near-isogenic wild-type backgrounds were chosen to cover the full range of wild-type values (see materials and methods). As balancers, green fluorescent protein (GFP) expressing FM7, CyO, and TM3 derivatives (Ferrandon et al. 1998) was used so that hemizygous and heterozygous progeny of the cross of wild type by Df/Bal-GFP testers could be distinguished as pupae. Heart rates of close to 20 prepupae from each cross, taken from several different vials, were measured in a laboratory in which the temperature ranged from 18° to 26°. There was a highly significant linear regression of rate on temperature for the entire data set (Figure 2) such that heart rate increases at a rate of 0.14 beats per second for every increment of 1°. Consequently, residuals rather than raw scores were used in the ANOVA, although this did not affect the conclusions.
Pupal heart rates in 134 deficiency stocks
| Dfa | Rateb | SDc | Locationd | Df | Rate | SD | Location | Df | Rate | SD | Location |
|---|---|---|---|---|---|---|---|---|---|---|---|
| (1)N-8 | 2.11 | 0.40 | 3C-3E | (2L)H20 | 2.24 | 0.10 | 36A-36E | (3L)R-G7 | 2.22 | 0.16 | 62B-62F |
| (1)JC70 | 2.95 | 0.44 | 4C-5A | (2L)TW50 | 2.41 | 0.21 | 36E-38A | (3L)HR232 | 2.47 | 0.36 | 63C-63D |
| (1)C149 | 3.05 | 0.18 | 5A-5C | (2L)VA12 | 2.86 | 0.42 | 37C-38B | (3L)HR119 | 2.70 | 0.41 | 63C-63E |
| (1)N73 | 2.93 | 0.55 | 5C-5D | (2L)TW84 | 1.93 | 0.31 | 37F-39E | (3L)GN50 | 2.40 | 0.25 | 63E-64B |
| (1)5D | 2.71 | 0.36 | 5D-5E | (2L)TW161 | 2.66 | 0.49 | 38A-40A | (3L)GN24 | 1.82 | 0.38 | 63F-64C |
| (1)J45 | 2.88 | 0.34 | 5E | (2L)DS6 | 1.95 | 0.48 | 38F-39E | (3L)pbl-X1 | 2.47 | 0.44 | 65F-66B |
| (1)G4eLH24iR | 2.46 | 0.44 | 5E-6B | (2R)r110a | 2.94 | 0.27 | 41A | (3L)66C-G28 | 2.47 | 0.29 | 66B-66C |
| (1)HA32 | 3.04 | 0.78 | 6E-7A | (2R)ST1 | 2.33 | 0.34 | 42B-43E | (3L)h-i22 | 2.98 | 0.48 | 66D-66E |
| (1)ct268-42 | 2.97 | 0.22 | 7A-7B | (2R)pk78s | 2.63 | 0.07 | 42B-43F | (3L)29A6 | 2.08 | 0.45 | 66F-67B |
| (1)ct4b1 | 2.65 | 0.13 | 7B-7C | (2R)cn9 | 2.58 | 0.15 | 42E-44C | (3L)BK9 | 2.64 | 0.33 | 68E-68F |
| (1)C128 | 3.12 | 0.24 | 7D | (2R)H3C1 | 2.79 | 0.16 | 43F-44D | (3L)Ly | 2.92 | 0.22 | 70A |
| (1)KA14 | 2.56 | 0.40 | 7F-8C | (2R)H3E1 | 2.89 | 0.29 | 44D-44F | (3L)fz-GF3b | 2.02 | 0.22 | 70C-70D |
| (1)9a4-5 | 2.87 | 0.35 | 8C-8E | (2R)B5 | 2.67 | 0.80 | 46A-46C | (3L)D-5rv12 | 2.51 | 0.23 | 70C-72A |
| (1)C52 | 2.57 | 0.27 | 8E-9C | (2R)X1 | 2.20 | 0.22 | 46C-47A | (3L)fz-GS1a | 2.06 | 0.76 | 70D-70E |
| (1)HA85 | 2.37 | 0.32 | 10C-11A | (2R)Stan2 | 1.80 | 0.40 | 46F-47D | (3L)fz-M21 | 2.52 | 0.37 | 70D-71E |
| (1)N105 | 2.92 | 0.54 | 10F-11D | (2R)E3363 | 2.68 | 0.34 | 47A-47F | (3L)BK10 | 1.90 | 0.32 | 71C-71F |
| (1)N12 | 2.39 | 0.56 | 11D-11F | (2R)en-A | 2.21 | 0.36 | 47D-48B | (3L)brm11 | 2.03 | 0.26 | 71F-72D |
| (1)C246 | 1.84 | 0.37 | 11D-12A | (2R)en30 | 2.52 | 0.61 | 48A-48C | (3L)st-f13 | 2.25 | 0.43 | 72C-73A |
| (1)sd72b | 2.99 | 0.31 | 13F-14B | (2R)vg-C | 2.42 | 0.32 | 49A-49E | (3L)st-7 | 1.51 | 0.28 | 73A |
| (1)4b18 | 3.34 | 0.33 | 14B-14C | (2R)CX1 | 2.21 | 0.24 | 49C-50D | (3L)81k19 | 1.99 | . | 73A-74F |
| (1)N19 | 3.21 | 0.38 | 17A-18A | (2R)trix | 2.39 | 0.42 | 51A-51B | (3L)W10 | 1.74 | 0.42 | 75A-75C |
| (1)JA27 | 2.42 | 0.30 | 18A-18D | (2R)Jp1 | 1.54 | 0.18 | 51C-52F | (3L)Cat | 2.88 | 0.58 | 75B-75F |
| (1)HF396 | 2.33 | . | 18E-20E | (2R)Jp8 | 2.88 | 0.09 | 52F | (3L)rdgC-co2 | 2.24 | 0.26 | 77A-77D |
| (1)A209 | 2.56 | 0.82 | 20A-20F | (2R)Pc17B | 2.93 | 0.35 | 54E-55B | (3L)ri-79c | 2.67 | 0.26 | 77B-77F |
| (2R)Pc111B | 2.46 | 0.43 | 54F-55C | (3R)6-7 | 2.75 | 0.60 | 82D-82F | ||||
| (2L)net-PMF | 2.67 | 0.36 | 21A-21B | (2R)PC4 | 2.91 | 0.47 | 55A-55F | (3R)Scr | 2.05 | 0.17 | 84A-84B |
| (2L)ast2 | 2.56 | 0.31 | 21D-22B | (2R)PC29 | 2.95 | 0.28 | 55C-56B | (3R)Antp-17 | 2.20 | 0.03 | 84B-84D |
| (2L)C144 | 2.50 | 0.07 | 23A-23C | (2R)P34 | 2.86 | 0.25 | 55E-56B | (3R)by10 | 2.20 | 0.37 | 85D-85E |
| In(2LR)DTD | 2.63 | 0.31 | 23C-23E | (2R)017 | 2.09 | 0.27 | 56F | (3R)M-Kx1 | 2.17 | 0.36 | 86C-87B |
| (2L)E110 | 2.33 | 0.18 | 25F-26D | (2R)AA21 | 2.63 | 0.24 | 56F-57D | (3R)T-32 | 2.75 | . | 86E-87C |
| (2L)Dwee-Δ5 | 2.88 | 0.29 | 27A-28A | (2R)Pu-D17 | 2.98 | 0.37 | 57B-58B | (3R)red31 | 2.38 | 0.22 | 87F-88C |
| (2L)J-H | 2.85 | 0.30 | 27C-28B | (2R)X58-7 | 2.65 | 0.38 | 58A-58E | (3R)red-P93 | 3.39 | 0.34 | 88A-88C |
| (2L)spd | 2.18 | 0.42 | 27D-28C | (2R)X58-12 | 2.44 | 0.24 | 58D-59A | (3R)Cha7 | 2.10 | 0.60 | 91A-91F |
| (2L)Te29Aa11 | 2.34 | 0.29 | 28E-29B | (2R)59AB | 2.98 | 0.24 | 59A-59B | (3R)D1-BX12 | 2.93 | 0.25 | 91F-92D |
| (2L)N22-14 | 2.08 | 0.39 | 29C-30C | (2R)59AD | 2.48 | 0.38 | 59A-59D | (3R)e-R1 | 2.36 | 0.21 | 93B-93D |
| (2L)s1402 | 2.38 | 0.45 | 30C-30F | (2R)bw-s46 | 2.14 | 0.28 | 59D-60A | (3R)e-N19 | 2.88 | 0.36 | 93B-94A |
| (2L)Prl | 2.45 | 0.28 | 32F-33F | (2R)Px2 | 2.43 | 0.48 | 60C-60D | (3R)23D1 | 2.22 | 0.27 | 93F-94F |
| (2L)esc10 | 3.00 | 0.34 | 33A-33B | (2R)M60E | 2.24 | . | 60E | (3R)mbc-R1 | 2.02 | 0.67 | 95A-95D |
| (2L)escP2-0 | 3.19 | 0.37 | 33A-33B | (2R)ES1 | 2.71 | 0.38 | 60E-60F | (3R)crb87-4 | 2.58 | 0.47 | 95E-95F |
| (2L)escP3-0 | 2.73 | 0.55 | 33A-33E | (3R)crb87-5 | 2.75 | 0.56 | 95F-96A | ||||
| (2L)e180fl | 1.98 | 0.22 | 34E-35D | (3R)Tl-P | 2.40 | 0.32 | 97A-98A | ||||
| (2L)osp29 | 2.49 | 0.42 | 35B-35E | (3L)emc-E12 | 1.95 | 0.49 | 61A-61D | (3R)D605 | 2.44 | 0.71 | 97E-98A |
| (2L)TE35BC24 | 2.53 | 0.42 | 35B-35F | (3L)Ar12-1 | 2.75 | 0.23 | 61C-61F | (3R)3450 | 2.47 | 0.28 | 98E-99A |
| (2L)r10 | 2.86 | 0.24 | 35E-36A | (3L)Ar14-8 | 2.56 | 0.26 | 61C-62A | (3R)Dr-Rrvl | 2.99 | 0.38 | 99A-99B |
| (2L)cact255 | 2.93 | 0.29 | 35F-36D | (3L)Aprt-1 | 2.14 | 0.40 | 62A-62D | (3R)01215 | 2.71 | 0.22 | 99A-99C |
| (3L)R-G5 | 2.45 | 0.44 | 62B-62C | (3R)faf-BP | 2.67 | 0.39 | 100D-F |
Deficiency name. Full genotype and stock numbers available from FlyBase or by request.
Mean rate.
Standard deviation of rate (. if n < 4).
Cytological location of breakpoints according to FlyBase.
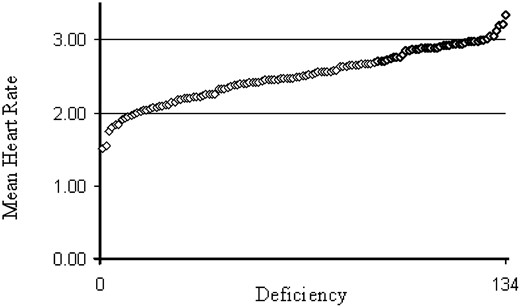
—Range of variation for prepupal heart rate in 134 deficiency-bearing stocks. The mean heart rate for 134 lines listed in Table 1 is plotted from lowest to highest. An even distribution is seen between 2.0 and 3.0 beats per second, with several outliers at either end of the distribution, most of which were retested across several genetic backgrounds.
Of the 15 chromosomes that were retested, 6 were expected to have high heart rates, 7 low, and 2 intermediate on the basis of the initial observations, and all but 2 (chromosomes 949 and 2479) showed a difference across genetic backgrounds in the expected direction (Table 2). This implies that the deficiency-bearing chromosomes are likely to have contributed at least in part to the extreme values in 11 of the 13 original measures. However, the difference in mean heart rate between deficiency and balancer siblings was significant for only three of the high lines and four of the low lines, indicating that variation unrelated to the deficiencies can also be responsible for extreme values in laboratory stocks.
The background by genotype interaction term in the ANOVAs is also of interest, as significant values are indicative of dominance or epistatic components of genotypic variance (Long et al. 1996; Lyman and Mackay 1998). This term has also been proposed as a method for fine-scale mapping of quantitative trait loci using a panel of overlapping deficiencies (Pasyukova et al. 2000). Four of the retested chromosomes gave significant interaction terms (Table 2, plotted in Figure 3). Two of these were marginal effects, two more robust. These crosses were subsequently replicated with qualitatively similar results, although the significance of the interaction terms was not notably increased by the replication. It should also be noted that vial effects were not included in this analysis since fecundity differences and the narrow time window within which heart rate can be assayed in living pupae results in variation in the number of individuals within vials and number of vials used per cross, leading to an unbalanced design. If variation among vials is greater than that within, the higher error term would decrease F-ratios and the significance of the B × G interactions still further.
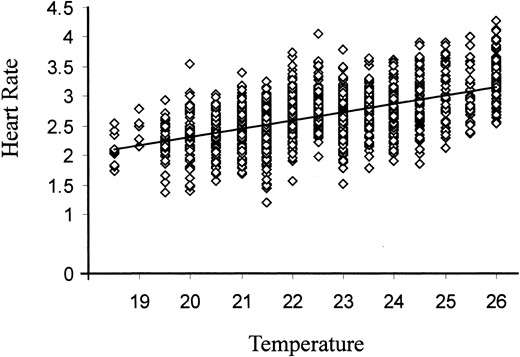
—Regression of prepupal heart rate on temperature. The recorded mean heart rate over two 20-sec intervals for each of 1498 pupae derived from the cross of deficiency/green balancer males to inbred wild-type females is plotted against temperature. The mean rate increases by 0.98 beats per second over 7°, identical to the value reported in Johnson et al. (1997). Linear regression fits the data as well as any other curve fits that were tested, so residuals from this regression were used in the analysis of variance reported in Table 2.
Genetic variation for headless behavior: Given that heart rate is physiologically regulated by neurotransmitters, we were interested to see whether other behavioral traits might also display high levels of genetic variation. A promising candidate trait was headless behavior, which has been shown to be elicited by application of each of the monoamines, dopamine, serotonin, and octopamine (Yellman et al. 1997). In an exploratory survey of a set of isofemale lines we were astonished to find that each line could be distinguished on the basis of the frequency of flies that display a set of four spontaneous activities prior to application of any drug. These behaviors are grooming with the hind legs, quivering of the abdomen (which is mostly a male behavior), grasping with all three pairs of legs of a pointer placed between the legs, and the ability of flies placed on their backs to self-right. In addition, all lines exhibit some degree of foreleg grooming, but there was little if any genetic variation for this activity.
Genetic differences among 12 Kenyan isofemale lines for the four headless behaviors are plotted in Figure 4A. Since the scores are dichotomous (yes/no), differences among lines of the proportion of 10 flies randomly chosen from each of six replicate vials that displayed each behavior were tested by ANOVA. With the exception of male abdominal quivering, differences among lines were highly significant (Table 3), which allowed estimates of the heritability of each headless behavior to be made from the ratio of genetic to phenotypic variance in the sample. Values of 0.36 for hindleg grooming, 0.60 for grasping, and 0.41 for righting should be reduced by up to a half to obtain more realistic estimates of the proportion of variance that is due to genetic differences, since the wild-type lines are inbred relative to wild-type flies (Falconer and Mackay 1996, p. 264). Although the genetic variance for quivering is nonsignificant in the total sample, pairwise comparisons of extreme lines do imply that differences exist (not shown). Genetic correlations among the three heritable behaviors ranged from 0.27 (hindgrooming and righting) to 0.71 (grasping and righting), suggesting that different genes are responsible for some of the variation of each trait. Performing the ANOVA with each individual as a separate data point allowed the significance of the among-vial effects to be assessed as well, and these were significant (P < 0.0001) in all cases, indicating a high level of uncontrolled environmental variance.
Effect of genetic background on pupal heart rate of 15 deficiency chromosomes
| Chromosome | Nba | Nib | wt/Bal | wt/Df | Diffc | P(B)d | P(G)e | P(B × G)f |
|---|---|---|---|---|---|---|---|---|
| Df(2L)TW84 | 6 | 120 | -0.004 | -0.345 | -0.341 | 0.0012 | <0.0001 | 0.9239 |
| Df(2R)stan2 | 6 | 119 | 0.013 | -0.184 | -0.197 | <0.0001 | 0.0008 | 0.0978 |
| Df(2L)escP2-0 | 6 | 119 | 0.092 | 0.298 | 0.206 | 0.0002 | <0.0001 | 0.0048 |
| Df(2L)N2214 | 6 | 106 | -0.003 | -0.133 | -0.130 | 0.0310 | 0.0049 | 0.0162 |
| Df(1)C149 | 6 | 106 | 0.077 | -0.092 | -0.169* | <0.0001 | 0.0033 | 0.5125 |
| Df(1)N19 | 6 | 96 | 0.029 | 0.052 | 0.023 | <0.0001 | 0.7172 | 0.8184 |
| Df(3L)st7 | 5 | 93 | -0.090 | -0.301 | -0.211 | 0.0002 | 0.0009 | 0.2807 |
| Df(3L)29A6 | 5 | 90 | -0.194 | -0.028 | 0.166* | <0.0001 | 0.0047 | 0.1793 |
| Df(2L)cl-h3 | 5 | 83 | 0.273 | 0.578 | 0.305 | <0.0001 | 0.0002 | 0.0666 |
| Df(1)C128 | 4 | 84 | 0.109 | 0.007 | -0.102 | 0.0002 | 0.1217 | 0.0178 |
| Df(3R)Cha7 | 4 | 79 | -0.260 | -0.205 | 0.055 | 0.0009 | 0.4323 | 0.1751 |
| Df(3R)Drrv1 | 4 | 79 | 0.034 | 0.300 | 0.266 | <0.0001 | <0.0001 | 0.0020 |
| Df(3L)GN24 | 4 | 75 | -0.218 | -0.262 | -0.044 | <0.0001 | 0.4707 | 0.1298 |
| Df(2R)H3E1 | 4 | 70 | 0.340 | 0.416 | 0.076 | <0.0001 | 0.3688 | 0.8125 |
| Df(3R)crb87-5 | 4 | 62 | 0.042 | 0.147 | 0.105 | 0.1046 | 0.2136 | 0.0999 |
Number of backgrounds tested.
Number of individuals scored.
Difference between mean residual of wild-type/Balancer and wild-type/Deficiency genotypes (* indicates effect in direction opposite to that predicted from original observation of Bloomington stock).
P value associated with F-ratio for effect of genetic backgrounds.
P value associated with F-ratio for effect of genotype (wt or Df chromosome).
P value associated with F-ratio for genotype by background interaction effect.
Furthermore, there may be genetic variation for the response to application of octopamine and nicotine. The effects of the three monoamines were tested at 10 mm concentration. Octopamine was found to induce considerably more activity than dopamine and slightly more activity than serotonin (data not shown). The frequencies of righting, grasping, and grooming were not greatly affected by octopamine, which instead elicits several new responses including walking (generally in a circle), fluttering of the wings, and even flight. Nicotine is “lethal” to beheaded flies (they cease all activity) at 0.5% concentration, consistent with its common usage as an insecticide, but at 0.3% elicits a range of responses similar to octopamine, consistent with its reputation as a stimulant.
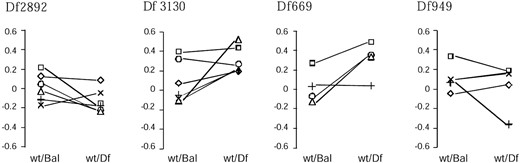
—Crossing of line means among wild-type backgrounds for heart rate between four deficiencies and siblings carrying a common balancer chromosome. Significance values of the background × genotype interaction term are given in Table 2. Each line is represented by a different symbol (⋄, A1; ×, A8; □, A20; +, W6; ○, W11; ▵, W14). For each of the four deficiencies, different wild-type lines are responsible for the interaction effects, suggesting that different segregating alleles contribute to the dominance or epistatic interaction with each deficiency.
Arbitrary scales were developed to characterize the general activity of beheaded flies before and after drug treatment (see legend to Figure 4). The significance of among-line differences is very much a function of the assumptions of the analysis of variance. Ignoring replicate vial effects, that is, pooling activities from six vials into a single class, results in highly significant strain differences. A more appropriate analysis is to use the vial-within-line replication term as the denominator in F-ratio tests. When this is done, among-vial differences for these behavioral traits become marginal or disappear (Table 3). The reasons for this, as shown by leverage plots in Figure 4B, are that a greater proportion of the variation is among vials within lines after application of the drugs and that there is less among-line variation. Since our initial results were performed with isofemale lines, a separate set of 12 near-isogenic wild-type lines generated by 10 generations of repeated sib-pair mating was retested for the response to octopamine: these should have reduced within-line variance relative to isofemales. However, as reported in Table 3 and Figure 4B, the among-vial variance continues to affect the significance of between-line differences. Our scoring scales are not exactly equivalent for overall activity before and after each drug treatment, so it is not formally appropriate to estimate the correlation between scores, but the data suggest that these are somewhat positively correlated. Very large numbers of replicates would be required to establish the significance of genetic differences either in activity after, or in response to, drug application. In contrast to the results of Yellman et al. (1997), no sex specificity was detected for any of the behaviors (except quivering), nor were sex by line interactions detected when vial effects were included in the analysis.
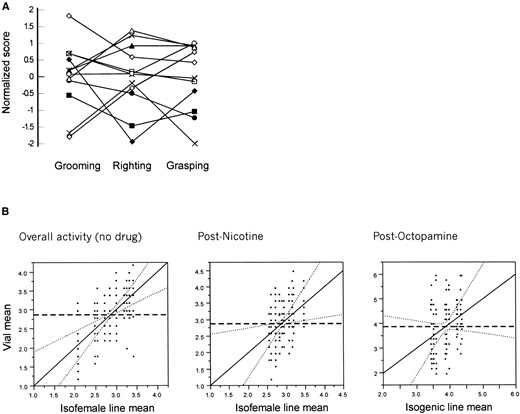
—Range of headless behavior phenotypes. (A) Normalized scores for grooming, righting, and grasping in 12 Kenyan isofemale lines. Grooming and righting were scored as presence/absence. Righting was scored as 0 if flies made no attempt to right, 1 if they waved their legs vigorously but could not right, and 2 if they righted themselves within 5 sec of being turned on their backs. Grand mean for each behavior was subtracted from the mean scores for 60 individuals of each line (10 flies from each of six vials), and this number was divided by the standard deviation of the line means to obtain normalized z-scores. (B) Leverage plots of overall activity scores for headless behaviors without a drug and after application of 0.3% nicotine on the same set of Kenyan isofemale lines and of 10 mm octopamine in a different set of near-isogenic lines. The mean score for each vial is plotted against the line mean across vials with the line of fit for the model on the diagonal and associated 95% confidence limits as dotted curves. The sample mean is indicated by the thick dashed horizontal line. Failure of the confidence limits to cross this line indicates failure to reject the null hypothesis that all of the fly lines have the same mean. Arbitrary scales: no drug: 0, completely inactive or slight twitching; 1, attempted to right only; 2, grasping, grooming, or righting; 3, two or more behaviors; 4, all behaviors. Post-nicotine: 0, inactive; 1, some twitching; 2, infrequent grooming; 3, spins, grooms for several seconds; 4, uncontrolled grooming and/or spinning; 5, hyperactive for more than 10 sec. Note that 0.5% or higher nicotine completely abolishes all activity of beheaded flies.
Analysis of variance of headless behaviors
| Trait | Effecta | Mean square | F | P |
|---|---|---|---|---|
| Hindgrooming | Line | 1.55 | 4.32 | <0.0001 |
| Grasping | Line | 4.11 | 10.12 | <0.0001 |
| Righting | Line | 7.37 | 5.23 | <0.0001 |
| Quivering | Line | 0.31 | 1.66 | 0.1051 |
| Overall activity | Line | 9.34 | 6.36 | <0.0001 |
| Vial(Line) | 1.47 | 2.66 | <0.0001 | |
| Error | 0.55 | |||
| Post-nicotine activity | Line | 4.45 | 1.96 | 0.0487 |
| Vial(Line) | 2.27 | 2.35 | <0.0001 | |
| Error | 0.97 | |||
| Post-octopamine activityb | Line | 6.33 | 0.79 | 0.65 |
| Vial(Line) | 8.08 | 5.81 | <0.0001 | |
| Error | 1.39 |
Degrees of freedom: Line, 11; Vial(Line), 60; Error, 648. For the individual behaviors, vial effects are all highly significant (P < 0.0001).
Post-nicotine activity measured in same near-isofemale lines as for overall activity; post-octopamine activity measured on a different set of 12 isogenic lines.
Interval mapping of QTL for headless behaviors: An alternative method for detecting quantitative trait loci is interval mapping in defined crosses derived from two phenotypically divergent parental lines. We have used this technique to demonstrate the existence of two or three loci that affect each of the four headless behaviors in a set of 74 recombinant inbred lines (RILs) derived by repeated sib-mating from the F2 of a cross between the standard laboratory strain Oregon-R and a Russian strain, 2b (Nuzhdin et al. 1997). This set was initially developed for an unrelated study, without selection for the headless behavior traits, so the RILs are by no means representative of the full range of variation. However, significant among-RIL differences were observed for all four headless behavior traits. Quivering was significantly more frequent in males and hindleg grooming in females, and small but significant sex × RIL interactions were also detected for these two traits. Variance component analysis indicated that the combination of line and sex × line effects accounts for 8% of the phenotypic variance for quivering, 15% for hindleg grooming, 8% for self-righting, and just 1% for grasping.
QTL were mapped with QTL cartographer (Basten et al. 1999) using the previously characterized locations of 94 retrotransposon markers dispersed throughout the genome (Nuzhdin et al. 1997; see materials and methods). For each trait and sex, two or three sharp peaks in the distribution of probabilities of association between genotype and phenotype were observed, and in most cases these exceeded the 5% experiment-wise significance threshold set by 1000 random permutations of the composite multiple regression-interval mapping algorithm for the relevant data set. Likelihood ratios and estimated additive effects in units of the standard deviation among RIL means are presented in Table 4. We also ran QTL analyses on our subjective overall activity measure, but no QTL were detected. Linear multiple regression of the nearest marker genotype for the putative QTL for each trait was then used to confirm the significance of the effect and to test for sex × genotype and genotype × genotype interactions (Model column in Table 4). Despite the failure of some QTL to exceed the significance threshold for each sex considered separately, no sex × genotype interactions were detected. The peak at 87B for quivering was not statistically significant, but is included in Table 4 since a weakly significant synergistic interaction with the QTL at 14C was indicated. Similarly, an antagonistic interaction between marginal QTL near 87B and 60E was suggested for grasping.
The major QTL effects for both sexes combined are shown as leverage plots in Figure 5, which allow visual comparison of residual effects against the main effect of genotype. For example, in Figure 5A, hindleg grooming can be seen to be influenced by two additive loci for which the 2b allele increases the autonomic activity level. Slightly fewer than half of the flies homozygous for Oregon-R alleles near both 3E and 98A groom with their hindlegs, whereas approaching 70% of flies homozygous for both Russian 2b alleles do so, and flies homozygous for the alternate alleles show intermediate activity. (Heterozygous effects are not measured from inbred RILs with this design.) The large residual variance within genotype classes is reflected in the observation that the two-locus model accounts for only 13% of the variance among RIL means. By contrast, a two-locus model (87B and 96A) accounts for 25% of the among-RIL variance for self-righting, and in this case it is the Oregon-R alleles that increase the activity. For grasping, a three-locus model (61A, 65D, and 87B) explains 29% of the variance, but the effect of one QTL (61A) is in the opposite direction to that of the other two loci, and the peak near 65D may represent more than one QTL since it is quite broad and displaced by the equivalent of one cytological band between the two sexes. For quivering, there is low support for either QTL, in part because relatively few lines show the trait at a moderate or high frequency and hence <10% of the variance among lines is explained. The apparent synergistic interaction between the 2b allele near 14C and the Oregon-R allele near 87B is also seen to be due to just two RIL and may thus represent a sampling artifact.
DISCUSSION
Quantitative genetic analysis of behavioral traits in Drosophila: Mindful of the increasing interest in quantitative behavioral genetic research, we present results that encourage further development of D. melanogaster as a model organism in this field. There is clearly extensive genetic variation for two groups of traits that are modulated by neurotransmitters in the fly, namely, heart rate and a group of autonomic behaviors that are exhibited upon beheading. Further, the effects of individual chromosomes can be distinguished readily, and all indications are that it should be possible to perform association tests to characterize quantitative effects of individual nucleotide polymorphisms. At least for a subset of deficiencies, quantitative complementation tests yield significant interaction terms, suggesting that fine structure mapping using overlapping deficiencies can be used to resolve the location of QTL for heart rate to the level of candidate genes (Pasyukova et al. 2000).
However, our results also highlight several reasons for caution in the interpretation of behavioral genetic results. First, the wide range of wild-type phenotypes for both heart rate and headless behavior implies that extreme trait values cannot be attributed to a known mutation present in a stock simply on the basis that the mean trait value of the stock differs significantly from that of one or two common wild-type laboratory stocks. Six of the 11 extreme deficiencies that we retested across a variety of different genetic backgrounds either failed to show a consistent effect on heart rate or in two cases showed an effect in the direction opposite to that detected in the original stock. Consequently, the effects of putative behavioral mutants should be reconfirmed across a range of genetic backgrounds and, where possible, with two or more different mutations generated on different chromosomes. Many intervals of the fly genome are covered by overlapping deficiencies, but it should be borne in mind that the remainder of the chromosome on which these occur may also differ, so the most thorough experimental design will also involve laborious introgression of the deficiencies onto a common chromosomal background.
Second, environmental effects, including differences among vials, can be particularly strong for behavioral traits. This is most apparent for dichotomous traits such as grooming and grasping, for which it is quite common for one or two vials to contradict the trend observed in four or five other vials of the same cross. Such differences occur in stocks reared at constant temperature and humidity and scored at the same time of day and are not obviously related to fluctuation in barometric pressure (results not shown) and so may be indicative of threshold responses to microenvironmental fluctuation. In any case, a consequence is that interpretation of genetic effects is easily skewed by the mode of statistical analysis. The most robust practice is to include vial effects—as well as other sources of environmental variance such as batch effects where replicates are performed at different times—as terms in the analysis of variance.
Third, detection of interaction effects is problematic. Interaction terms are often the most interesting from a quantitative genetic perspective, because they establish the reality of epistatic effects and of “sensitivity” to drugs and other environmental factors. It is tempting to conclude from the observation that a set of lines are statistically similar under one set of circumstances but different under another (say, before and after exposure to a drug) that there is genetic variance for sensitivity to the drug (for example, Andretic et al. 1999). However, that conclusion is not justified in the absence of a more rigorous test for the significance of the genotype by environment interaction term from an analysis of variance. This term is usually highly sensitive to variance among individuals or other levels of replication and tends to have lower power than main effects. The only solution is to score large numbers of flies, but it is worth noting that replication in our data set reduced the significance level of interaction terms on several occasions.
Role of neurotransmitters in behavioral variation: Our screen for haploinsufficient effects on heart rate uncovered nine deficiency-bearing chromosomes that significantly increase or reduce prepupal heart rate across genetic backgrounds. Six of the deficiencies include good candidate genes listed in FlyBase, namely, Synaptobrevin [Df(2R)Stan2], Acer [which encodes a dipeptidase that is expressed in the developing heart, Houard et al. 1998; Df(2L)N2214], hypnos2 [Df(1)C149], and the neurotransmitter receptors GABA-R [Df(3L)29A6], GluRII A,B [Df(2L)clh3, also includes inaB], and DopR2 [Df(3R)Dr-Rrv1]. In addition, seven pairs of overlapping deficiencies have relatively extreme mean heart rates, consistent with the presence of a haploinsufficient gene in the common cytological interval, possibly including hypnos2 [5A, Df(1)JC70 and Df(1)C149], bang senseless [14B, Df(1)sd72b and Df(1)4b18], Synaptobrevin [46F, Df(2R)X1 and Df(2R)Stan2], scarlet [73A, Df(3L)stf13, Df(3L)st7 and Df(3L)81k19], the 5HT1A,B Receptors [56AB, Df(2R)PC29 and Df(2R)P34], DopR2 [99AB, Df(3R) Dr-Rrv1 and Df(3R)01215], and a locus at 33AB [Df(2L)esc10, Df(2L)escP2-0 and Df(2L)escP3-0]. The highest heart rate was recorded for Df(3R)redP93, which deletes the primary DopR at 88B and carries a mutation in the dopamine-metabolizing enzyme encoded by ebony. Extensive quantitative complementation tests with a panel of mutant alleles and/or association studies will be required to confirm that molecular polymorphism in any of these candidate genes contributes to phenotypic variation.
Quantitative trait loci for headless behaviors
| Female | Male | Total | ||||||
|---|---|---|---|---|---|---|---|---|
| Trait (95% LR)a | Interval | LR | Effectb | LR | Effect | LR | Effect | Modelc P value |
| Hindgrooming (14.7) | 3E | 20.4 | -0.48 | n.s. | 11.6 | -0.30 | 0.0002 | |
| 98A | 15.5 | -0.48 | 21.0 | -0.71 | 25.9 | -0.60 | <0.0001 | |
| Quivering (37.0) | 14C | 36.5 | -1.63 | 20.2 | -1.00 | 23.7 | -0.58 | <0.0001 |
| 87B | n.s. | n.s. | 12.5 | 0.20 | 0.0005 | |||
| 14C × 87B | 0.0255 | |||||||
| Grasping (15.8) | 60E | n.s. | 20.9 | -0.67 | n.s. | n.s. | ||
| 61A | 18.6 | -0.42 | n.s. | 23.4 | -0.73 | 0.0016 | ||
| 63-65 | 18.9 | 0.49 | 16.3 | 0.49 | n.s. | 0.0016 | ||
| 87B | n.s. | n.s. | 16.4 | 0.55 | <0.0001 | |||
| 60E × 87B | 0.0065 | |||||||
| Self-righting (14.8) | 87B | 12.8 | 0.37 | 28.0 | 0.83 | 18.4 | 0.44 | <0.0001 |
| 96A | 13.1 | 0.50 | n.s. | 18.9 | 0.51 | 0.0009 | ||
n.s., not significant.
95% significance threshold likelihood ratio (LR) for combined sexes for indicated traits.
Estimated additive effect of QTL as a fraction of the standard deviation among line means.
See text for description of two- or three-locus linear multiple regression model.
Several classes of genes may be predicted to affect heart rate, including mutations of the paralytic class, potassium and calcium channels, various classes of neurotransmitter receptors, and enzymes involved in neurotransmitter metabolism. By chance, most channel genes were not included in the deficiency kit, but previous studies have confirmed that the homologue of the human long-QT syndrome potassium channel gene, eag, is required for normal heart rate (Robbins et al. 1999). There are five clusters of monoamine receptors in D. melanogaster listed in FlyBase, and, intriguingly, all three that are uncovered by deficiencies tested here were associated with unusually high heart rates (5HT1A,B; DopR; and DopR2). Summation of the mean rates for these deficiencies produces a score that is in the top 5% of 10,000 random permutations of summed rates of three randomly selected deficiencies, providing some statistical support (Keightley et al. 1998) for the contention that haploinsufficiency for monoamine receptors increases heart rate.
It is not, though, obvious that this effect is in the expected direction. Mutations in the Ddc gene, which encodes the enzyme that catalyzes the final step in dopamine biosynthesis, seem to reduce prepupal heart rate (Johnson et al. 1997, and our unpublished data) whereas removal of the ebony locus may increase heart rate as a result of increased dopamine pools (Newby and Jackson 1991). Consequently, reduction in the concentration of dopamine receptors ought to reduce the heart rate as well. On the other hand Zornik et al. (1999), in direct contrast to the results of Johnson et al. (1997), have recently shown that injection of dopamine or octopamine into the prepupae can reduce the heart rate. They suggest that physiological responses to neurotransmitters may be a function of which cardiac pacemaker is most affected by the drug. The response also changes according to the developmental stage of the organism.
No firm conclusions about the genetic architecture of autonomic behaviors should be drawn from the QTL mapping based on the relatively small sample of 74 RIL. It is clear that individual gene effects are small relative to environmental sources of variation, yet the analysis does suggest that oligogenic contributions can be measured. It is an open question whether dissection of complex behaviors may benefit from reduction of the overall activity down to subcomponents, such as quivering and grooming, or potentially from physiological properties relating to membrane potentials (Jones et al. 1999). Interestingly, two very promising candidate genes that we have identified lie close to QTL: for quivering, the hypoD/slow receptor potential locus at 14C is known to have an ether-induced leg-shaking phenotype in recessive homozygotes (Homyk and Sheppard 1977), while the gene grooming defective at 3E was identified in a mutagenesis screen for mutations that disrupt the ability of flies to remove a fine dust from their backs (Phillis et al. 1993). During the experiment, we noticed that the flies that groom the most when beheaded tend to come from relatively clean vials. The possibility that a regular behavior such as grooming is genetically correlated with an autonomic activity independent of the brain invites further investigation.
Genetic effects of polymorphisms and mutations affecting neurotransmitter biosynthesis and uptake are likely to be a complex function of numerous parameters. Little is known about the mutational target size for behavioral traits, the distribution and functional significance of molecular variation in neurotransmitter receptors and other behavioral loci, or the degree of epistatic and genotype-by-environment interaction for behavioral traits (Ramos et al. 1999; Vadasz et al. 2000; Vieira et al. 2000). The genetic results reported here are consistent with physiological studies that have established the hypothesis that dopamine, serotonin, and octopamine are important regulators of heart rate and “headless” autonomic behaviors in Drosophila.
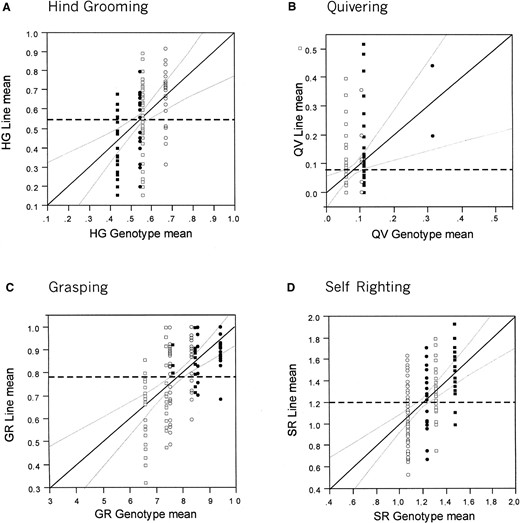
—Leverage plots showing QTL effects for autonomic behaviors. The mean trait value across six replicate vials for each RIL is plotted against the four possible two-locus genotype means for hindleg grooming (HG), quivering (QV), and self-righting (SR), or eight three-locus genotype means for grasping (GR). Line of best fit, confidence intervals, and sample mean as in Figure 4B. Genotypes refer to the nearest markers, 3E and 98A for HG; 87B and 96A for SR; 14C and 87B for QV; 61A and 87B (and 65D not symboled) for GR. For first-named genotype, squares represent the Oregon-R allele and circles the 2b allele; for the second-named genotype, the Oregon-R allele is solid and the 2b allele open.
Acknowledgement
We gratefully acknowledge the assistance of Amanda Moehring, Salam Bidwan, Radhika Aggarwal, and Elizabeth Sall at various stages of the experiments, and Trudy Mackay and members of her group for helpful discussion and for supplying the deficiency kit. This work was supported by grants to G.G. from the North Carolina Affiliate of the American Heart Association (B98418N) and the David and Lucille Packard Foundation. R.C. was supported by the W. M. Keck Program in Behavioral Biology at North Carolina State University.
Footnotes
Communicating editor: M. W. Feldman
LITERATURE CITED
