


Abstract
Recent breakthroughs in molecular technology, most significantly the polymerase chain reaction (PCR) and in situ hybridization, have allowed the detection of genetic variation in bacterial communities without prior cultivation. These methods often produce data in the form of the presence or absence of alleles or genotypes, however, rather than counts of alleles. Using relative allele frequencies from presence-absence data as estimates of population allele frequencies tends to underestimate the frequencies of common alleles and overestimate those of rare ones, potentially biasing the results of a test of neutrality in favor of balancing selection. In this study, a maximum-likelihood estimator (MLE) of bacterial allele frequencies designed for use with presence-absence data is derived using an explicit stochastic model of the host infection (or bacterial sampling) process. The performance of the MLE is evaluated using computer simulation and a method is presented for evaluating the fit of estimated allele frequencies to the neutral infinite alleles model (IAM). The methods are applied to estimate allele frequencies at two outer surface protein loci (ospA and ospC) of the Lyme disease spirochete, Borrelia burgdorferi, infecting local populations of deer ticks (Ixodes scapularis) and to test the fit to a neutral IAM.
EXTENSIVE variations in allele frequencies and molecular (DNA and protein) sequence polymorphisms pervade the majority of natural populations. Although genetic variation at its ultimate level can now be quickly and accurately resolved by DNA sequencing, much of our ecological and evolutionary understanding of natural populations continues to be based on the results of allele frequency analyses. Strong natural selection, for example, can distort the allele frequency distribution at a locus resulting in departures from Hardy-Weinberg equilibrium and from the Ewens sampling distribution (Ewens 1972; Manly 1985), which describes the samples of alleles expected when mutations follow an infinitely many neutral alleles model (IAM). Classical tests of neutrality such as the Ewens-Watterson test have increased our understanding of the patterns of selection among regions of the genome and among populations.
Methods of allele frequency analysis developed for use in studies of animal and plant populations are, in principle, applicable to bacterial species as well. Unlike animal or plant populations, however, it has only recently become technically feasible to perform in situ sampling to examine the genetic variability of bacteria in their natural (uncultivated) environment. Classical studies of bacterial population genetics (see review by Selander et al. 1994) have therefore focused on a few model organisms that can be readily cultured. It is well known that most (90% or more) of the genetic diversity within bacterial communities is lost through cultivation, however, and nutrient enrichment methods are highly selective for the growth of only a small number of species (or genotypes of a species; see Table 1 in Amann et al. 1995).
With the advent of new molecular techniques, such as PCR and in situ hybridization (Amann et al. 1995; von Wintzingerode et al. 1997), a previously unknown level of microbial diversity has been uncovered in environmental and clinical microflora that challenges traditional views on microbial ecology and pathogenicity (see recent reviews by Hugenholtz et al. 1998; Relman 1999). Using molecular typing methods it is now also possible to survey the genetic variation of a bacterial species in its natural environment. Thus far, however, formal statistical methods have been lacking for estimating allele frequencies using the kinds of data obtained in studies of microbial diversity by molecular methods. In this article, we attempt to redress this problem by developing some new statistical methods for analyzing these emerging data.
In recent population genetic studies of Borrelia burgdorferi, the spirochete that causes Lyme disease, Borrelia genes were directly amplified from infected ticks (Ixodes scapularis) using a nested PCR design (Guttman et al. 1996). The amplified genes were subsequently surveyed for sequence variations using cold single-strand conformation polymorphism (SSCP) and individual ticks were commonly found to be infected with multiple strains of Borrelia (Guttman et al. 1996; Qiu et al. 1997; Wang et al. 1999). In this work, the number of bands of alleles was counted directly from electrophoretic gels to estimate the frequencies of various SSCP alleles in a local Borrelia population (Qiu et al. 1997; Wang 1999). This method of direct counting can produce biased estimates of the population allele frequencies, however, tending to underestimate the frequencies of common alleles and to overestimate those of rare alleles. The result is an inferred frequency distribution that appears more even than the actual frequency distribution (see Methods and Materials in Qiu et al. 1997).
In this study, bacterial allele frequencies are estimated more accurately by deriving an explicit maximum-likelihood estimator (MLE) that takes account of the transmission process of bacteria to hosts and the host sampling process. Our approach was to formulate the sampling distribution of the presence-absence data as a function of the population allele frequencies. Allele frequencies could then be estimated directly using analytical maximum-likelihood techniques. The method should be generally applicable to problems involving the estimation of population allele frequencies from presence-absence data; such data sets are becoming increasingly common, particularly in studies of bacterial genetic diversity using molecular techniques. If one is studying gene frequencies in populations of free-living microbes, rather than parasitic ones, the model can still be used but is instead a model of the microbial substrate sampling process. For example, samples of equal amounts of soil might be collected from different regions and the microbes in each sample genetically characterized; in this case, the samples are equivalent to hosts and the number of infecting microbes is the population of bacteria in each sample.
THEORY
MONTE CARLO SIMULATION STUDY
Monte Carlo simulations were used to examine the bias and variance of the maximum-likelihood estimators of λ and p. From a hypothetical population of bacteria with k different alleles (frequencies of which are p1, p2, …, pk, respectively), we simulated the sampling of n infected hosts. The number of bacterial lineages infecting each host is assumed to be Poisson distributed with a mean of λ and the observations are the presence and absence of individual alleles in each infected host. From these n independent simulated host samples, MLEs of the bacterial population allele frequencies, p, and λ, were calculated using Equations 11 and 12. The process of sampling n infected hosts from the bacterial population was simulated 1000 times and the bias and variance were calculated for each estimator.
The results shown in Figure 1 are based on simulated samples from a hypothetical bacterial population with k = 3 distinct alleles with sample sizes of n = 100, 500, 1000, and 5000 simulated infected hosts. Deviations (in percentage) of the estimated values of the allele frequencies from their actual values (the bias; Figure 1, A and B) and the variance of the estimated allele frequencies (Figure 1, C and D) are plotted against actual frequency of one of the alleles (frequencies of the remaining two alleles are kept equal). It can be seen from Figure 1, A and B, that the relative bias of the estimated allele frequencies falls between −15 and +10% under the various ranges of allele frequencies and λ values examined. The accuracy of the gene frequency estimates is improved by increasing the sample size, n, when λ is large relative to the number of alleles (Figure 1B). However, when λ is small (e.g., λ = 2), the accuracy is not improved by sampling more hosts (Figure 1A). As expected, the variance of all estimates is reduced when the sample size is increased (e.g., Figure 1, C and D).
The evenness of the gene frequency distribution has a strong effect on the bias and variance of the allele frequency estimates. The best estimates (meaning those with smallest bias and variance) of allele frequencies are achieved when the actual allele frequencies are evenly distributed, even when the sample size is small (see Figure 1, A and B, at the point p = 0.3333, where the distribution is even). Estimates of λ (the average number of bacterial lineages infecting a host) are more biased and have higher variance than estimates of allele frequencies, especially when λ is small. For example, the method overestimates λ regardless of sample size, n, and the shape of gene frequency distribution, p, when the true value of λ is 2.0 (the estimates ranged from 2.5 to 3.6, data not shown).
EXAMPLE: LYME DISEASE
We have applied the method to two published studies of local populations of B. burgdorferi, the bacterial agent of Lyme disease. Lyme disease is transmitted mainly by Ixodes ticks and is the most prevalent vector-borne disease in the United States (CDC 1997). In endemic regions of Lyme disease, the ticks, vertebrate hosts, and patients are often infected with multiple genospecies or strains of B. burgdorferi (Demaerschalck et al. 1995; Pichon et al. 1995; Guttman et al. 1996). Population genetic analyses of B. burgdorferi suggested that the high level of local genetic diversity observed in this species may be maintained by frequency-dependent selection mediated by host immune responses to spirochete infection (Qiu et al. 1997; Wang et al. 1999). One piece of evidence for diversifying selection came from the consistently significant results of Ewens-Watterson tests of frequency distributions of SSCP alleles sampled from local populations of B. burgdorferi (Qiu et al. 1997; Wang et al. 1999).
In light of our study, the method of gene frequency estimation used in previous studies of Borrelia needs to be reevaluated. This is because in the earlier studies frequencies of SSCP alleles were estimated by directly counting the number of bands (distinctive for each allele) observed on electrophoresis gels. Since the presence of a pair of SSCP bands on a gel indicates the presence of a particular allele in a tick regardless of the actual number of microbes infecting the tick, the direct counting method tends to underestimate the frequencies
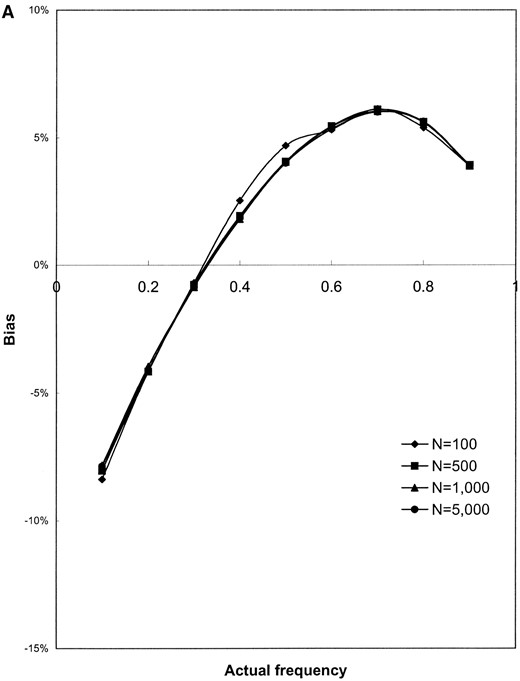
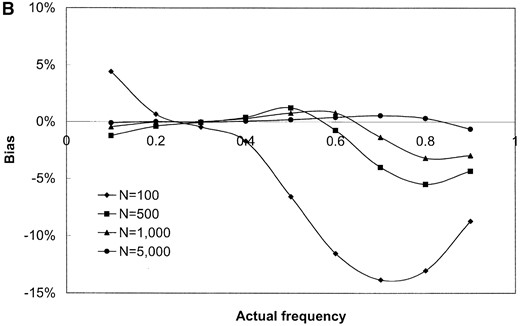
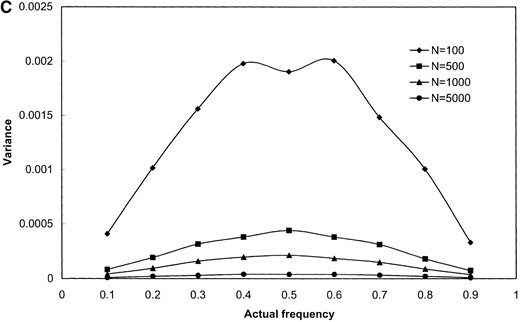
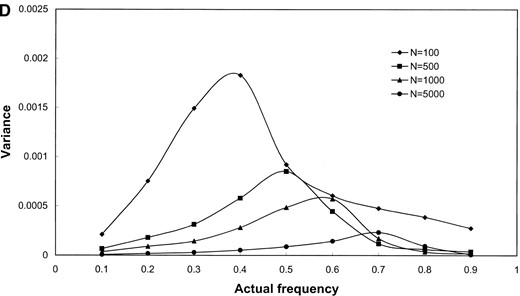
Results of simulation study of the performance of maximum-likelihood estimators of gene frequencies (p) and number of infecting bacteria (λ). A hypothetical microbial population with k = 3 distinct alleles infecting a host population was simulated. The frequency of one allele (p1) was successively set to be 0.1, 0.2, …, 0.9 while frequencies of the remaining two alleles (p2 and p3) were kept equal (these frequencies sum to unity). Samples of infected hosts of size N = 100, 500, 1000, and 5000 were simulated and the frequency of each allele was estimated using Equations 13 and 14. The bias of () and the variance of were obtained from 1000 replicate simulations of the sampling process. The standardized bias of was calculated using the formula , where p1 is the (known) true value of p1 used in the simulations (A and B). As well, the variance of was calculated for the simulated data sets (C and D) and these values are plotted against p1. The individual parts are the bias of (A and B) and variance of (C and D) when the average number of microbial lineages infecting hosts is either low (λ = 2, A and C) or high (λ = 10, B and D).
of common alleles and overestimate those of rare ones. Allele frequencies estimated by using the direct counting method would thus tend to appear more uniform (having lower values of homozygosity, F) and would bias the results of the Ewens-Watterson test in favor of balancing selection.
Molecular data from surveys of two local populations of B. burgdorferi (Qiu et al. 1997; Wang et al. 1999) are reproduced in Table 1 and allele frequencies on two outer surface protein loci were reestimated using the maximum-likelihood method. It can be seen that in each population the corrected frequencies are less evenly distributed than the uncorrected ones (Table 1). Nonetheless, the allele frequency distributions in both populations are still more even than expected under a neutral evolutionary model (compare the first and second columns of the histograms shown in Figure 2). A more uniform frequency distribution than expected under neutrality can be due to either evolutionary factors like balancing selection (Qiu et al. 1997; Wang et al. 1999) or recent population growth. To construct the expected frequencies under neutrality that are given in the second column of the histograms of Figure 2, the population parameter θ = 2Neμ was estimated as described above using n as the approximate sample size. Estimates of θ obtained in this way were quite large for both loci examined, θ = 0.43 for ospA and θ = 2.48 for ospC. If we assume that the mutation rate is on the order of μ ≈ 10−8, this suggests that the corresponding estimates of the effective population size will be 1.2 − 108 and 2.2 − 107, respectively. Either a large population of hosts or potential subdivision of bacterial populations among hosts (and regions) could account for this large effective population size.
One possible source of error for estimates of θ are the estimates of λ used in the calculation; these might be too large due to the upward bias of the MLE of λ. To investigate whether such bias could account for the deviation of estimated bacterial gene frequencies from those expected under neutrality, we also calculated the expected frequencies using estimates of λ that were one-fifth as large as the MLEs. These expected frequencies are shown in the third column of Figure 2 and remain very different from the observed frequencies (column 1). These results suggest that the deviation of gene frequencies from the neutral expectation that we observed are not an artifact of bias in estimates of θ.
DISCUSSION
In this study, a maximum-likelihood method for estimating gene frequencies in a bacterial population based on the presence and absence of alleles in infected hosts is developed. The method is particularly useful for application to the data generated by the increasingly common studies of bacterial populations that use non-culture-based molecular detection techniques. Additionally, a graphical method based on the neutral distribution of allele frequencies has been developed to test for the presence of natural selection (or a recent population
Estimated allele frequency distributions of outer surface protein (Osp) alleles of B. burgdorferi
| Maximum-likelihood estimates | |||||||
|---|---|---|---|---|---|---|---|
| Population | Gene locus (allele type) | Allele | Total no. of infected ticks (n) | No. of ticks infected with jth allele (zj) | Uncorrected estimates | Allele frequencies [pj, SE(pj)] | Average no. of bacterial lineages per host [λ SE(λ) ] |
| Adult 95 and 96a | ospA (four mobility classes) | 1 | 367 | 46 | 0.11 | 0.09 (0.01) | 1.496 (0.005) |
| 2 | 166 | 0.37 | 0.40 (0.02) | ||||
| 3 | 112 | 0.25 | 0.24 (0.02) | ||||
| 4 | 120 | 0.27 | 0.27 (0.02) | ||||
| SI94b | ospC (11 major groups) | A | 40 | 12 | 0.16 | 0.17 (0.04) | 2.09 (0.05) |
| B | 12 | 0.16 | 0.17 (0.04) | ||||
| C | 11 | 0.15 | 0.16 (0.04) | ||||
| D | 9 | 0.12 | 0.12 (0.04) | ||||
| E | 4 | 0.05 | 0.05 (0.02) | ||||
| F | 6 | 0.08 | 0.08 (0.03) | ||||
| G | 5 | 0.07 | 0.06 (0.03) | ||||
| H | 7 | 0.10 | 0.09 (0.03) | ||||
| I | 1 | 0.01 | 0.01 (0.03) | ||||
| J | 2 | 0.03 | 0.03 (0.01) | ||||
| K | 5 | 0.07 | 0.06 (0.02) | ||||
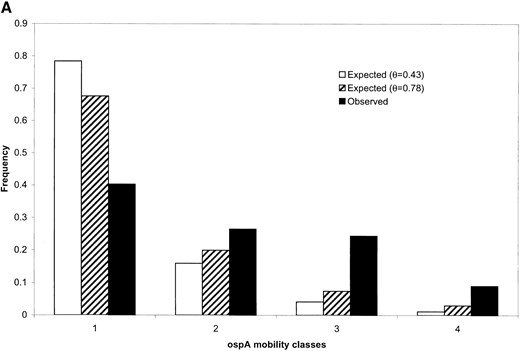
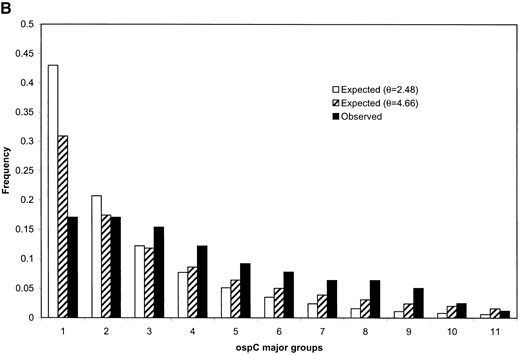
Comparison of estimated allele frequencies with the expected frequencies under neutrality for outer surface protein (osp) alleles in natural populations of B. burgdorferi. (A) Frequencies of four SSCP mobility classes of ospA in a population of 367 infected adult I. scapularis ticks. The maximum-likelihood estimate of the average number of bacterial lineages infecting a tick, , is ~1.50, which gives a total sample size of 549 ospA lineages. was obtained using Equation 13 on the basis of either the estimate (in which case ) or one-fifth the value of (in which case ). Expected allele frequencies under neutrality in both cases were obtained using Equation 15. (B) Frequencies of 11 major groups of alleles at ospC in a population of 40 infected ticks. For these data, the estimate of λ is , which gives an estimate of the sample size to be 84 ospC lineages. Using this estimate of , the estimate of θ was . If instead a value of 1/5 was used, we obtained . Expected allele frequencies under neutrality in both cases were obtained using Equation 15.
expansion), using bacterial gene frequencies. This method provides a test of neutrality for bacterial genes assayed using SSCP that is analogous to the classical test based on the Ewens (1972) sampling distribution. Both tests are sensitive to recent population expansions, which can cause a rejection of the neutral hypothesis even in the absence of selection.
Model of microbial sampling: The basic probability model that we have developed (and used to derive our estimators) in this article assumes that hosts are collected and examined for the presence (or absence) of microbes carrying particular alleles. Implicit in the model is an assumption that hosts are infected, at random, from a “source” population of microbes. Our methods estimate the allele frequencies in this source population from which microbes are sampled during the host infection process. In the case of B. burgdorferi, the source population is the population of microbes infecting the definitive (vertebrate) hosts. For other microbes, the source population about which inferences are being made will differ. For example, if one is instead studying populations of free-living soil bacteria (rather than a parasite), collects n independent soil samples of equal mass (rather than n hosts), and then determines the alleles present in each sample, an application of our method will provide estimates of the allele frequencies for the population of soil microbes over the entire region of sampling. Our model also assumes that no mutations occur within the sampled hosts; this assumption is reasonable for short-lived hosts harboring small populations of bacteria (< ~106 bacteria per host). Finally, the model assumes that there is no loss of bacterial lineages (due to genetic drift, for example) within hosts following infection. If these assumptions are satisfied, it is not necessary to explicitly model the within-host population dynamics. The approach could be extended to allow more complex within-host microbial dynamics, mutation, and drift.
Prospects for new statistical methods: The methods developed in this article represent a reasonable first solution to this problem. The maximum-likelihood method that we have used to estimate allele frequencies has some potential disadvantages, however. The most significant disadvantage of the likelihood approach is that it provides only point estimates of the allele frequencies. Often estimated allele frequencies will subsequently be used to test other hypotheses (in this study, for example, we used them to test for neutrality of alleles). A technically superior approach would be to calculate the Bayesian posterior probability density of the allele frequencies (see, for example, Rannala and Mountain 1997). This posterior density could then be used in subsequent hypothesis tests involving the allele frequencies and would take account of the fact that the allele frequencies are uncertain (they have been estimated from the data). A numerical Bayesian approach (using Markov chain Monte Carlo methods, for example) would also allow the method to be more easily extended to allow for increasingly complex models of the host infection process, etc.
Bacterial clonality: Bacteria are asexually reproducing organisms and the rate of recombination between genotypes is much lower than in sexually reproducing organisms. One consequence of an asexual mode of reproduction and clonal population structure is that bacterial genotypes or strains are relatively stable genetic identities (for recent reviews of bacterial clonality see Selander et al. 1994; Maynard Smith 1995; Guttman 1997). Population genetic (evolutionary) processes (e.g., genetic drift and natural selection) in bacterial species are thus best described using units of individual bacterial lineages rather than the individual cells constituting a bacterial population. A bacterial lineage is defined here as bacterial cells asexually propagated (e.g., by binary fission) from a single ancestral bacterial cell. Different bacterial lineages, like different individuals in plant or animal populations, can be of the same as well as of different genotypes or strains. Therefore, individual cells in a bacterial population are best considered to be a mixture of genotypically identical (or different) lineages rather than individual organisms as in an animal or plant population.
Our analysis of B. burgdorferi supports the idea that the number of bacterial lineages infecting a host is usually small. Presumably this is because the hosts are often initially infected with a small number of bacterial cells and an even smaller number of bacterial lineages. For example, the average number of Borrelia lineages infecting a tick (i.e., the parameter λ) was estimated to be ~1.5 as determined by ospA SSCP types in one population and 2.1 as determined by ospC SSCP types in another population (Table 1). These low estimates of the number of infecting lineages lend support to the clonal view of bacterial population genetics outlined above.
A second important consequence of bacterial clonality is the high degree of linkage disequilibrium that exists among various loci (Dykhuizen and Green 1991). As a result of linkage disequilibrium, natural selection at one locus can have a genome-wide effect, causing population genetic dynamics such as selective sweeps (Cohan 1994). For highly clonal bacterial species such as B. burgdorferi (Dykhuizen et al. 1993), it is therefore not surprising that balancing selection appears to manifest itself at multiple loci (e.g., ospA and ospC; see Wang et al. 1999). A test of neutrality applied to one gene, therefore, can potentially detect selection acting anywhere in the bacterial genome.
To summarize, population genetic studies of bacterial species differ from those of plant or animal species in at least two important aspects. First, gene frequencies in a bacterial population most accurately reflect the relative abundance of bacterial strains existing in a population; they are poorer measures of relative frequencies of individual bacterial cells that differ in their genotypes. Second, the genome-wide population genetic dynamics of bacterial species can often be approximated by population genetic dynamics at a single locus (e.g., changes of allele frequencies due to natural selection) due to the extensive linkage disequilibrium among loci across the bacterial genome.
In situ quantitative methods: Over the past decade, various molecular methods aimed at quantifying in situ cellular abundance of bacteria (such as quantitative PCR and quantitative hybridization) have been developed (Orlando et al. 1998). Because these techniques can directly quantify the number of gene copies in biological samples, it is tempting to use molecular quantitative techniques to estimate gene frequencies in bacterial populations experimentally. However, as discussed above, the total number of cells that make up each bacterial strain in a population may not be as relevant a population genetic parameter as the number of independent bacterial lineages that infect a host. It is therefore neither necessary nor proper to estimate bacterial gene frequencies from, for example, the number of gene copies giving rise to the individual SSCP bands, using molecular quantification methods. Using the present methods for estimating gene frequencies in bacterial populations, it is only necessary to obtain information on the presence and absence of alleles in infected hosts using the much simpler qualitative molecular detection techniques. Apart from these theoretical considerations, molecular quantitative methods also suffer from experimental complications such as preferential primer or probe annealing to templates of certain haplotype sequences, natural variations in DNA or RNA copy numbers in a genome, and formation of chimera molecules in PCR amplifications (Amann et al. 1995; von Wintzingerode et al. 1997).
Effects of sample size and interaction among genotypes: The results of our Monte Carlo computer simulations suggest that the accuracy and variance of maximum-likelihood estimates are influenced mainly by two factors: the sample size, n, and the average number of lineages infecting a host, λ. Increasing the sample size generally improves the accuracy and reduces the variance of the maximum-likelihood estimates. However, when hosts are infected by a small number of bacterial lineages, the accuracy of gene frequency estimates is relatively insensitive to changes in sample size (Figure 1A). In the Borrelia example, estimates of the number of ospA and ospC SSCP lineages in infected ticks are both found to be low (1.5 and 2.1, respectively). In this case, the gene frequency estimates tend to be very reliable even if sample sizes are small (see standard errors in Table 1). However, caution should be used in interpreting the estimated values of λ because simulations suggest that these may overestimate the true values by as much as 80%. It is also important to note that the maximum-likelihood method presented in this article is based on the assumption that infection of hosts by bacterial lineages is a Poisson process (see theory) and that there are no interactions (e.g., attraction or repulsion) among coexisting strains in a host. The use of these methods may not be justified when nonrandom associations are found among different bacterial strains or species.
Program availability: The program BFREQ (written in C++) is available to estimate allele frequencies and perform the Monte Carlo simulations described in this article. A Mathematica (version 2.2, Wolfram 1992) package is also available for calculating expected allele frequencies under neutrality based on the Poisson-Dirichlet distribution (Griffiths 1979) and for estimating the parameter θ by solving Equation 13. The computer programs can be obtained from http://allele.bio.sunysb.edu.
Acknowlegement
The authors benefited from discussions with Ing-Nang Wang and suggestions from Simon Tavaré. This study was supported by a grant from the National Institute of Allergy and Infectious Diseases (RO1AI33454) to Dr. Benjamin J. Luft of Department of Medicine, State University of New York at Stony Brook and by cooperative agreement number U50/CCU206608 and U50/CCU210518 from the Centers for Disease Control and Prevention to Dr. Benjamin J. Luft and Dr. Edward M. Bosler of Department of Medicine, State University of New York at Stony Brook, respectively. B. Rannala was supported by National Institutes of Health Grant HG-01988-01. This is contribution 1063 from Graduate Studies in Ecology and Evolution, State University of New York at Stony Brook.
Footnotes
Communicating editor: A. G. Clark
LITERATURE CITED
