


Abstract
In plants with a gametophytic self-incompatibility system the specificity of the pollen is determined by the haploid genotype at the self-incompatibility (S) locus. In certain crosses this can lead to the exclusion of half the gametes from the male parent carrying a particular S-allele. This leads to pronounced segregation distortion for any genetic markers that are linked to the S-locus. We have used this approach to identify T-DNA insertions carrying a maize transposable element that are linked to the S-locus of Petunia hybrida. A total of 83 T-DNA insertions were tested for segregation distortion of the selectable marker used during transformation with Agrobacterium. Segregation distortion was observed for 12 T-DNA insertions and at least 8 of these were shown to be in the same linkage group by intercrossing. This indicates that differential transmission of a single locus (S) is probably responsible for all of these examples of T-DNA segregation distortion. The identification of selectable markers in coupling with a functional S-allele will allow the preselection of recombination events around the S-locus in petunia. Our approach provides a general method for identifying transgenes that are linked to gametophytic self-incompatibility loci and provides an opportunity for transposon tagging of the petunia S-locus.
SELF-incompatibility is a genetic mechanism used by hermaphrodite plants to prevent self-fertilization and to promote outbreeding. Self-pollen is recognized by the pistil and is rejected whereas cross-pollen is accepted, provided it has a distinct pollen specificity. Gametophytic self-incompatibility is the most taxonomically widespread system whereby the specificity is determined by the haploid genotype of the male gametophyte. The specificity can be controlled by two or more loci, but for obvious reasons much research has focused on the simpler single-locus systems typified by the Solanaceae (Dodds et al. 1996). In the Solanaceae the pistil specificity function of the S-locus is encoded by an adundant glycoprotein with ribonuclease activity (S-RNase) but the pollen specificity (pollen-S) is probably encoded by a distinct gene at the same locus (Lee et al. 1994). The presence of many functionally distinct alleles of the S-locus in natural populations ensures that even for single-locus systems most cross-pollinations are successful (Richman and Kohn 1996).
The gametophytic control of pollen specificity allows for three possible outcomes from a cross-pollination. When both S-alleles in the pollen are matched by those in the pistil, all pollen is rejected (fully incompatible). When neither S-allele in the pollen is matched by those in the pistil, all pollen is accepted (fully compatible). However, when only one S-allele in the pollen is shared with those in the pistil, only half of the pollen is rejected (semicompatible). The semicompatible pollination is a unique feature of the gametophytically controlled incompatibility system that cannot occur in sporophytically controlled systems where all pollen from a self-incompatible plant must by definition carry the same S-specificity (Thompson and Taylor 1965).
The ability of the gametophytic self-incompatibility system to exclude all gametes carrying a specific S-allele from a pollen donor provides a method of detecting the S-locus by segregation distortion of linked markers. This method was used in early studies with flower pigmentation mutants in Nicotiana (Brieger and Mangelsdorf 1926) and a flower morphology mutant in Antirrhinum (Breiger 1935). The development of isozyme analysis allowed additional examples of S-linked markers to be identified in the Solanaceae (Labroche et al. 1983; Tanksley and Loaiza-Figueroa 1985). The extent of distortion can be used to provide reliable estimates of linkage distance and variance (Simmonds 1966; Leach 1988).
The selectable markers used for plant transformation with Agrobacterium (e.g., antibiotic resistance) provide a convenient source of dominant markers for segregation analysis. This has allowed a large number of T-DNA integration sites to be mapped with respect to phenotypic markers in Petunia hybrida (Wallroth et al. 1986; Robbins et al. 1995) and Arabidopsis (Van Lisjebettens et al. 1996). We have combined this technique with the unique aspects of a semicompatible mating to test a total of 83 T-DNA inserts for segregation distortion in P. hybrida. The T-DNA inserts carry the maize-defective transposable element Dissociation and can be used for heterologous transposon tagging, an established method of gene isolation in P. hybrida (Chuck et al. 1993). Marked distortion was observed for 12 T-DNA inserts and at least 8 of these are in the same linkage group based on intercrossing. This indicates that the S-locus is responsible for most, if not all, of the segregation distortions observed. Those T-DNA insertions that are closely linked to a functional S-locus offer the potential for heterologous transposon tagging of self-incompatibility factors including pollen-S.
MATERIALS AND METHODS
Genetic stocks: The V13 and V26 stocks of P. hybrida used in this study were provided by Dr. R. Koes from the inbred line collections at the Free University of Amsterdam. The self-incompatible V13 stock derives from P. hybrida var pendula cyanea and the self-compatible V26 stock derives from a commercial variety called Blue Jay. Both lines have been maintained by selfing for many generations and the self-incompatibility of V13 arose relatively recently, possibly as a result of inbreeding. The V13 stock was assigned a genotype SV SV, and the V26 stock was SC SC (see results). The functional Sb and S3 alleles were provided as heterozygous stocks by W. Broothaerts (University of Leuven). The Sb allele was extracted from a commercial seed sample of P. hybrida var pendula (Broothaerts et al. 1991) and the S3 allele was characterized originally by H. Linskens at the University of Nijmegen.
Pollinations: Self- or cross-pollinations to establish incompatibility were carried out on at least five flowers per plant. The resulting fruits were scored 2–3 wk following pollination and were compared with compatible cross-pollinations. Occasionally, pollinations resulted in capsules that were of intermediate size between compatible and incompatible. This may be a result of pseudo-self-compatibility that has been observed previously in P. hybrida (Ascher 1984). The self-compatible stock V26 sets abundant seed reliably upon self-pollination but the self-incompatible stock V13 sets very little seed, typically 2–4 small capsules/100 pollinations. Plants were grown at 20° with supplementary lighting (16 hr) during winter months.
Genomic DNA extraction and hybridization: Petunia genomic DNA was extracted from leaves using a CTAB (cetyltrimethylammonium bromide) extraction method (Dooner et al. 1991) with the following modifications. After isopropanol precipitation a second chloroform extraction was performed. This was followed by a 2.5 m ammonium acetate precipitation on ice. The supernatant was then precipitated again with isopropanol and washed with 70% ethanol. Approximately 5 μg of digested genomic DNA was fractionated in 0.8% agarose and transferred to Duralon-UV (Stratagene, La Jolla, CA). The filters were hybridized with a purified plasmid insert labeled with [32P]dCTP using a random-prime labeling kit (Pharmacia, Piscataway, NJ). The heterologous probes were hybridized and washed at 65° at a low stringency (3× SSC).
Derivation of S-linked marker CP100: Selected S-linked RFLP probes from Solanum tuberosum were provided by C. Gebhardt (Max Planck Institute, Cologne) and were tested for hybridization to P. hybrida genomic blots. Of six probes tested (CP45, CP46, CP100, CP108, GP184, and GP206) only two (CP100 and GP184) hybridized well with P. hybrida DNA (R. M. Harbord and T. P. Robbins, unpublished results). The CP100 probe detects an XbaI RFLP between stocks carrying S3 and Sb alleles. The segregation of these CP100 alleles was determined for 48 individuals resulting from the cross S3 Sb × SV SV. All 48 individuals showed a perfect correlation between the S phenotype determined by test pollination with an S3 SV stock (23 S3 SV: 25 Sb SV) and the CP100 genotype determined by RFLP analysis (data not shown). This indicates that the CP100 marker is tightly linked to the S-locus of P. hybrida with 0/48 recombinants (< 2cM).
Plant transformations: The binary vector pSLJ2064 (Scofield et al. 1994) carries a neomycin phosphotransferase (NPT) coding region with a CaMV 35S promoter and an octopine synthase 3′ end that confers resistance in planta to the antibiotic kanamycin. In addition the construct carries a maize Ds transposable element inserted in a spectinomycin adenyltransferase (aadA) gene that confers resistance to spectinomycin in tobacco and tomato (Jones et al. 1993). The binary vector pSLJ5088 (V. Klimyuk and J. D. G. Jones, unpublished results) carries the same NPT selectable marker and aadA gene but with a modified Ds element that carries a hygromycin phosphotransferase (HPT) gene. Transformations of inbred line V26 were carried out using Agrobacterium strain LBA4404 as described by Jorgensen et al. (1996). Primary transformants were confirmed using a leaf callus assay on Murashige and Skoog (MS) medium supplemented with 0.5 μm (final concentration) each of indole acetic acid and benzylamino purine, plus 200 μg/ml carbenicillin and 100 μg/ml kanamycin. Transformation of the self-incompatible line V13 was carried out using the same procedure although the efficiency was significantly less than for V26 (A. Tang and C. A. Napoli, R. M. Harbord and T. P. Robbins, unpublished results).
Seedling NPT assays: Transgenic seed was surface sterilized for 20 min with 10% commercial bleach containing detergent and was rinsed at least five times with sterile water before drying in a laminar flow hood. Sterile seed were sprinkled onto petri plates containing basal MS medium, pH 5.8, 0.8% agar, 3% sucrose, and 200 μg/ml kanamycin sulfate (Sigma, St. Louis). Plates were incubated at 24° with illumination for 2 wk prior to scoring. Seedlings resistant to kanamycin (producing at least two true leaves) were removed and plates were resealed. A final score of resistant seedlings and those sensitive to kanamycin (bleached cotyledons and no true leaves) was made after 4 wk. Kanamycin-resistant selections were transferred directly to compost (Levington F1) for establishment in the glasshouse, and were grown at 20°.
RESULTS
Characterization of S-alleles in P. hybrida stocks: Two inbred stocks of P. hybrida were used primarily in this study, one self-compatible (V26) and the other self-incompatible (V13). The V26 stock was more readily transformed than V13 and consequently more T-DNA insertions were available in a self-compatible background. The self-compatible stock was assumed to be homozygous for a nonfunctional S-allele, termed SC for self-compatible. The SC-allele is probably not a null allele for pistil function as an S-RNase transcript has been identified (T. P. Robbins, unpublished results). The
![Results of backcrossing a V13 × V26 F1 hybrid with V13 as male or female. V26 and V13 inbred lines were crossed, and the resulting F1 was found to be self-compatible. Phenotypes are indicated in brackets: [SI], self-incompatible; [SC], self-compatible. The resulting F1 was backcrossed to V13 either as the male (BCa) or the female (BCb) by early bud pollination (mature F1 pistils rejected the pollen of V13). The phenotypes of the resulting backcross progeny are indicated. The genotypes at the S-locus are indicated in parentheses where SV is the functional S-allele of V13 and SC is the nonfunctional S-allele of V26. The genotypes of backcross progeny were determined using an S-linked RFLP marker (see text for details).](https://oup.silverchair-cdn.com/oup/backfile/Content_public/Journal/genetics/154/3/10.1093_genetics_154.3.1323/2/m_gen8606.f1.jpeg?Expires=1716316192&Signature=x-sSDZuR7Q14Jw9UF96nf7HRDksToHX8ywkDbP2ZbU-1GgS-xjtQkOuAzH7y2NZX5ZPj5ln5HTlUCb7VgcypGQTzZ8RmHFv9wquQMFtg30P4LJ1tup46kSMPFW7MGzEdCJR3CMcKdkWHGIskA6Vi3eZaT-svs1tdRaSIyhqNL1jPhrbQqUhtzQ4knPSo7zUGjJqrAuTJZSRm-agu1eFdePHLtMl2b1PYv0tuCzN8r9FG6rmr~Dw78tddXOAi4pnh2z5DFoa23d-6ilpKux0GXq5RVAaH-MXXxbLNJl8IH9WJ6GsFFZQmSALOWil0MF3VZ-aKh50Q6nJxNTK7DKszSQ__&Key-Pair-Id=APKAIE5G5CRDK6RD3PGA)
Results of backcrossing a V13 × V26 F1 hybrid with V13 as male or female. V26 and V13 inbred lines were crossed, and the resulting F1 was found to be self-compatible. Phenotypes are indicated in brackets: [SI], self-incompatible; [SC], self-compatible. The resulting F1 was backcrossed to V13 either as the male (BCa) or the female (BCb) by early bud pollination (mature F1 pistils rejected the pollen of V13). The phenotypes of the resulting backcross progeny are indicated. The genotypes at the S-locus are indicated in parentheses where SV is the functional S-allele of V13 and SC is the nonfunctional S-allele of V26. The genotypes of backcross progeny were determined using an S-linked RFLP marker (see text for details).
self-incompatible stock V13 was assumed to be homozygous as a result of inbreeding for an uncharacterized functional S-allele, termed SV. [Previously, functional S-alleles in P. hybrida have been assigned allele numbers sequentially by independent investigators, i.e., S1, S2, S3 (Clark et al. 1990) and S1, S2, S3 (Broothaerts et al. 1990). However, these alleles probably have different specificities as judged by N-terminal sequence data. Two additional functional alleles have been reported in P. hybrida, Sx (Ai et al. 1991), and Sb (Broothaerts et al. 1991) and so provisionally SV is a unique name for this new allele.] These assumptions were tested through some preliminary crosses between the stocks V13 and V26 (Figure 1). All the resulting F1 hybrids were self-compatible but they rejected pollen from the self-incompatible parent V13. This suggested that the SV allele of V13 was functional in the pistil of these hybrids. By early bud pollination it was possible to overcome this incompatibility and 65 backcross individuals were tested for self-compatibility (Figure 1, BCb). Approximately half (52.3%) were self-compatible and the remainder were either fully self-incompatible (27.7%) or partially
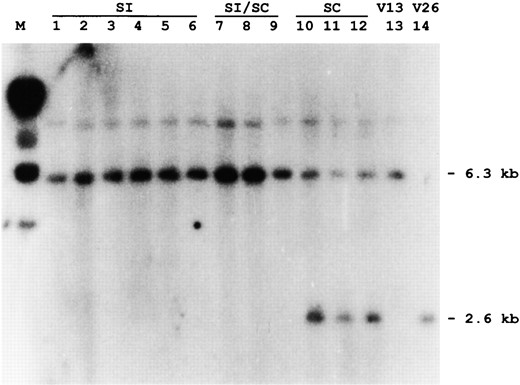
RFLP analysis of (V26 × V13) × V13 backcross progeny with CP100 marker. Genomic DNA from V13 and V26 parents and 12 backcross progeny was digested with XbaI and hybridized with the potato cDNA CP100 (Gebhardt et al. 1991). The phenotypes of the backcross progeny are indicated as SI (self-incompatible), SI/SC (partially self-incompatible), and SC (self-compatible). A 2.6-kb fragment specific to the V26 (SC) parent (lane 14) and absent from the V13 (SI) parent (lane 13) is present only in self-compatible (SC) backcross progeny.
incompatible (20.0%). The latter class may be equivalent to the pseudo-self-compatible types described previously by Ascher (1984).
To monitor the segregation of S-alleles in this backcross an S-linked RFLP marker was sought to assist with genotyping. Two potato cDNA probes have been mapped previously in the vicinity of an S-linked RNase from S. tuberosum (Gebhardt et al. 1991). One of these RFLP markers (CP100) hybridized sufficiently well to P. hybrida genomic DNA to allow segregation analysis with this heterologous probe. A population of 48 individuals segregating for two functionally distinct S-alleles (S3 and Sb) revealed no recombinants with a CP100-defined RFLP (see materials and methods). This demonstrated that the CP100 marker was tightly linked to the S-locus in both petunia and potato and it provides evidence for synteny around the S-locus in the Solanaceae as described recently (ten Hoopen et al. 1998).
Using the CP100 marker, it was possible to identify an XbaI RFLP distinguishing V13 and V26 parents (Figure 2, lanes 13 and 14). This RFLP was used to genotype some of the 65 (V13 × V26) × V13 backcross plants described above (Figure 1, BCb). Six self-incompatible plants (Figure 2, lanes 1–6) and 3 partially incompatible plants (lanes 7–9) were homozygous for the SV -linked allele of CP100. Three self-compatible plants are all heterozygous for the CP100 alleles of V13 and V26 (Figure 2, lanes 10–12). Assuming that no recombination occurred in the CP100-S interval, 6 self-compatible plants tested were all of genotype SC SV and 11 fully self-incompatible plants were all SV SV (Figure 1). This suggests that the SC allele is indeed nonfunctional, conferring self-compatibility on progeny. Of 7 partially incompatible plants tested, all were found to be SV SV (Figure 1). This suggests that genetic modifiers may also be segregating in this backcross that reduce the self-incompatibility of plants homozygous for a functional allele. Similar results have been presented previously from a cross between an unrelated self-compatible cultivar of P. hybrida and a self-incompatible petunia species, P. inflata, and this was also attributed to unlinked genetic modifiers (Ai et al. 1991).
Characterization of a semicompatible mating: A semicompatible mating in which 50% of male gametes should be rejected was devised using stocks V13 and V26. In this backcross, the F1 hybrid is used as the male rather than the female (Figure 1, cf., BCa and BCb). In this cross, half the pollen should carry the SV allele and be rejected by the SV SV style. Pollen grains carrying the nonfunctional SC allele would be accepted (note this would be true even if the SC allele were functional in pollen). To test whether the SV allele is efficiently rejected in this cross, 101 BCa progeny were grown and self-pollinated. Based on at least five pollinations, all but five plants were found to be fully self-compatible. These five exceptional plants showed some reduction in seed set but none were reliably self-incompatible. Given that the BCb analysis suggested that over half of the V13 backcross progeny homozygous for the SV allele should be fully self-incompatible this suggests a low transmission rate for the SV allele. To confirm this interpretation, three partially incompatible and four self-compatible plants were tested with the CP100 RFLP marker. All seven plants were found to be heterozygous for the CP100 alleles of SV and SC (data not shown). These data indicate that the SV allele is efficiently excluded in this backcross and this fulfills the criteria for a semicompatible mating.
Application of a semicompatible cross to test for T-DNA segregation distortion: The semicompatible backcross defined above (Figure 1, BCa) was applied to the available transformed lines. Any T-DNA loci that are linked in coupling or repulsion to the excluded S-allele would be expected to show segregation distortion for the selectable marker (Figure 3). Each V26 primary transformant was crossed with pollen from the self-incompatible line V13. The F1 hybrid seed was plated on kanamycin-containing medium and lines with good penetrance for the kanamycin resistance phenotype that were also apparently single locus (based on a 1:1 segregation) were selected for backcrossing as shown in Figure 3. The F1 was used as a male in two crosses, one to the V13 self-incompatible line (BCa) and a control cross to the V26 self-compatible line (BCb). The V13 backcross is a semicompatible mating that should exclude the SV allele as demonstrated above (Figure 1, BCa), but the V26 backcross should be fully compatible. Both backcrosses are expected to give a 1:1 segregation for
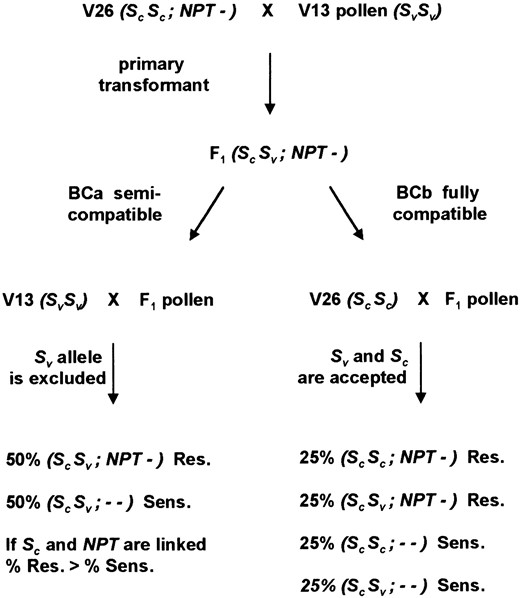
A semicompatible mating to test a T-DNA selectable marker for segregation distortion. The initial cross is the same as in Figure 1, except that the V26 parent has been transformed with a T-DNA carrying a selectable marker (NPT) conferring kanamycin resistance to seedlings. The resulting F1 was backcrossed as the male parent to either V13 (BCa) or V26 (BCb). The kanamycin resistance phenotypes of the resulting backcross progeny are indicated (Res., resistant; Sens., sensitive). The presumed genotypes at the S-locus and the T-DNA locus are indicated in parentheses, where SV is the functional S-allele of V13, SC is the nonfunctional S-allele of V26, NPT is the T-DNA insertion site, and − is the insertion site without T-DNA. The exclusion of the SV allele in the semicompatible mating (BCa) as shown in Figure 1, but not the fully compatible mating (BCb), eliminates two classes of progeny that are homozygous for the SC allele. See text for further details.
kanamycin-resistant and -sensitive progeny, provided the T-DNA is unlinked to the S-locus. If the T-DNA is linked to the SC allele in the primary transformant, then an excess of resistant progeny would be expected in the semicompatible mating (Figure 3, BCa) but not the fully compatible mating (Figure 3, BCb). The latter V26 backcross acts as a control for normal transmission of both S-alleles (SV and SC) in the absence of gametophytic selection.
Of 83 independent T-DNAs assayed for segregation distortion, all were derived from V26 primary transformants except for 2 V13 transformants (Table 1). The number of seedlings scored in each backcross was at least 200 for >95% of the populations. This population size should be sufficient to detect linkage within 40 cM of the S-locus (Leach 1988). In certain cases where segregation distortion was suspected in the semicompatible backcross the number of seedlings scored was increased
Segregation distortion assay for 83 T-DNA loci
| Semicompatible (BCa) | Fully compatible (BCb) | |||||
|---|---|---|---|---|---|---|
| Ds | KAN-R | KAN-S | % KAN-S | KAN-R | KAN-S | % KAN-S |
| V26:2064 transformants | ||||||
| Ds6 | 158 | 174 | 52.4 | 234 | 310 | 57.0 |
| Ds7 | 1559 | 32 | 2.0 | 258 | 389 | 60.1 |
| Ds10 | 127 | 142 | 52.8 | 115 | 99 | 46.3 |
| Ds11 | 198 | 240 | 54.8 | 116 | 122 | 51.3 |
| Ds13 | 202 | 182 | 47.4 | 230 | 240 | 51.1 |
| Ds14 | 317 | 262 | 45.3 | 52 | 68 | 56.7 |
| Ds18 | 204 | 231 | 53.1 | 197 | 150 | 43.2 |
| Ds20 | 205 | 189 | 48.0 | 192 | 176 | 47.8 |
| Ds21 | 439 | 463 | 51.3 | 192 | 189 | 49.6 |
| Ds22 | 137 | 133 | 49.3 | 55 | 49 | 47.1 |
| Ds23 | 158 | 144 | 47.7 | 133 | 193 | 59.2 |
| Ds26 | 549 | 481 | 46.7 | 194 | 176 | 47.6 |
| Ds27 | 128 | 82 | 39.0 | 244 | 214 | 46.7 |
| Ds29 | 1277 | 38 | 2.9 | 289 | 657 | 69.5 |
| Ds31 | 186 | 164 | 46.9 | 217 | 231 | 51.6 |
| Ds32 | 571 | 33 | 5.5 | 81 | 271 | 77.0 |
| Ds33 | 132 | 276 | 67.6 | 121 | 256 | 67.9 |
| Ds34 | 285 | 249 | 46.6 | 133 | 107 | 44.6 |
| Ds36 | 442 | 274 | 38.3 | 54 | 25 | 31.6 |
| Ds38 | 50 | 47 | 48.5 | 96 | 79 | 45.1 |
| Ds40 | 314 | 309 | 49.6 | 196 | 227 | 53.7 |
| Ds41 | 182 | 86 | 32.1 | 151 | 118 | 43.9 |
| Ds46 | 76 | 52 | 40.6 | 134 | 122 | 47.7 |
| Ds47 | 285 | 173 | 37.8 | 195 | 149 | 43.3 |
| Ds49 | 215 | 236 | 52.3 | 104 | 172 | 62.3 |
| Ds50 | 397 | 330 | 45.4 | 282 | 265 | 48.4 |
| Ds51 | 241 | 560 | 69.9 | 109 | 171 | 61.1 |
| Ds52 | 157 | 107 | 40.5 | 123 | 115 | 48.3 |
| Ds53 | 153 | 189 | 55.3 | 150 | 132 | 46.8 |
| Ds54 | 1053 | 4 | 0.4 | 236 | 632 | 72.8 |
| Ds55 | 360 | 8 | 2.2 | 222 | 385 | 63.4 |
| Ds57 | 153 | 144 | 48.5 | 154 | 153 | 49.8 |
| Ds58 | 168 | 164 | 49.4 | 340 | 378 | 52.6 |
| Ds60 | 204 | 544 | 72.7 | 323 | 434 | 57.3 |
| Ds61 | 104 | 241 | 69.9 | 128 | 200 | 61.0 |
| Ds62 | 158 | 168 | 51.5 | 166 | 147 | 47.0 |
| Ds63 | 392 | 366 | 48.3 | 135 | 123 | 47.7 |
| Ds65 | 177 | 139 | 44.0 | 102 | 149 | 59.4 |
| Ds66 | 301 | 216 | 41.8 | 149 | 113 | 43.1 |
| Ds69 | 254 | 270 | 51.5 | 268 | 294 | 52.3 |
| Ds70 | 140 | 177 | 55.8 | 157 | 223 | 58.7 |
| Ds72 | 627 | 53 | 7.8 | 187 | 358 | 65.7 |
| Ds73 | 146 | 137 | 48.4 | 365 | 385 | 51.3 |
| Ds80 | 274 | 241 | 46.8 | 167 | 156 | 48.3 |
| Ds81 | 201 | 198 | 49.6 | 185 | 185 | 50.0 |
| Ds82 | 536 | 33 | 5.8 | 224 | 670 | 74.9 |
| Ds83 | 179 | 141 | 44.1 | 95 | 86 | 47.5 |
| Ds86 | 400 | 245 | 38.0 | 357 | 311 | 46.6 |
| Ds88 | 282 | 209 | 42.6 | 234 | 280 | 54.5 |
| Ds89 | 143 | 127 | 47.0 | 270 | 241 | 47.2 |
| Ds94 | 207 | 158 | 43.3 | 199 | 140 | 41.3 |
| Ds95 | 207 | 181 | 46.6 | 285 | 270 | 48.6 |
| Ds96 | 25 | 38 | 60.3 | 138 | 234 | 62.9 |
| Ds101 | 8 | 5 | 38.5 | 218 | 232 | 51.6 |
| Ds106 | 225 | 517 | 69.7 | 100 | 103 | 50.7 |
| Ds107 | 209 | 176 | 45.7 | 167 | 172 | 50.7 |
| Ds109 | 337 | 286 | 45.9 | 140 | 143 | 50.5 |
| Ds110 | 273 | 299 | 52.3 | 188 | 189 | 50.1 |
| Ds111 | 122 | 102 | 45.5 | 183 | 165 | 47.4 |
| Ds114 | 309 | 279 | 47.4 | 190 | 188 | 49.7 |
| Ds120 | 283 | 184 | 39.4 | 264 | 261 | 49.7 |
| Ds122 | 594 | 22 | 3.6 | 88 | 401 | 82.0 |
| Ds123 | 325 | 330 | 50.4 | 141 | 128 | 47.6 |
| Ds124 | 387 | 228 | 37.1 | 264 | 340 | 56.3 |
| Ds125 | 309 | 234 | 43.1 | 179 | 184 | 50.7 |
| Ds130 | 120 | 193 | 61.7 | 147 | 195 | 57.0 |
| Ds132 | 372 | 35 | 8.6 | 89 | 116 | 56.6 |
| Ds133 | 222 | 229 | 50.8 | 120 | 107 | 47.1 |
| Ds141 | 382 | 313 | 45.0 | 130 | 139 | 51.7 |
| Ds143 | 359 | 271 | 43.0 | 169 | 148 | 46.7 |
| Ds146 | 171 | 103 | 37.6 | 371 | 265 | 41.7 |
| Ds148 | 127 | 81 | 38.9 | 135 | 169 | 55.6 |
| Ds149 | 154 | 130 | 45.8 | 237 | 187 | 44.1 |
| Ds150 | 318 | 22 | 6.5 | 145 | 197 | 57.6 |
| Ds151 | 284 | 214 | 43.0 | 98 | 95 | 49.2 |
| Ds155 | 192 | 185 | 49.1 | 199 | 243 | 55.0 |
| V13:5088 transformants | ||||||
| DsH14 | 645 | 611 | 48.6 | 237 | 245 | 50.8 |
| DsH5.2 | 239 | 146 | 37.9 | 258 | 215 | 45.5 |
| V26:5088 transformants | ||||||
| DsH18A | 124 | 87 | 41.2 | 123 | 112 | 47.7 |
| DsH114 | 707 | 91 | 11.4 | 235 | 393 | 62.6 |
| DsHB27 | 303 | 341 | 53.0 | 122 | 124 | 50.4 |
| DsHB31 | 594 | 412 | 41.0 | 178 | 168 | 48.6 |
| DsHB33 | 1193 | 37 | 3.0 | 86 | 168 | 66.1 |
Primary transformant numbers are indicated in the first column. pSLJ2064 transformants have a Ds prefix, and pSLJ5088 transformants have the prefix DsH to denote the HPT marker carried by the Ds (V. I. Klimyuk and J. D. G. Jones, unpublished results). Seedling kanamycin assays are presented under two headings: semicompatible (Figure 3, BCa) and fully compatible (Figure 3, BCb). KAN-R and KAN-S refer to the number of kanamycin-resistant (R) and -sensitive (S) seedlings scored. In each case, the proportion of kanamycin-sensitive seedlings is presented as a percentage of the total number of seedlings scored. Data in italics refer to lines that show segregation distortion.
significantly. The proportion of kanamycin-sensitive seedlings observed in the two backcrosses is represented graphically in Figure 4, with each square corresponding to a single T-DNA. The majority of lines cluster around the midpoint with approximately equal numbers of resistant and sensitive seedlings in either backcross as expected if the T-DNA is not S-linked. A discrete cluster of 12 lines show a marked segregation distortion in favor of resistant seedlings in the semicompatible mating (Figure 4, arrow). This is the segregation distortion anticipated if the T-DNA is linked to the SC allele (Figure 3). The segregation data for these 12 transformants are italicized in Table 1. All but one of these lines (DsH114) gave <10% of sensitive progeny despite screening larger numbers of seedlings. Additional lines showed evidence of a weak distortion in the semicompatible mating (>30% sensitive) but these were not pursued further.
Interestingly, those lines giving a significant distortion in favor of resistant seedlings in the semicompatible cross BCa also consistently gave a slight distortion in favor of sensitive seedlings in the fully compatible cross BCb (Figure 4). The combined distortion for all 12 lines was 68.5% sensitive seedlings compared to 51.8%, close to the expected 1:1 for the remaining 71 lines. If these 12 lines are linked to the S-locus (see below), then this suggests preferential transmission of the SV allele over SC in the cross to SC SC. This could result from some weak self-incompatibility of the SC allele, which is consistent with the observation that it may not be a complete null allele. Alternatively, the S-locus region may show distorted transmission due to some other factors affecting
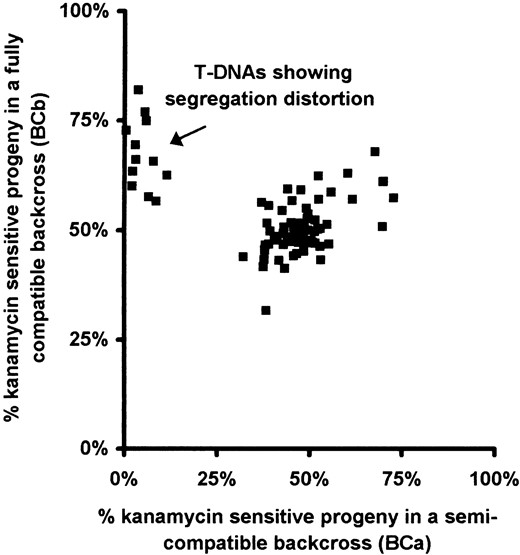
Graphical plot of the T-DNA segregation assays obtained for 83 transformants. The percentage of kanamycin-sensitive seedlings obtained from the two backcrosses for each transformant shown in Table 1 is presented graphically. Each square corresponds to the segregation data for a single transformant. The position on the x-axis corresponds to the percentage of kanamycin-sensitive seedlings in the semicompatible cross (BCa). The position on the y-axis corresponds to the percentage of kanamycin-sensitive seedlings in the fully compatible cross (BCb). The arrow indicates a cluster of 12 transformants showing a significant segregation distortion in favor of sensitive seedlings in the semicompatible cross.
pollen viability or competition that are fortuitously linked to the S-locus.
Intercrossing T-DNAs that show segregation distortion: If the extreme segregation distortions observed in the semicompatible cross are all due to S-linkage, then the T-DNAs should comprise a single linkage group. A method has been described previously for testing for linkage between two T-DNA loci suspected to be on the same chromosome (Robbins et al. 1995). The method requires homozygous stocks for each T-DNA insertion that are crossed to produce an F1 hybrid. These F1 plants will be hemizygous for two distinct T-DNA loci and an outcross to an untransformed line allows a simple assay for linkage between the T-DNAs. If the T-DNAs are unlinked, then the outcross would produce 25% kanamycin-sensitive progeny due to the independent assortment of two dominant markers. If both T-DNAs are in the same linkage group, then a smaller proportion (<25%) of sensitive progeny will be recovered resulting from recombination between the T-DNAs.
A total of 20 different F1 hybrids were generated between 8 of the T-DNAs showing segregation distortion. With the exception of two combinations, at least 200 and often 500 or more outcross seedlings were scored
Test for linkage between T-DNA loci showing segregation distortion
| Intercross | Kanamycin assay | ||||
|---|---|---|---|---|---|
| Ds A | Ds B | KAN-R | KAN-S | % KAN-S | cM |
| Ds7 | Ds29 | 384 | 63 | 14.1 | 28.2 |
| Ds7 | Ds32 | 731 | 144 | 16.5 | 32.9 |
| Ds7 | Ds54 | 1300 | 9 | 0.7 | 1.4 |
| Ds7 | Ds55 | 1275 | 3 | 0.2 | 0.5 |
| Ds7 | Ds82 | 890 | 241 | 21.3 | 42.6 |
| Ds7 | HB33 | 163 | 16 | 8.9 | 17.9 |
| Ds29 | Ds32 | 393 | 23 | 5.5 | 11.1 |
| Ds29 | Ds55 | 277 | 54 | 16.3 | 32.6 |
| DS29 | Ds82 | 609 | 37 | 5.7 | 11.5 |
| Ds29 | HB33 | 368 | 46 | 11.1 | 22.2 |
| Ds32 | Ds55 | 397 | 90 | 18.5 | 37.0 |
| Ds32 | H114 | 75 | 8 | 9.6 | 19.3 |
| Ds32 | HB33 | 669 | 123 | 15.5 | 31.1 |
| Ds54 | Ds55 | 542 | 10 | 1.8 | 3.6 |
| Ds54 | Ds82 | 451 | 118 | 20.7 | 41.5 |
| Ds54 | HB33 | 516 | 60 | 10.4 | 20.8 |
| Ds55 | Ds82 | 555 | 102 | 15.5 | 31.1 |
| Ds55 | HB33 | 576 | 54 | 8.6 | 17.1 |
| Ds82 | H114 | 254 | 24 | 8.6 | 17.3 |
| Ds82 | HB33 | 548 | 97 | 15.0 | 30.1 |
Homozygous stocks for pairs of T-DNAs showing segregation distortion (DsA and DsB) were intercrossed as indicated. The F1 hybrids were outcrossed to an untransformed stock and seedlings were scored for kanamycin resistance. KAN-R and KAN-S refer to the number of kanamycin-resistant (R) and -sensitive (S) seedlings scored. The proportion of kanamycin-sensitive seedlings is presented as a percentage of the total scored. This can be used to calculate the genetic distance between T-DNAs as indicated in centimorgans.
for kanamycin resistance (Table 2). The percentage of kanamycin-sensitive seedlings was <25% for all the combinations shown. Three combinations gave <2%, nine <10%, and all except two gave <20%. These data indicate that most combinations provide evidence of linkage between individual pairs of T-DNA loci. This suggests that at least 8 of the 12 T-DNA loci originally identified by segregation distortion belong to the same linkage group.
The percentage of kanamycin-sensitive seedlings can be used to infer a map distance between the T-DNA loci in centimorgans (Table 2, right column) using a factor of two to account for the doubly resistant recombinant class not recovered in this assay (Robbins et al. 1995). These map distances were used to derive a preliminary map for the T-DNA loci that is consistent with the majority of these pairwise distance estimates (Figure 5). Priority was given to the shorter distances, which are probably more reliable than those >25 cM that require assumptions about the frequency of double crossovers. The distances shown are based on at least two independent pairwise estimates except for the DsHB33-Ds29
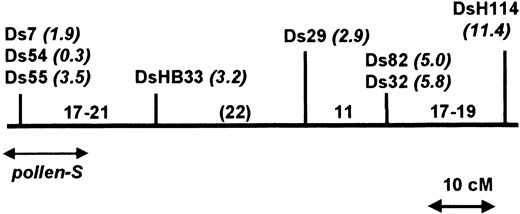
Genetic map of S-linked T-DNAs based on intercrossing. The genetic distances between T-DNAs reported in Table 2 (right column) were used to construct a preliminary map as described in the text. This map is based on recombination estimates in the inbred background V26, and the distances between T-DNAs are shown in centimorgans. The figures in italics refer to the genetic distance (in centimorgans) between each T-DNA and pollen-S based on recombination estimates in the V26 × V13 hybrid background (Table 3, column 2). An approximate position for pollen-S is indicated based on this combined mapping data.
interval, which is considered tentative. The order of the tightly linked pair of T-DNAs Ds82 and Ds32 cannot be resolved on the basis of the existing data. Similarly the order of the tightly linked cluster Ds7/Ds54/Ds55 is not established, although mapping distances to DsHB33 suggest a possible order of Ds54-Ds7/Ds55-DsHB33.
T-DNA linkage to the S-locus through male and female meioses: The intercrossing demonstrated that eight of the T-DNAs showing segregation distortion in a semicompatible mating are in the same linkage group. Since the S-locus is known to show extreme distortion in this mating (see above) it is reasonable to conclude that all eight T-DNAs are S-linked. The proportion of kanamycin-sensitive seedlings observed for these lines in the semicompatible backcross (Table 1) is a direct measure of recombination between pollen-S and the T-DNA. A similar approach has been proposed previously to measure recombination between flanking markers and the S-locus (Leach 1988). This allows a calculation of map distance between T-DNAs and pollen-S in the V13 × V26 mapping hybrid as shown in Table 3 (second column).
Since recombination was within or close to 10% for all the S-linked T-DNAs, it was not considered necessary to use a mapping function to adjust for double crossovers. The most tightly linked T-DNA (Ds54) gave only four sensitive recombinants out of 1191 seedlings screened (Table 1), equivalent to a distance of just 0.3 cM. Since the F1 hybrid was used as the pollen parent in the segregation distortion assay (Figure 1, BCa, and Figure 3, BCa), the recombination occurred during microsporogenesis. If the F1 hybrid is used as the female rather than male, then recombination during megasporogenesis can be assayed (Figure 1, BCb). Since this cross is incompatible, it was necessary to use the technique of early bud pollination to overcome the incompatibility. Alternatively a semicompatible cross using a stock carrying a distinct allele (e.g., SV S3) was
Recovery of recombinants between S-linked T-DNAs and pollen-S
| T-DNA | cM male | No. recombs. | No. plants | cM female |
|---|---|---|---|---|
| Ds54 | 0.3 | 0 | 107 | UD |
| Ds7 | 1.9 | 1 | 127 | 0.8 |
| Ds55 | 2.2 | 0 | 64 | UD |
| Ds29 | 2.9 | 4 | 195 | 2.1 |
| DsHB33 | 3.0 | 1 | 62 | 1.6 |
| Ds32 | 5.5 | 5 | 232 | 2.2 |
| Ds82 | 5.8 | 2 | 209 | 1.0 |
| Ds150 | 6.5 | 2 | 73 | 2.7 |
| Ds72 | 7.8 | 0 | 33 | UD |
| Ds132 | 8.6 | 0 | 45 | UD |
| DsH114 | 11.4 | 7 | 36 | 19.0 |
| Total = 22 |
Recombination data for S-linked T-DNAs are presented in order of increasing distance from the S-locus. The male recombination data (column 2) is derived from Table 1 by dividing the number of kanamycin-sensitive seedlings by the total number of seedlings scored. The female recombination data (column 5) is based on a self-incompatibility assay of backcross progeny as described in the text. All 22 recombinants were confirmed as being of SV SV genotype based on the S-linked CP100 marker. Female genetic distance was calculated by dividing the number of confirmed recombinants by the total number of plants screened (UD, undetermined).
employed to increase the amount of seed set. By selecting for the T-DNA (with kanamycin) and testing for self-incompatibility it was possible to identify recombinants that placed the T-DNA in coupling with the functional S-allele of V13 (SV) rather than the nonfunctional allele of V26 (SC) that confers self-compatibility. Backcross populations of 33–232 individuals were derived for 11 of the S-linked T-DNAs. These were self-pollinated and plants that appeared self-incompatible were tested for the presence of the SC allele using the CP100 flanking marker (data not shown). A total of 22 recombinants for 7 S-linked T-DNAs were confirmed as being of SV SV genotype (Table 3, column 3).
The frequency with which these recombinants were recovered was used to calculate a female genetic distance (Table 3, column 5) that was comparable to the male genetic distance (column 2). An apparently higher recombination rate in the male can be attributed to the fact that some SV SV recombinants would not be detected in the female recombination assay due to the presence of modifiers as observed above (Figure 1, BCb). The female linkage data provide independent confirmation that all 11 T-DNAs are linked to the S-locus. In addition this approach allowed the recovery of recombinants in which a T-DNA was placed in coupling with a functional S-allele (SV), a class of recombinant that was excluded in the previous male recombination assay. These recombinants included several of the more closely linked T-DNAs (Ds7, Ds29, and DsB33) that will be valuable for heterologous transposon tagging of a functional S-locus (SV).
DISCUSSION
Segregation distortion mapping with T-DNA markers: Segregation distortion associated with gametophytic self-incompatibility loci has been used previously to identify isozyme markers linked to the S-locus in the Solanaceae (Labroche et al. 1983; Tanksley and Loaiza-Figueroa 1985). Using the same isozyme segregation distortion method, S-linked markers have been identified in other families as diverse as the Theaceae (Wendel and Parks 1984), Poaceae (Leach and Hayman 1987), Rosaceae (Manganaris and Alston 1987), and Cactaceae (O'Leary and Boyle 1997). This article describes the first application of selectable markers introduced by transformation to detect segregation distortion around the S-locus. The only restriction on this method is the need for a high density of T-DNA insertions carrying a selectable marker. In this study 83 independent T-DNA insertions were tested for segregation distortion.
The analysis of progeny from such a large number of transformants was facilitated by the use of a seedling assay based on kanamycin resistance conferred by the NPT gene. When we used a semicompatible cross, 12 transformants showed a segregation distortion of 8:1 or more in favor of the S-allele carried by the transformation host. This was the direction of distortion anticipated due to the gametophytic selection of S-alleles. Of the 8 T-DNAs tested, all were found to reside in the same linkage group. It has been shown subsequently that 7 of these T-DNAs are physically located on the same arm of chromosome III by fluorescent in situ hybridization (ten Hoopen et al. 1998). The high proportion of T-DNAs showing S-linkage (14.5%) can be attributed to the low level of recombination per chromosome that is frequently observed in crosses of P. hybrida (Robbins et al. 1995; ten Hoopen et al. 1996).
Recombination maps around the S-locus: Two types of genetic linkage data have been obtained for each T-DNA in the S-linkage group. One type is the linkage between pairs of T-DNAs derived from recombination in an inbred genetic background (V26) as shown in Table 2. This pairwise information has been used to assemble a map of T-DNAs relative to each other (Figure 5). The second is the linkage between each T-DNA and pollen-S determined in the segregation distortion assay (Table 3, column 2). The integration of these two types of linkage data is complicated by the significant suppression of recombination that occurs in crosses between inbred lines of P. hybrida (Robbins et al. 1995; ten Hoopen et al. 1996). This probably results from the relatively recent origin of P. hybrida from wild species and the maintenance of chromosomal blocks with distinct gene orders (Peltier et al. 1994). This is similar to the situation in tomato where there can also be significantly more recombination in intraspecific crosses than interspecific crosses (Ganal and Tanksley 1996). Although the F1 hybrid used in the mapping relative to pollen-S described in this article (V13 × V26) is different from those used previously (Robbins et al. 1995), it is apparent that a similar suppression is occurring compared to the inbred recombination levels. For example, the Ds29 T-DNA maps ~40 cM from Ds54 in the inbred map (Figure 5), yet it is only 2.9 cM from pollen-S. Since Ds54 is the T-DNA most tightly linked to pollen-S (0.3 cM), this indicates at least an order of magnitude difference in recombination in the hybrid relative to the inbred map. The region between the Ds29 T-DNA and DsH114 seems to be less prone to recombination suppression and the map distances seem to be increased by only three- to fourfold in the inbred situation.
Because of the difficulty of integrating the two types of mapping data, it is not possible to unambiguously position pollen-S within the T-DNA map shown in Figure 5. However, the hybrid map distances between each T-DNA and pollen-S (shown in parentheses in Figure 5) are consistent with a location in the vicinity of the T-DNA cluster Ds7/Ds54/Ds55. If Ds54 is located at the extreme end of the linkage group as the inbred mapping data suggests, then pollen-S could conceivably map outside the linkage group. The cytological positions of these S-linked T-DNAs correlate well with the order and distances predicted from the inbred genetic map (ten Hoopen et al. 1998). The cytological mapping unambiguously places the Ds7/Ds54/Ds55 cluster and the Ds29/Ds82/Ds114 grouping in proximal and distal regions of the long arm of chromosome III, respectively. These data are consistent with the centromeric location for the S-locus proposed previously (ten Hoopen et al. 1998) and recently confirmed directly (Entani et al. 1999). The apparent lack of S-linked T-DNAs identified on the short arm could be interpreted as evidence for unexpectedly high levels of recombination occurring around the centromere.
Using selectable markers to preselect for recombination around the S-locus: The identity of the pollen-S gene is unknown for the S-RNase-mediated type of gametophytic self-incompatibility system exemplified by the family Solanaceae and including petunia (Dodds et al. 1996). One approach to identify this gene would be map-based cloning, which has proved successful for pathogen resistance genes in tomato (Martin et al. 1993a; Dixon et al. 1996). One of the limiting factors in this approach is the identification of rare recombination events flanking the target gene (Martin et al. 1993b; Dixon et al. 1995). Selectable markers offer an appealing approach to preselect for recombination events as has been suggested in Arabidopsis (Van Lisjebettens et al. 1996). However, two independent selectable markers
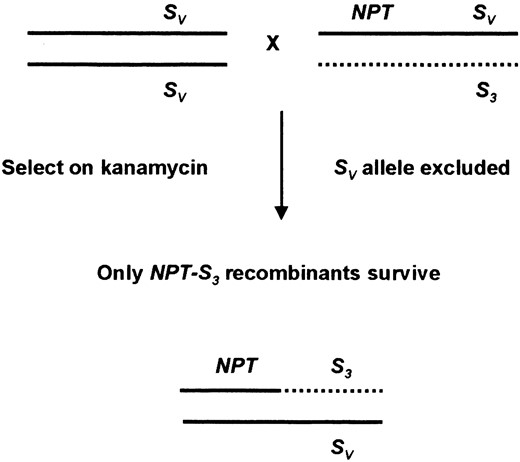
Scheme to preselect for recombination events flanking the S-locus. The male parent shown is heterozygous at the S-locus (SV S3) and carries a T-DNA conferring kanamycin resistance (NPT) linked to the SV allele. When crossed to a female plant homozygous (or heterozygous) for the SV allele, the SV allele from the transgenic male parent is excluded. The only seedlings from this cross that will survive kanamycin selection are the NPT-S3 recombinants shown.
are required in the same linkage group if only recombinant seedlings are to be allowed to survive (Robbins et al. 1995). We propose a scheme to apply this method to the S-locus region by combining the semicompatible mating with an S-linked selectable marker.
Several recombinants that place a functional S-allele (SV) in linkage with a selectable T-DNA (Table 3) were identified in this article. Each of these recombinants could be used to preselect for recombination between the T-DNA and pollen-S as shown in Figure 6. The T-DNA-marked stock would be used as the pollen donor in a semicompatible mating that would exclude the S-allele linked to the selectable marker (SV). The resultant seed would be selected for kanamycin resistance and any resistant seedlings would be putative recombinants. The scheme has been tested on a limited scale and successfully enriched for five recombinants between pollen-S and the Ds29 T-DNA (R. M. Harbord and T. P. Robbins, unpublished results). A limitation of the scheme is that it is only applicable to those S-linked T-DNAs where an initial recombination event has been identified placing the T-DNA in coupling with a functional allele. Unfortunately, this was not possible for the most tightly linked T-DNA, Ds54 (0.3 cM) but was possible for three T-DNAs within 3 cM or less of pollen-S (Ds7, Ds29, and DsB33). Using such T-DNAs, it will be possible to select valuable recombinants for constructing a fine scale genetic map of the S-locus region including molecular markers such as CP100.
The pollen-S function is predicted to be tightly linked to the style-S function encoded by the S-RNase, since any recombination would lead to a breakdown in specificity (Lewis 1949). Recently we have isolated an S-RNase cDNA for the SV allele used in this study (T. P. Robbins, unpublished results). It will be interesting to test whether the SV-RNase and pollen-SV function can be separated using the recombinant selection scheme described. Such recombinants are likely to be rare but if available would be extremely informative in a map-based cloning approach to identify pollen-S. It is likely that the sequence organization around the S-RNase may act to suppress recombination between alleles, as appears to be the case for the sporophytic self-incompatibility system in Brassica (Boyes et al. 1997).
Wider applications of S-linked transgenes: Although in this study a nonfunctional S-allele (SC) was employed in the segregation distortion assay, this was not a critical feature. The scheme shown in Figure 3 can be readily adapted to transformants in a self-incompatible background. In the simplest case a heterozygous stock (e.g., S1 S2) would be transformed and T-DNA distortions could be detected by two types of semicompatible mating. These crosses would be set up to select against either S-allele in turn (e.g., S1 S3 or S2 S3 × S1 S2:NPT). This would allow the detection of T-DNA linkage to either S-allele in the transformation host. Although homozygous S-allele stocks were used in this study, these are sometimes difficult to obtain by early bud pollination, so this may be a more general method for detecting S-linked T-DNAs. Such T-DNAs might find an application in plant breeding strategies that require predictable S-genotypes. One of the main problems using self-incompatibility in breeding is maintaining stocks with defined S-genotypes. A selectable marker that can be used to identify particular S-genotypes early in seedling development would avoid the need to classify plants using time-consuming pollination tests. Obviously any significant recombination between the S-locus and the T-DNA would limit the usefulness of this approach but as shown here, segregation distortion is a powerful approach to identify many S-linked T-DNAs.
Some of the T-DNAs shown to be linked to the S-locus of P. hybrida in this study are being used currently for heterologous transposon tagging of pollen-S. The maize Ds element carried by the T-DNA inserts can be transactivated by crossing to lines that carry the Activator (Ac) element (Chuck et al. 1993). This has been tested using selected recombinants in Table 3 that place the Ds element in coupling with a functional S-allele (SV). This approach takes advantage of the observation that Ds transposes predominantly to genetically linked sites in heterologous systems (Dooner et al. 1991) as it does in maize. A number of germinal excision/reinsertion events are currently being characterized for changes in pollen-S function (R. M. Harbord, K. Clarke and T. P. Robbins, unpublished results).
Acknowledgement
The authors thank Archie Tang and Julie Sontag (University of California, Davis) for technical assistance with the plant transformations and generating the F1 seed for mapping, and Katie Clarke (University of Nottingham) for supplementary data for Table 2. For binary vectors and Agrobacterium strains, we thank Steve Scofield and Jonathan Jones (Sainsbury Laboratory). We also thank Ronald Koes (Free University of Amsterdam) and Wim Broothaerts (University of Leuven) for seed stocks and Christiane Gebhardt (Max Planck Institute, Cologne) for the potato RFLP marker, CP100. For comments on this article we thank Tom Gerats (University of Gent) and Rogier ten Hoopen (University of Amsterdam). This work was supported by a U.K. Biotechnology and Biological Sciences Research Council fellowship award to T.P.R. and a U.S. National Science Foundation grant to C.A.N. The Sainsbury Laboratory is supported by the Gatsby Charitable Foundation.
Footnotes
Communicating editor: V. Sundaresan
LITERATURE CITED
Author notes
Present address: Department of Plant Sciences, University of Arizona, 303 Forbes Ave., Tucson, AZ 85721.
Present address: Plant Science Division, School of Biological Sciences, University of Nottingham, Sutton Bonington Campus, Loughborough LE12 5RD, United Kingdom.
