


Abstract
To investigate the level and pattern of DNA variation of Arabidopsis thaliana at the entire genome level, AFLP analysis was conducted for 38 ecotypes distributed throughout the world. Ten pairs of selective primers were used to detect a total of 472 bands, of which 374 (79.2%) were polymorphic. The frequency distribution of polymorphic bands was skewed toward an excess of singleton variation. On the basis of AFLP variation, nucleotide diversity for the entire genome was estimated to be 0.0106, which was within the range reported previously for specific nuclear genes. The frequency distribution of pairwise distance was bimodal because of an ecotype (Fl-3) with a large number of unique bands. Linkage disequilibrium between polymorphic AFLPs was tested. The proportion of significant linkage disequilibria was close to random expectation after neglecting the ecotype Fl-3. This result indicates that the effect of recombination could not be ignored in this selfing species. A neighbor-joining tree was constructed on the basis of the AFLP variation. This tree has a star-like topology and shows no clear association between ecotype and geographic origin, suggesting a recent spread of this plant species and limited migration between its habitats.
THE amplified fragment length polymorphism (AFLP) technique is a method of DNA fingerprinting (Vos et al. 1995), which combines strategies of restriction fragment length polymorphism (RFLP) and polymerase chain reaction (PCR). AFLP is carried out in four distinct steps: restriction enzyme digestion of DNA, ligation of adaptors to the restricted sites, PCR amplification of restricted fragments with primers that bind to the adaptor sequence and adjacent selective nucleotides, and acrylamide gel electrophoresis. Usually, restriction enzymes with two different specificities, e.g., EcoRI and MseI, are used to generate a large number of fragments. PCR amplification with the specific primers ensures reliable and reproducible detection of restricted fragments. Acrylamide gel electrophoresis is sufficiently sensitive to distinguish fragments differing in length by only 1 bp. Thus, AFLP can be a powerful technique to detect a large number of bands with high reproducibility and sensitivity.
AFLP analysis has been applied to the genomes of many plants, mostly crop species, to construct genetic maps (barley: Becker et al. 1995; Waugh et al. 1997; melon: Wang et al. 1997; potato: van der Voort et al. 1997; Arabidopsis thaliana: Alonso-Blanco et al. 1998) and to study phylogenetic relationship and genetic diversity among cultivars (barley: Russell et al. 1997; Schut et al. 1997; cassava: Roa et al. 1997; Eucalyptus: Gaiotto et al. 1997; hop: Hartl and Seefelder 1998; maize: Marsan et al. 1998; wheat: Donini et al. 1997). In all of these studies, AFLP has detected a large number of polymorphisms more efficiently than other DNA technologies, such as RFLP, random amplified polymorphic DNA (RAPD), and microsatellite or simple sequence repeat polymorphism (SSR) analyses. In A. thaliana, AFLP analysis was used to construct a fine genetic map (Alonso-Blanco et al. 1998). AFLP markers were detected in the entire genome, although they were not distributed proportionally to physical length of chromosomes. There were clusterings of AFLP markers around the centromeric regions of all five chromosomes. The reason for this clustering pattern is not known, but might involve low recombination and/or physical abundance of AFLP markers in centromeric regions.
Recently, estimates of nucleotide variation in A. thaliana have been reported (King et al. 1993; Hanfstingl et al. 1994; Innan et al. 1996; Kawabe et al. 1997; Purugganan and Suddith 1998). Although this plant species has a high selfing rate (Abbot and Gomes 1989), the level of DNA variation at the species level (among ecotypes) as revealed by RFLP and sequencing studies was shown to be as high as those in other outcrossing species. These studies estimated that nucleotide diversity (Nei and Li 1979) is ∼0.01. In addition, Innan et al. (1997) also reported that A. thaliana had a high level of variation at microsatellite loci, which was comparable to that of animal and outbreeding plant species. The population structure of A. thaliana was studied by RFLP analysis on three CAPS regions by Bergelson et al. (1998). They reported that interpopulation variation was three to seven times larger than intrapopulation variation. This result was indicative of limited migration and/or frequent extinction/recolonization and consistent with the selfing nature of this plant species. The phylogenetic relationship among ecotypes of A. thaliana and the evolutionary history of the species were also studied on the basis of DNA variations (King et al. 1993; Innan et al. 1996, 1997; Kawabe et al. 1997). In all these studies, no relationship was detected between geographical origin and clustering in the phylogenetic tree, suggesting a recent spread and/or long-distance dispersal of A. thaliana throughout the world.
In this report, AFLP analysis was used to study the level and pattern of naturally occurring DNA variation in the wild plant species A. thaliana. Because this technique can detect polymorphisms in many loci of the genome simultaneously, it is possible to study DNA variation within the entire genome. We estimated genomewide nucleotide diversity (the average pairwise number of nucleotide substitutions per site) from AFLP data by using a method developed by Innan et al. (1999) and compared the estimate with those obtained by sequencing studies on specific nuclear genes. In addition, linkage disequilibrium between AFLPs was tested to infer the effect of recombination on the pattern of DNA polymorphism. In selfing species like A. thaliana, the whole genome could be regarded as a single linkage group because of effectively low recombination (Charlesworth et al. 1993). Furthermore, it was shown that one characteristic of DNA polymorphism in the A. thaliana nuclear genome was the presence of dimorphism (Innan et al. 1996; Kawabe et al. 1997; Purugganan and Suddith 1998). If the whole genome is a single linkage group, and dimorphism extends over the entire genome, then a high level of linkage disequilibria is expected. Finally, on the basis of AFLP variation, the phylogenetic relationship among ecotypes was studied. The implications of these data for the evolutionary history of A. thaliana are discussed.
MATERIALS AND METHODS
Plant materials: Thirty-eight ecotypes of A. thaliana were used (Table 1). Seeds were obtained from Nobuharu Goto, Sendai Arabidopsis Seed Stock Center, Miyagi University of Education, Sendai, Japan. Plants were grown from seeds in pots placed in an incubator under 24-hr light conditions.
AFLP analysis: Total DNA was extracted from mature plants (Kawabe et al. 1997). AFLP analysis was carried out according to the manufacturer’s protocol (AFLP Analysis System II; GIBCO/BRL, Grand Island, NY). Total DNA (100-250 ng) was double digested with EcoRI (recognition sequence 5′-GAATTC-3′) and MseI (TTAA). After ligating EcoRI and MseI adaptors to the digested DNA, preamplification was conducted with an EcoRI primer (EcoRI adaptor sequence) and an MseI primer (MseI adaptor sequence + C as a selective nucleotide). The preamplification product was used as a template for selective amplification. Selective amplification was conducted using an EcoRI primer containing two selective nucleotides and a MseI primer containing three selective nucleotides. Ten combinations of the selective primers were used (Table 2). All the EcoRI selective primers were labeled at the 5′ end with fluorescein Cy-5 as supplied by the manufacturer (Pharmacia, Piscataway, NJ). The products of selective amplification were denatured at 90° for 3 min. Electrophoresis on a denaturing 6% acrylamide gel was conducted with an ALFred sequencer (Pharmacia). The gel image was visualized by the program ALFwin ver. 1.00 (Pharmacia), and band peaks were detected by the program AlleleLinks ver. 1.00 (Pharmacia) with default settings. Bands were scored by confirming peaks on the gel image. Most bands corresponded to fragments <500 bp long. Band sizes were estimated by AlleleLinks using 2 internal markers (50 and 300 bp) and 10 external markers (50-bp ladder) as size standards.
Data analysis: The presence and absence of AFLP bands were scored for each ecotype. As a measure of DNA variation (genetic distance) between ecotypes, the number of nucleotide substitutions per site was estimated, following the method of Innan et al. (1999). The average value of all the pairwise distances was regarded as a measure of nucleotide polymorphism (nucleotide diversity, π). Linkage disequilibrium between AFLPs was tested by the chi-square test. From Figure 2 and Appendix 1 of Alonso-Blanco et al. (1998), we could identify the chromosomal location of 38 of the AFLPs detected in this study. These 38 AFLPs were used to study linkage disequilibrium within and between chromosomes. A neighbor-joining tree was constructed on the basis of the pairwise distance by PHYLIP ver. 3.57 (Felsenstein 1993).
Computer simulation: The expected frequency spectrum of AFLPs was investigated by computer simulation that was conducted according to the genealogical relationship among sampled individuals (Innan et al. 1999). In the simulation, it was assumed that the genome size per haploid individual was 1000 kbp and that the number of fragments per haploid individual was ∼23, which was the estimate obtained in this study. The genome was divided into five segments (the length of each segment was 200 kbp) because A. thaliana has five chromosomes, although the number of segments does not affect the expected spectrum. For each segment of the genome, a random genealogy and an ancestral sequence were generated, and mutations took place randomly following the genealogy. The estimated π (0.0106 for n = 38 and 0.0100 for n = 37) was used as the mutation parameter (4Nμ). Finally, the AFLP bands of the descendant individuals were scored and the frequency spectrum was obtained. The number of replications was 1000.
RESULTS
AFLP in Arabidopsis thaliana: A total of 472 bands were detected by AFLP among 38 ecotypes by using 10 combinations of selective primers (Tables 1 and 2). Average band length was 225.8 bp, but bands of ∼150-bp long were detected most often (Figure 1). The number of bands decreased as the size increased. Bands longer than 600 bp were rarely detected. The number of bands varied for different pairs of selective primers (Table 2). The combination of EcoRI + TA and MseI + CTT gave the smallest number of bands (27); all other primer combinations detected >30 bands. The average number of bands per ecotype per primer pair was 22.9 ± 0.2. The ecotype Fl-3 sampled in Finland had the largest number of bands per primer pair (28.7), including 60 unique bands. The smallest number of bands per primer pair was detected in ecotype Mr-0 sampled in Italy (21.0 bands). When all the bands were considered, each ecotype had a distinct haplotype. Even when singleton bands were eliminated, none of the ecotypes shared identical haplotypes. This indicates that AFLP could be used as a powerful tool to identify ecotypes in A. thaliana.
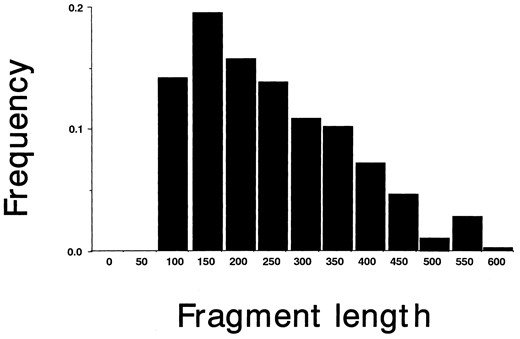
—Frequency distribution of fragment size detected by AFLP analysis on A. thaliana. n = 472; average is 225.8 bp.
Arabidopsis thaliana ecotypes used in this study
| Ecotype | Accession no.a | Origin | Ecotype | Accession no. | Origin | ||
|---|---|---|---|---|---|---|---|
| 1 | Aa-0 | J1 | Germany | 20 | In-0 | J110 | Austria |
| 2 | Ag-0 | J2 | France | 21 | Ita-0 | J112 | Morocco |
| 3 | Al-0 | J4 | Denmark | 22 | Kas-1 | J119 | India |
| 4 | Bl-1 | J13 | Italy | 23 | Ko-3 | J126 | Denmark |
| 5 | Bla-10 | J15 | Spain | 24 | Mr-0 | J155 | Italy |
| 6 | Bs-1 | J22 | Switzerland | 25 | Mt-0 | J158 | Libya |
| 7 | Bus-1 | J46 | Norway | 26 | Nok-4 | J170 | Netherlands |
| 8 | Chi-0 | J53 | Russia | 27 | Ost-0 | J179 | Sweden |
| 9 | Ci-0 | J54 | United Kingdom | 28 | Pog-0 | J192 | British Columbia, Canada |
| 10 | Col-0 | J58 | Missouri | 29 | Rou-0 | J200 | France |
| 11 | Dra-0 | J68 | Czechoslovakia | 30 | Shokei | JSW101 | Japan |
| 12 | Edi-0 | J69 | United Kingdom | 31 | Su-0 | J225 | United Kingdom |
| 13 | Es-0 | J76 | Finland | 32 | Ts-1 | J230 | Spain |
| 14 | Fl-3 | J83 | Finland | 33 | Tsu-0 | J236 | Japan |
| 15 | Ge-2 | J91 | Switzerland | 34 | UK-2 | J240 | Germany |
| 16 | Gr-1 | J95 | Austria | 35 | Ws-0 | J252 | Russia |
| 17 | Hau-0 | J100 | Denmark | 36 | Xxx-0 | J261 | Spain |
| 18 | Hel-1 | J101 | Finland | 37 | Yo-0 | J262 | California |
| 19 | Hiroshima | JSW102 | Japan | 38 | Zu-0 | J264 | Switzerland |
Accession number of the Sendai Arabidopsis Seed Stock Center (SASSC).
Summary of AFLP variation in Arabidopsis thaliana
| Primers | No. of different bands | No. of bands per line | No. of polymorphic bandsa | Average proportion of shared bands | Nucleotide diversity | |
|---|---|---|---|---|---|---|
| EcoRI | MseI | |||||
| AA | CAC | 43 [40 | 28.3 28.1 | 27 (4) 24 (2) | 0.890 0.894 | 0.0068 0.0065]b |
| AA | CAG | 57 [49 | 30.4 30.2 | 39 (12) 31 (4) | 0.874 0.881 | 0.0079 0.0074] |
| AC | CTA | 55 [49 | 24.2 24.0 | 48 (14) 42 (9) | 0.808 0.816 | 0.0124 0.0117] |
| AG | CTG | 47 [41 | 19.8 19.7 | 39 (11) 33 (7) | 0.763 0.773 | 0.0155 0.0147] |
| AT | CAG | 35 [30 | 17.5 17.4 | 27 (7) 22 (2) | 0.805 0.811 | 0.0124 0.0119] |
| TA | CTT | 27 [24 | 10.3 10.3 | 24 (6) 20 (3) | 0.778 0.795 | 0.0149 0.0130] |
| TC | CAA | 67 [57 | 36.9 36.6 | 52 (17) 41 (9) | 0.891 0.899 | 0.0069 0.0063] |
| TC | CAT | 47 [40 | 22.9 22.7 | 39 (11) 32 (5) | 0.826 0.832 | 0.0110 0.0105] |
| TG | CAA | 46 [42 | 19.3 19.3 | 42 (8) 38 (4) | 0.711 0.720 | 0.0199 0.0189] |
| TT | CTA | 48 [40 | 19.0 18.7 | 37 (14) 29 (9) | 0.835 0.844 | 0.0104 0.0096] |
| Total | 472 [412 | 22.9c 22.7 | 374 (104) 312 (54) | 0.831 0.839 | 0.0106 0.0100] | |
The number of singletons is in parentheses.
Rows in brackets indicate that the ecotype Fl-3 is eliminated.
The number of bands per line per primer pair.
Level of nucleotide variation revealed by AFLP: A total of 374 (79.2%) of the AFLP bands were polymorphic, and 98 (20.8%) were fixed. Although the number of bands varied among primer pairs, no relationship was seen between the number of bands and selective nucleotides used in a particular primer pair. In addition, the number of bands did not correlate with the proportion of polymorphic bands for different primer pairs. The frequency distribution of polymorphic bands was asymmetric for both actual and simulation data (Figure 2). The asymmetric distribution in the simulation experiment is due to the fact that mutation tends to form a new band rather than a band that comigrates with a preexisting AFLP band, even though nucleotide mutation occurs at random. This situation is similar to the infinite allele model (Kimura and Crow 1964). However, singleton bands (22.0%, all ecotypes; 13.1%, all ecotypes except Fl-3) were found at a higher frequency than expected by the simulation. The frequencies of fixed and single-loss classes were reduced. The other allelic classes were found rather uniformly at low frequencies. This result indicates that DNA variations at intermediate frequencies are not common in the A. thaliana nuclear genome.
On average, 83.1% of all bands were shared between ecotypes (Table 2). Because of its large number of unique bands, the ecotype Fl-3 shared only ∼70% of bands with other ecotypes. Interestingly, a laboratory strain Col-0 shared 94.6% of bands with the ecotype Xxx-0 sampled in Spain. By using the method of Innan et al. (1999), a genome-wide estimate of nucleotide diversity (π) was obtained (Table 2). Although estimates varied for different primer pairs, the average value (0.0106) was comparable to the values obtained by sequencing protein coding regions of A. thaliana (0.0080 for Adh: Innan et al. 1996; 0.0104 for ChiA: Kawabe et al. 1997; 0.007 for Cal: Purugganan and Suddith 1998). When the ecotype Fl-3 was eliminated from the calculation, the estimate of nucleotide diversity decreased slightly from 0.0106 to 0.0100.
The frequency distribution of pairwise nucleotide distance had two peaks (Figure 3). Because of many unique bands in Fl-3, estimates of pairwise distance between Fl-3 and the other ecotypes were large, producing a peak around 0.023. The other peak around 0.01 was composed of estimates between the rest of the ecotypes. The smallest distance (0.0031) was obtained between the ecotypes Col-0 and Xxx-1, while the largest (0.0240) was that between Fl-3 and Xxx-1. Figure 3 also shows the frequency distributions of pairwise nucleotide distance for nuclear genes in A. thaliana and Arabis gemmifera (Adh: Innan et al. 1996; Miyashita et al. 1996; ChiA: Kawabe et al. 1997). The distributions had several peaks and wide variance, although averages were about the same as for AFLP. The peaks were due to dimorphic DNA variation in Adh and ChiA. In ChiA of A. thaliana, three separate peaks were detected, caused by the presence of three divergent ecotypes.
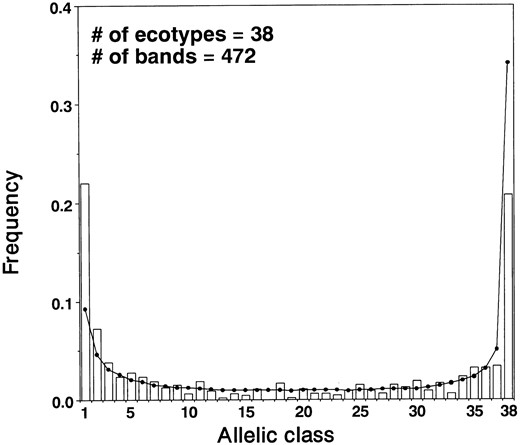
—Frequency spectrum of AFLP in A. thaliana.
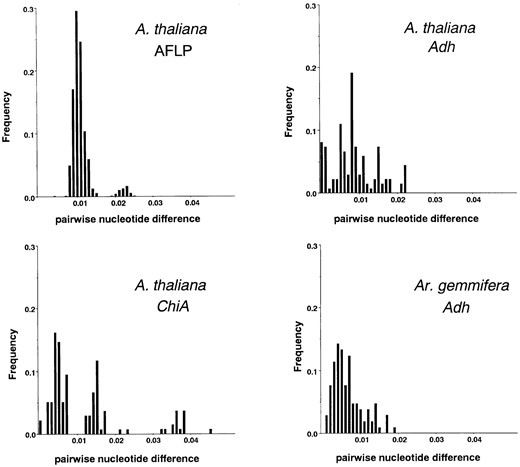
—Frequency distribution of pairwise nucleotide difference in A. thaliana and Ar. gemmifera.
Linkage disequilibrium between AFLPs: Linkage disequilibrium was examined by the chi-square test between all the polymorphic bands (Table 3). There were 69,751 combinations, of which 7952 were significant at least at the 5% level. The proportion of significant pairs (11.4%) was higher than that expected by chance and similar to that of genome-wide linkage disequilibrium (12.1%) obtained between 20 microsatellite loci in A. thaliana (Innan et al. 1997). Among significant pairs, the proportion of highly significant pairs (P < 0.5%) was in excess, and was detected 15 times more than expected by chance. However, after excluding the ecotype Fl-3 with many unique bands, the overall frequency of significant linkage disequilibrium decreased (6.3%), which was slightly higher than random expectation (5%). This result indicates that unique variations in Fl-3 contributed to the high proportion of significant linkage disequilibria. The unique variations in Fl-3 produced singleton gamete types in two- and three-gamete combinations, which resulted in significance in the chi-square test (or Fisher’s exact test).
For the 38 AFLPs of known chromosomal locations, 7.7% (54/703) of combinations were in significant linkage disequilibrium, which was similar to that of the overall data. In intrachromosomal comparisons, the percentage of significant pairs was 6.5% (9/139), while the percentage for interchromosomal comparisons was 8.0% (45/564). These percentages were not statistically different (χ2 = 0.36, d.f. = 1, P = 0.60). For 20 microsatellite loci of A. thaliana (Innan et al. 1997), the percentage of significant inter- and intrachromosomal linkage disequilibria was also similar: significant interchromosomal linkage disequilibrium was 12.6% (6/55), and intrachromosomal was 10.9% (17/135; χ2 = 0.09, d.f. = 1, P = 0.77). Although microsatellite variations gave a higher proportion of significant pairs than AFLP, the difference between types of variation was not statistically significant in either comparison (χ2 = 3.05, d.f. = 1, P = 0.08 for overall data; χ2 = 0.91, d.f. = 1, P = 0.34 for intrachromosomal comparison; and χ2 = 2.34, d.f. = 1, P = 0.13 for interchromosomal comparison). From these results, it could be concluded that the level of significant linkage disequilibria in A. thaliana is not high and is close to the level expected due to random chance.
Phylogenetic relationship between A. thaliana ecotypes based on AFLP variation: Because AFLP analysis detects DNA sequence variations throughout the entire genome, AFLP data can be used to study the evolutionary relationship among ecotypes of A. thaliana. Previously, evolutionary relationships were studied using data on the polymorphism of 20 microsatellite loci, which were also detected throughout the genome (Innan et al. 1997). However, the distance measure used in that study (the average squared difference in repeat number) may not vary in a manner that is proportional to time. Although the measure has a linear relationship with time under the stepwise mutation model (Goldstein et al. 1995), the mutation model was shown to be inappropriate to explain the level of microsatellite polymorphism in A. thaliana (Innan et al. 1997). In this study, the average number of nucleotide substitutions per site was estimated. Although many factors influence the rate of nucleotide substitutions (Kimura 1983), it is likely that nucleotide substitution is more linear with respect to time than change in repeat number in microsatellite loci. Therefore, the phylogenetic tree obtained here could reflect phylogenetic relationships more accurately in terms of time.
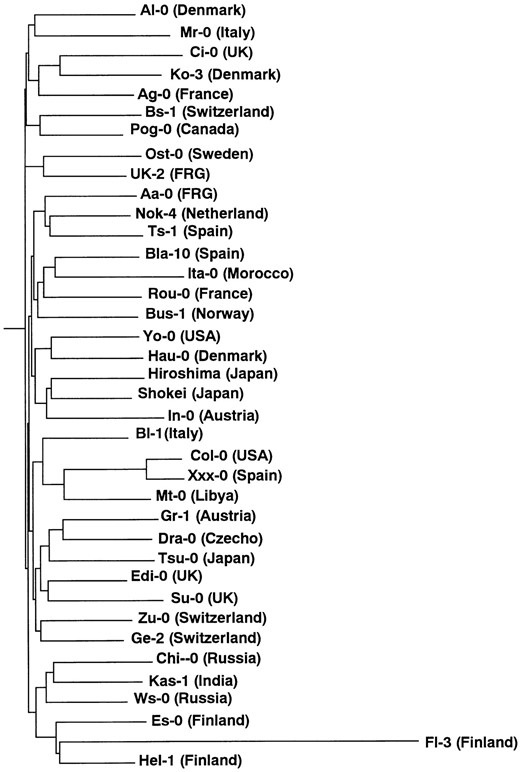
—Neighbor-joining tree of 38 ecotypes of A. thaliana based on AFLP variation.
Linkage disequilibrium between 374 AFLPs in 38 ecotypes of Arabidopsis thaliana
| Combination (%) | No. of gametes | |||
|---|---|---|---|---|
| No. | Two gametes | Three gametes | Four gametes | |
| Nonsignificant | 61,799 (45,622)a | 0 (0) | 44,157 (29,640) | 17,642 (15,982) |
| Significant | 7,952 (2,894) | 1,947 (84) | 4,672 (1,743) | 1,333 (1,067) |
| 5 | 2,806 (1,806) | 0 (0) | 1,869 (1,028) | 937 (778) |
| 1 | 568 (117) | 0 (0) | 501 (59) | 67 (58) |
| 0.5 | 4,578 (971) | 1,947 (84) | 2,302 (656) | 329 (231) |
| Total | 69,751 (48,516) | 1,947 (84) | 48,829 (31,383) | 18,975 (17,049) |
After excluding the Fl-3 ecotype. The number of AFLPs compared is 312.
A neighbor-joining tree was constructed on the basis of the pairwise distance between each pair of ecotypes (Figure 4). The topology is star-like, where the tree diversified rapidly, and each ecotype has a long branch. Branch length is relatively constant except for the ecotype Fl-3. In the tree based on microsatellite variation (Figure 3 in Innan et al. 1997), there was variation in branch length leading to each ecotype. The variation in branch length of that tree could be due to sporadic occurrence of microsatellite mutations. In Figure 4, ecotypes sampled in relatively adjacent places, e.g., three Finnish ecotypes, were found close to each other in the tree structure, but there was no clear association between tree clusters and geographic origin. This result is consistent with previous results of RFLP and sequencing studies (King et al. 1993; Price et al. 1994; Innan et al. 1996, 1997; Kawabe et al. 1997).
DISCUSSION
AFLP variation in A. thaliana: As in other plant species, AFLP analysis in A. thaliana detects many polymorphic bands and is an efficient method for ecotype identification. With a single combination of selective primers, the average number of bands detected was >20 per ecotype, of which ∼80% were polymorphic. Considering the technical ease and sensitivity to DNA polymorphism of this technique, it is advantageous for carrying out population studies of various organisms and perhaps more suitable than other similar techniques, i.e., RFLP, RAPD, and SSR.
Every ecotype in this study was distinguished by a moderate amount of AFLP variation; however, the ecotype Fl-3 was unusual in having a large number of unique bands. Because AFLP can detect variation throughout the entire genome, Fl-3 could have increased variation on a genome-wide basis. One explanation for its higher-than-average number of unique bands is that Fl-3 has a higher mutation rate than the other ecotypes. However, no morphological abnormality is detected in this ecotype (Goto 1996), as might be expected if Fl-3 had a high mutation rate. Another possibility is that this ecotype has additional chromosomes (part or all of another genome). This would be consistent with the fact that many plant species can tolerate additional foreign chromosomes (Richards 1986). In other words, this ecotype could be an interspecific hybrid or the aneuploid descendant of such a hybrid. Because the ecotype has extra bands and is not missing bands, it is certain that something must have been added. A naturally occurring interspecific hybrid of A. thaliana has been identified: A. suecica is thought to be an amphiploid between A. thaliana and Cardaminopsis arenosa (Hylander 1957; Rédei 1972). Furthermore, divergent sequences exist in a long stretch in the Adh and ChiA regions of particular ecotypes in addition to DNA dimorphism (Innan et al. 1996; Kawabe et al. 1997). Although the origin of these divergent sequences is unclear, one explanation is inter-specific introgression as suggested here. A cytological examination of the Fl-3 ecotype is under way.
Level of DNA variation in the entire genome of A. thaliana: This study demonstrates that the level of nucleotide variation in A. thaliana is not low despite the selfing nature of this plant species. On the basis of genomewide AFLP variation, the estimate of nucleotide diversity (0.0106) was comparable to the values reported for specific nuclear genes (Innan et al. 1996; Kawabe et al. 1997). This estimate of nucleotide diversity should be understood as representing variation at the species level. It has been shown that the level of genetic variation between populations is much larger than within populations (Abbot and Gomes 1989; Todokoro et al. 1996; Bergelson et al. 1998). A high level of genetic variation between populations is expected under conditions of limited migration between populations and selfing within the population. Each ecotype has a long branch in the neighbor-joining tree determined in this study, suggesting that each ecotype had isolated history. This result supports the idea of low migration between populations. The topology of the tree suggests that this plant species spread its habitat rapidly over the world, and that since then only limited migration has occurred between habitats. This population structure may explain the higher frequency of singleton bands than that of the simulation, because unique bands could be fixed in isolated finite populations independently.
The average proportion of shared bands found in this study was 83.1% in comparison to the 66% shared bands found by Alonso-Blanco et al. (1998). This difference may be due to the use of different selective primers in the two studies. As noted, the number of total bands and polymorphic bands varies for different primer pairs in this study. To evaluate the overall level of nucleotide variation more accurately by the AFLP technique in the future, it may be necessary to use more selective primer pairs and to use different restriction enzymes in the initial digestion of genomic DNA. In addition, the 38 ecotypes selected for this study may not represent the whole range of actual variation of this species. However, this group of ecotypes is likely to be representative of the species-wide variation in A. thaliana, because the estimate of nucleotide diversity was similar in this and previous studies. It is possible that a study encompassing even more ecotypes would find an even larger nucleotide variation in A. thaliana than the estimate obtained in this study.
Because AFLP analysis detects polymorphisms regardless of their location in the genome, it was expected that the nucleotide diversity estimated by AFLP might be larger than the value determined in specific genic regions. Also, this technique cannot discriminate indel polymorphisms, which might cause the estimate by AFLP to be larger than the true nucleotide diversity. Actually, Innan et al. (1999) showed that estimated nucleotide diversity based on AFLP of Dioscorea tokoto was larger than for specific nuclear gene regions. In this study, the estimated nucleotide diversity of A. thaliana was about the same for AFLP as for nuclear genes (Innan et al. 1996; Kawabe et al. 1997). An explanation for this result is the low GC content and the compactness of the A. thaliana genome. Barakat et al. (1998) showed that the A. thaliana nuclear genome is AT-rich and that gene-coding regions are found at ∼5-kb intervals; long noncoding spacer sequences were not observed. Because the restriction enzymes used in this study, EcoRI and MseI, have AT-rich recognition sequences, it is possible that polymorphism was detected evenly throughout coding and noncoding regions of the A. thaliana genome. In this case, estimated nucleotide diversity is expected to be similar for genome-wide AFLP and studies of specific nuclear genes. Unlike A. thaliana, D. tokoro may have long noncoding spacer sequences, which could have accumulated greater nucleotide variation due to fewer functional constraints. If so, estimated nucleotide diversity based on AFLP could be larger than for specific nuclear genes in D. tokoro. It would be interesting to conduct AFLP analysis on organisms with high GC content, e.g., Drosophila and Gramineae, to study the effect of gene organization and higher GC content on the level of nucleotide variation.
Linkage disequilibrium between AFLP variation: The proportion of significant linkage disequilibria between AFLP variations was not particularly high and is close to the level expected due to random chance if the Fl-3 ecotype is excluded. This result could be due to the long distance between any two AFLP loci. In this study, we detected 472 bands, and the sum of all the band lengths was only ∼106 kb, which is ∼0.1% of the total genome size (∼105 kb) of A. thaliana. This suggests that AFLPs were found at an average interval of ∼200 kb. If AFLPs overlap, this distance could be even longer. Four recombination events were detected in the 2.4-kb region of the Adh gene and one in the 1.7-kb region of ChiA, giving about one recombination per 1 kb in the evolutionary history of this plant. Because the expected number of recombinations would be larger than this estimate (Hudson 1987), there would be a large number of recombination events between each pair of AFLPs identified here. Even if dimorphism exists in a specific region, as in Adh and ChiA, linkage disequilibrium would not be detected by AFLP analysis. It is not surprising that the proportion of significant linkage disequilibria is at about the level expected due to random occurrence. Although selfing means a small effective size and low recombination, the number of recombination events in the evolutionary history of A. thaliana cannot be ignored. Studies of nuclear genes and AFLP indicate that outcrossing does occur in this species and that subsequent recombination events clearly influence the pattern of DNA polymorphism in this selfing plant.
Acknowledgement
We express our thanks to N. Goto for A. thaliana seeds and to T. Sasanuma, R. Terauchi and an anonymous reviewer for comments and suggestions. We are also grateful to S. Nasuda for technical advice. This study is contribution number 557 from the Laboratory of Plant Genetics, Graduate School of Agriculture, Kyoto University.
Footnotes
Communicating editor: J. A. Birchler
LITERATURE CITED
