


Abstract
We present a model for the evolution of paired bases in RNA sequences. The new model allows for the instantaneous rate of substitution of both members of a base pair in a compensatory substitution (e.g., A-U→G-C) and expands our previous work by allowing for unpaired bases or noncanonical pairs. We implemented the model with distance and maximum likelihood methods to estimate the rates of simultaneous substitution of both bases, αd, vs. rates of substitution of individual bases, αs in rRNA. In the rapidly evolving D2 expansion segments of Drosophila large subunit rRNA, we estimate a low ratio of αd/αs, indicating that most compensatory substitutions involve a G-U intermediate. In contrast, we find a surprisingly high ratio of αd/αs in the core small subunit rRNA, indicating that the evolution of the slowly evolving rRNA sequences is modeled much more accurately if simultaneous substitution of both members of a base pair is allowed to occur approximately as often as substitution of individual bases. Using simulations, we have ruled out several potential sources of error in the estimation of αd/αs. We conclude that in the core rRNA sequences compensatory substitutions can be fixed so rapidly as to appear to be instantaneous.
ALTHOUGH ribosomal RNA genes have been extensively used for inferring the phylogeny of distantly related sequences (for reviews see Hillis and Dixon 1991 and Olsen and Woese 1993), several authors have pointed out that these sequences violate an assumption of the methods usually used to do the phylogenetic analysis: that the sites in the sequence evolve independently (Wheeler and Honeycutt 1988; Dixon and Hillis 1993; Tillier 1994; Tillier and Collins 1995; Schoniger and von Haeseler 1994; Muse 1995; Rzhetsky 1995). In rRNA, roughly half of the bases in the sequence are involved in intramolecular base pairs that form the characteristic secondary and tertiary structure required for function (Vawter and Brown 1993; Noller 1984), and the genes are under evolutionary constraint to maintain these pairings. Even though secondary structures are composed mostly of Watson-Crick base pairs, other base combinations are sometimes found: G-U pairs are especially common, and G-U is generally thought to be an evolutionarily stable intermediate in the substitution of a G-C pair with an A-U pair via two consecutive transitions (e.g., Rousset et al. 1991).
To address the complexities imposed by RNA secondary structure, several authors have recently proposed different probability-based models for the evolution of paired bases in RNA sequences (Tillier 1994; Tillier and Collins 1995; Schoniger and von Haeseler 1994; Muse 1995; Rzhetsky 1995). These models vary in the number of possible states a base pair may have, and in the rates of substitution between these states; however, most of these models still assume that the substitution of each base occurs independently of its partner according to a Poisson distribution (pairing is favored in these models by having a higher rate of substitution from unpaired to paired than from paired to unpaired). Compensatory base-pair substitutions (e.g., A-U→U-A) are still assumed to be the result of two independent events; their probabilities in a small amount of time are essentially nil and are therefore disregarded (Muse 1995; Rzhetsky 1995; Schoniger and von Haeseler 1994).
In contrast, we have developed a model for the evolution of double-stranded RNA sequences that allows for the complete evolutionary dependence by permitting the simultaneous substitution of both members of a base pair (Tillier 1994; Tillier and Collins 1995). Our model did not allow for base combinations other than Watson-Crick and G-U base pairs and is therefore not generally applicable for the analysis of actual RNA sequences. Here, we expand our previous model to allow for all possible base combinations. The expanded model permits us to estimate the rates of substitution of individual members of a base pair. More importantly, our model allows us to estimate the rate of simultaneous compensatory substitutions, and thereby test the validity of the commonly-made assumption that simultaneous substitutions do not occur.
Here, we use our expanded model to estimate the rates of substitution of base pairs and of individual bases, using a large data set of published sequences of small subunit (SSU) rRNA. We cannot estimate absolute values of the rate parameters irrespective of time because, in most cases, the true time of divergence is unknown, but we can estimate their relative rates. Of particular interest is the ratio of the rate of the simultaneous substitution of both members of the base pair to the rate of substitution to and from the G-U transitional intermediate. This quantity addresses the question of whether G-U is necessarily an evolutionarily stable intermediate in the substitution between G-C→A-U pairs. We find that this ratio is substantially greater than zero; in fact, the evolution of rRNA sequences is modeled far more accurately if simultaneous substitution of both members of a base pair is allowed to occur approximately as often as substitution of individual bases.
THE MODEL
The description of the probability of substitution of any base combination to any other is mathematically complicated, involving a 16 × 16 matrix and potentially as many rate parameters as there are types of substitutions. Different authors have used different simplifying assumptions to limit the number of independent rate parameters to three or fewer (Muse 1995; Rzhetsky 1995; Schoniger and von Haeseler 1994). In a previous paper (Tillier and Collins 1995), a novel model of base-pair substitution was examined to determine whether the then-current methods of phylogenetic analysis, which assumed that bases evolve independently, are appropriate for analysis of RNA sequences such as rRNA, where this assumption does not hold. We developed a model of base substitution for use with the Neighbor Joining and Maximum Likelihood methods that takes into account the evolutionary dependence of the sites in the molecule. We previously chose to first limit the size of the matrix by only considering A-U, G-C and G-U base pairs, but this led to a very strict definition of a paired site, because any site containing any other base combination would not be considered within this model. An important implication is that there were no unpaired intermediates considered in the model to allow for single base substitutions, except for G-U. Therefore, the model assumed that other unpaired intermediates are eliminated so quickly that both members of a base pair are apparently substituted simultaneously, an event we call a double substitution. In fact, the model proposed an instantaneous rate of double substitution, αd, from A-U to G-C, even when single base transitions at a rate αs through a G-U intermediate were possible. Because all single transversion mutations would disturb base pairing, all transversions were considered double compensatory substitutions, occurring at an instantaneous rate β.
To more accurately describe the evolution of real rRNA sequences, the model previously presented (Tillier 1994; Tillier and Collins 1995) was expanded
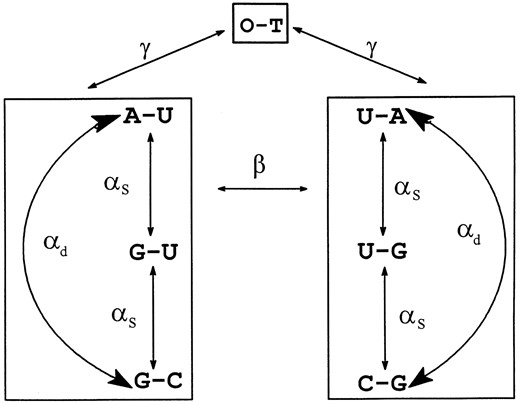
The OTRNA Model. This is a schematic representation of an instantaneous substitution model. There are seven possible states for a site: A-U, G-U, G-C, U-A, U-G, C-G, O-T with frequencies π1, π2, π3, π4, π5, π6, and π7, which are considered to be at equilibrium. We also define π1 + π4 = π8, π2 + π5 = π9, π3 + π6 = π10. The base combinations can be considered in three groups each enclosed by a box. In the first two groups, single transition substitutions occur at a rate αs to or from the G-U base pair and double transition substitutions occur at a rate αd from A-U to G-C and vice versa. Double transversion substitutions occur between these two groups at rate β. All other substitutions occur to and from another combination of bases lumped together as O-T with a rate γ. The αs, αd, β, and γ are the number of substitutions per unit time.
to allow for the occasional occurrence of base combinations other than Watson-Crick and G-U (Figure 1). Because the 16 × 16 matrix of all possible base combinations with three or four rates of substitution become mathematically cumbersome with so many parameters, the model was simplified by collapsing all the other base combinations not considered in the original model as one type called O -T (for “other”) which has an equilibrium frequency OT or π7. Substitutions to or from O-T base combinations are allowed at an equal rate γ. We call this model the Other RNA Model, or OTRNA. This model reduces to our previous model (Tillier 1994; Tillier and Collins 1995), which we will refer to as the RNA Model when π7 = 0. A diagram of the OTRNA Model is given in Figure 1, and the transition probability matrix, derived as in Tillier (1994), is given in Figure 2.
ESTIMATING THE RATIO OF DOUBLE TO SINGLE SUBSTITUTION RATES
Distance estimate: The transition probability matrix allows us to estimate the parameters in the model multiplied by the time of divergence from the observed number of differences between any two sequences. The use of a probability model corrects for multiple substitutions
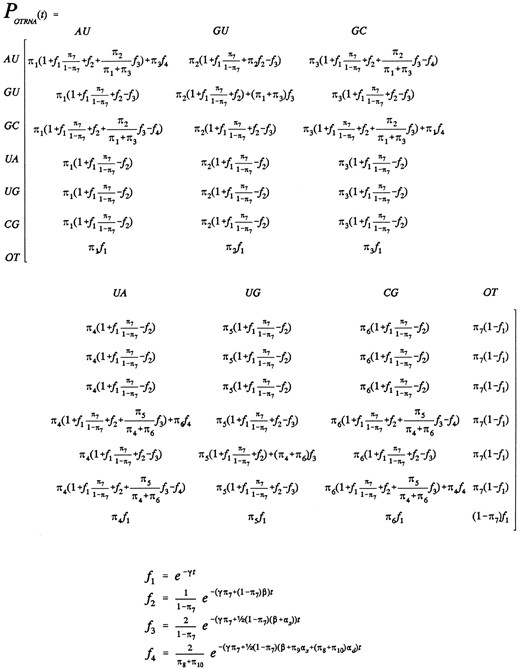
Transition probability matrix for the OTRNA Model.
To estimate αd/αs, we considered a large data set consisting of 473 bacterial and archaebacterial SSU rRNA [from the Ribosomal Database Project (RDP);
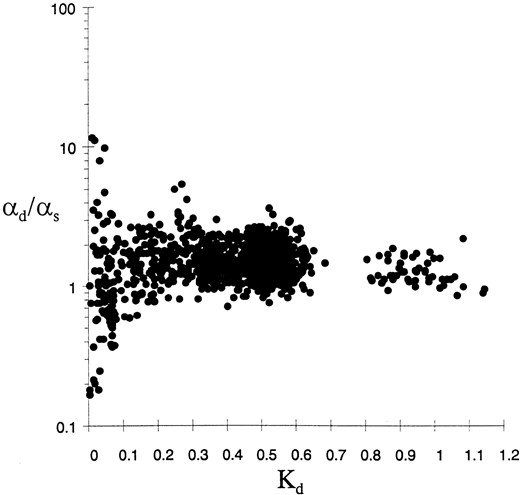
Estimation of αd/αs from SSU rRNA data. The αd/αs estimate is plotted against the estimated distance (Kd) between any two sequences for all the pair-wise comparisons.
Maidak et al. 1996]. The sequences had been aligned with the reference secondary structure of E. coli (Gutell 1994). Only the 461 base pairs that are found in this reference secondary structure are considered. All pair-wise comparisons were done to determine αd/αs. In order to limit the number of comparisons, and because there are wide variations in the base-pair composition of the sequences, suggesting that the base composition of the data set is not at equilibrium, we only considered the pair-wise comparisons of sequences that had similar base-pair composition (i.e., where the base-pair frequencies of A-U, G-U and G-C did not differ by more than 5% between the two sequences in the comparison). The results from the 1044 comparisons are shown in Table 1 and Figure 3.
The estimated αd/αs ratio (1.45 ± 0.77 standard deviation, SD) is substantially greater than zero, and even larger than one. The sample SD is given but it is an underestimate of the true SD and cannot be used to test the significance of that mean. This is because the 1044 estimates are not independent, because the same sequence can be used more than once for different comparisons and because the phylogeny existing between these sequences is disregarded. The variance in the estimate is extremely high at low distances (<0.05) due to the lack of a sufficient number of substitutions to provide an accurate estimate. If the assumption of the OTRNA Model is met by these data, our finding that the rate of apparent simultaneous substitutions of base pairs is greater than the rate of single transition substitutions suggests that a large proportion of double transitions do not go through a G-U intermediate or
Estimates of αd/αs with the OTRNA Model
| No. sequences | Distance estimate | Likelihood estimate | |
|---|---|---|---|
| Eubacteria and archaebacteria | 473 | 1.45 (0.77) | ND |
| Enteric bacteria | 61 | 1.53 (0.80) | ND |
| 10 | 2.34 (0.58) | 2.5 | |
| Ascomycetes (eukaryotes) | 65 | 1.24 (0.64) | ND |
| 10 | 1.22 (0.37) | 0.9 |
| No. sequences | Distance estimate | Likelihood estimate | |
|---|---|---|---|
| Eubacteria and archaebacteria | 473 | 1.45 (0.77) | ND |
| Enteric bacteria | 61 | 1.53 (0.80) | ND |
| 10 | 2.34 (0.58) | 2.5 | |
| Ascomycetes (eukaryotes) | 65 | 1.24 (0.64) | ND |
| 10 | 1.22 (0.37) | 0.9 |
The table summarizes the estimates of αd/αs found with the different data sets using the pair-wise distance method and the likelihood method as described in the text (ND indicates the corresponding analysis was not done). The numbers in parentheses give the standard deviation for the pair-wise distance estimate.
that the G-U intermediate is lost before reaching fixation.
The other interesting rate that can now be estimated with the new model is the instantaneous rate of substitution from unpaired to paired bases (and vice versa) relative to the rate of double transversions. This ratio, β/γ, is estimated to be about 1.15 (SD 0.78). The variance in this estimate is high, and the quantity is difficult to estimate due to the rarity of transversions. Another difficulty with this quantity is that γ is a mixed rate to and from the various O-T base pairs, with most due to transversions and one due to transitions (by the C-A pair).
Possible sources of error in the distance estimate of αd/αs: (1) Inadequate data set: The data set used was large (473 sequences) and quite varied, consisting of sequences from the Eubacteria and Archaebacteria and covering the whole possible range of genetic distances. Because the variance in the estimate of αd/αs increases substantially with lower distances, and to determine whether there was any difference in the estimate of αd/αs from Eukaryotic sequences, we examined two more data sets. The first consisted of 61 Eubacterial sequences, all enteric bacteria aligned to the E.coli sequence. The second set consisted of 65 Eukaryotic sequences, all fungal ascomycetes, aligned to the S. cerevisiae sequence and reference secondary structure (Gutell 1994). All sequences were obtained from the RDP database (Maidak 1996). The range of Kd values for both sequence sets did not exceed 0.3. The estimated αd/αs for the bacterial data set was 1.53 (SD 0.8) and 1.24 (SD 0.64) for the ascomycetes (Table 1). Again, the variance in the estimate is high at the lower distances (not shown). These estimates do not vary substantially from the one previously found for the larger data set of 473 sequences (1.45, SD 0.77), increasing our confidence that αd/αs is greater than zero across all kingdoms.
(2) Lack of consideration of the phylogeny in the distance estimate of αd/αs: Because the estimation procedure used here does not take into consideration the phylogeny, it was necessary to determine whether the approach was valid. This question was addressed by computer simulations. 200 simulations were performed using the RNA Model as in the method described previously (Tillier 1994) following a tree leading to 82 sequences, as shown in Figure 4. The expected amount of divergence between the two most distantly related sequences was set to the very high value of Kd = 1.8, which is approximately the greatest value observed between an archaebacterium and the most distantly related eubacterium. Such a large value of Kd was used in order to magnify the effect of multiple substitutions so as to make it more easily detectable. Several lengths of sequences (numbers of sites) were used with values for the ratio αd/αs of 0 (the value expected if αd = 0) or 1, which is closer to the value that was approximated from the data. The value of αd/β was set to two for these simulations because that is approximately the estimate for this quantity from the real data. The value of αd/αs was then estimated from the sequences by considering all pair-wise comparisons as was done with the real data. The results in Table 2 show that the estimate of αd/αs with this method is indeed a very accurate estimate of the value used to generate the data, even with a small number of sites. Even in the worst-case scenarios of very large distances and few sites, the simulations gave good estimates in situations which would give a high apparent number of double transitions that could possibly lead to an overestimation of αd/αs, suggesting that the pair-wise comparison approach, although crude, is nevertheless a valid one.
(3) Unknown mode of evolution: The real mode of evolution for rRNA sequences is of course unknown, and the OTRNA Model of evolution may be not be an accurate model of real evolution. Others (Schoniger and von Haeseler 1994; Muse 1995; Rzhetsky 1995) have proposed alternate models for the evolution of RNA sequences that do not allow for an instantaneous rate of double substitutions. If sequences actually evolved in ways that more resembled one of these alternate models, or any other way such that an instantaneous rate of double substitutions was not allowed, would our estimation procedure using the RNA Model still nevertheless estimate a large αd/αs? We used the Muse (1995) model for other simulations using the same tree (Figure 4), and again very high distances between the sequences.
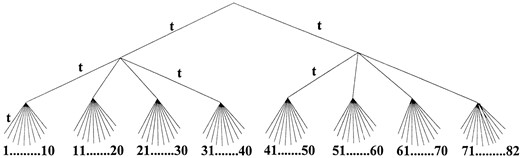
82-species tree used in simulation. The lengths of the internodal branches in the tree are all equal to t, which was set in the simulation such that Kd = 1.8 between sequences 1 and 82.
The transition probability matrix was derived analytically by Rzhetsky (1995), for a more general model than that of Muse (1995), and was used for the simulation procedure. The model considers all 16 dinucleotide pairs but only has one parameter, λ, such that the rate of substitution from Watson-Crick pairs to all others is proportional to 1/λ and the reverse substitution rate proportional to λ. The rate of simultaneous substitution of both members of a dinucleotide pair is zero. We used the simplest version of the model where G-U is considered unpaired, and all base frequencies are equal. This model will yield a larger proportion of Watson-Crick pairs with increasing values of λ. We set λ = 3 for our simulations, which leads to expected equilibrium frequencies for A-U and G-C base pairs (π8 and π10) equal to 0.375, for G-U (π9) equal to 0.0417 and all others (π7) equal to 0.208. Any higher value for λ leads to a frequency of G-U too low to allow an accurate estimate of αs (not shown). The sequences generated were analyzed with the OTRNA Model to estimate αd/αs. The result from 200 simulations is shown in Table 2, where the estimate of αd/αs is found to be essentially zero (−0.044 SD 0.017). The estimate is actually slightly negative because sequences evolved under the Muse
Estimates of αd/αs from simulations
| No. sites | RNA Model | Muse model λ = 3 | |
|---|---|---|---|
| αd/αs = 0 | αd/αs = 1 | ||
| 25 | 0.080 (0.07) | 1.090 (0.35) | ND |
| 50 | 0.032 | 0.990 | ND |
| 75 | 0.013 | 0.987 | ND |
| 100 | 0.010 | 1.058 | ND |
| 200 | −0.001 (0.02) | 1.016 (0.19) | −0.044 (0.02) |
| No. sites | RNA Model | Muse model λ = 3 | |
|---|---|---|---|
| αd/αs = 0 | αd/αs = 1 | ||
| 25 | 0.080 (0.07) | 1.090 (0.35) | ND |
| 50 | 0.032 | 0.990 | ND |
| 75 | 0.013 | 0.987 | ND |
| 100 | 0.010 | 1.058 | ND |
| 200 | −0.001 (0.02) | 1.016 (0.19) | −0.044 (0.02) |
Results of a simulation study investigating the accuracy of the distance method to estimate αd/αs for increasing length of sequence when the RNA Model and the model of Muse (1995) were used to simulate the evolution of sequences following the tree shown in Figure 4. The distance, Kd between the two most distant sequences was ~1.8. The values of αd/αs fixed for the simulations (0 and 1) with the RNA Model are indicated by the column headings. The entries in parentheses indicate the standard deviation of the estimated αd/αs for 200 replicates. ND, not done.
model show fewer double changes that would be expected to be observed had sequences evolved under our model (even with αd = 0). The simulations therefore show that our method is robust, as they do not overestimate the value of αd/αs, even when the sequences have evolved following a very different model that does not allow for instantaneous double substitutions.
(4) Variable selection against G-U base pairs: Although the method seems to accurately take into account multiple substitutions at the sites, an uneven amount of selection against G-U base pairs at different sites in the sequence could create a systematic bias in the estimate of αd/αs. If some sites allow G-Us and others do not at all, then there are two types of sites in the molecule; sites at which G-Us are allowed and where transitions proceed mostly through G-U intermediates (type I sites), and sites where all substitutions are double (type II sites). We chose to investigate the degree of error in the estimate resulting from variable selection against G-U pairs using only the RNA Model because the effect would be more severe when O-T base pairs (particularly A-C, the other possible transitional intermediate) are not allowed. At type II sites, this model is equivalent to Hasegawa's two-parameter model (Hasegawa et al. 1985), where the rate of transition is αd, the rate of transversion is β, and where we can have A-U, G-C, U-A or C-G rather than A, G, U or C at each site. Treating type I and type II sites separately allows for more accurate estimates of the parameters in the models if the number in each type of site is large enough.
It was possible to analytically determine the expected error in the estimate of αd/αs. This was performed by finding the expression for αd/αs when type I and type II sites are considered separately, and comparing it to the expression for the αd/αs obtained when the sites are all considered together. The relative error (the difference between the overestimate and the true value, divided by the latter) is plotted in Figure 5 against an increasing number of Type II sites and an increasing expected distance Kd between the sequences. The error and its standard deviation were also obtained by simulation. The graph shows that the relative error in the estimate of αd/αs is always less than 10%.
Maximum likelihood estimate: An independent way of estimating αd/αs is with Maximum Likelihood. The
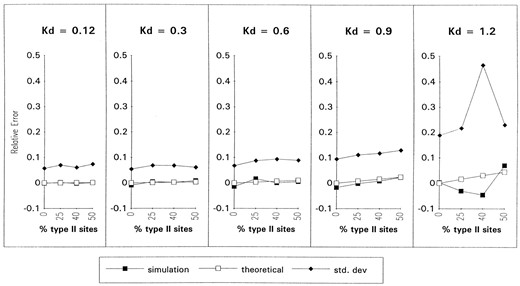
Relative error in the estimate of the αd/αs ratio. This graph shows the systematic overestimation of the αd/αs ratio due to variable selection against G-U base pairs at different sites in the sequence. Each uninterrupted line in the graph corresponds to the error in the estimate obtained analytically (labeled theoretical in the legend) and with simulations or the standard deviation obtained by simulations, against an increasing proportion of type II sites (where G-U base pairs are not tolerated) in the 300 base-pair sequence (i.e., each point corresponds to 0, 75, 120 or 150 type II sites in the 300 base-pair sequence, while the remainder are type I sites). There is one set of these graphs for an increasing amount of expected divergence between the two sequences.
likelihood ratio test, in which we compare a general model (either the RNA Model or the OTRNA Model) to a restricted model constructed by setting the αd/αs ratio to a constant. Interestingly, the restricted model, where αd/αs is fixed, does not have the mathematical properties of the more general model as described in Tillier (1994) that would allow us to use the EM maximization algorithm. A combination of Newton's method and the steepest descent method was therefore used for the maximization procedure.
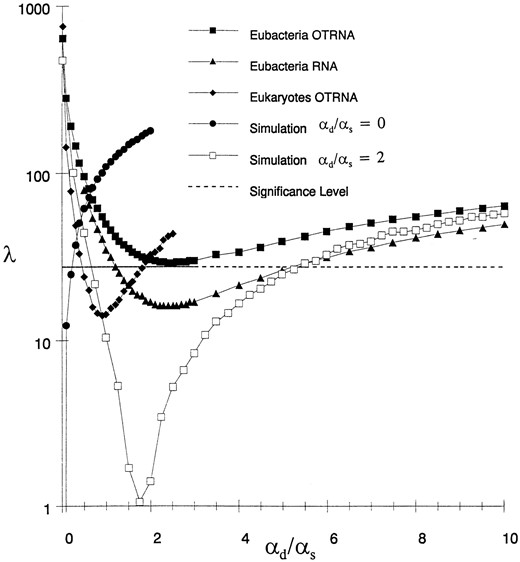
Ten eubacterial sequences (Escherichia coli, Buchera aphidicola, Citrobacter freundii, Erwinia herbicola, Serratia marcescens, Hafnia alvei, Rahnella aquatilis, Yersinia enterocolitica, Proteus vulgaris, and Plesiomonas shigelloides strain M51; all enteric bacteria), chosen to be similar to the E. coli reference sequence to minimize changes in structure, were analyzed with the Maximum Likelihood approach. Another set of sequences, all fungal ascomycetes (Saccharomyces cerevisiae, Blastomyces dermatitidis, Coccidioides immitis, Aspergillus fumigatus, Aureubasidium pullulans, Podospora anserina, Neurospora crassa, Colletotrichum gloesporioides, Torulaspora delbrueckii, and Schizosaccharomyces pombe; aligned with the reference secondary structure of S. cereisiae), was also analyzed to determine whether the αd/αs estimate would also be large in the eukaryotic kingdom. The phylogenies and secondary structures for both sets were assumed to be those in the RDP database. The results of the likelihood ratio tests between the restricted models and the general model are plotted in Figure 6 for increasing values of the (fixed) αd/αs. Also plotted in Figure 6 are the results of a similar analysis performed using the OTRNA Model on two data sets obtained by simulation as in Tillier and Collins (1995). For the simulation analysis, sequences of similar length and base-pair frequencies to the eubacterial data set were generated under the same tree topology and with similar branch lengths as the real data tree. For the simulation, the OTRNA Model was restricted by setting αd/αs equal to either 0 or 2. The 95% confidence level is also shown on the graph, indicating the level below which the restricted model is not statistically different from the general model in explaining the data (i.e., the values when the fixed αd/αs yields a maximum likelihood that is not significantly different when αd/αs is allowed to vary).
The curves for the analyses of both the bacterial and eukaryotic sequence data clearly show that αd/αs > 0 because fixing it at zero gives a significantly worse likelihood in all cases. This was observed no matter whether O-T base pairs are considered or not. The fixed αd/αs
Likelihood Ratio Tests. The graph shows the likelihood ratio statistic λ with increasing values of fixed αd/αs with several data sets of 10 sequences each.
that yielded the minimum value for the likelihood ratio with the eubacterial data set was at 2.3 using the RNA Model and 2.5 using the OTRNA Model. This is very close to the estimate of 2.3 obtained with the pair-wise distance method described above on this same data set modeled using the OTRNA Model. For the eukaryotic sequences, the minimum value of the likelihood ratio is found to occur at an αd/αs value of 0.9, also close to the value of 1.22 obtained using the pair-wise distance method. It is remarkable that the minima found for these curves are at or below the 95% confidence level, which implies that the αd/αs estimates are quite uniform from branch to branch, such that a uniformly imposed value is statistically justifiable.
The simulation curves in Figure 6 show that the method is valid, as the minima for these curves are very close to the value of αd/αs used in generating the data. Particularly telling is the extremely rapid rise in the likelihood ratio with increasing value of the estimated αd/αs when this ratio was actually set at zero in the simulation. This shows the likelihood method's ability to accurately estimate αd/αs when this quantity is zero. The minima in the curves for the simulated data sets fall well below the 95% confidence level as would be expected with simulated data being not as variable as real sequences, because in this case the only source of variation is due to sampling.
Interestingly, the value of αd/αs is estimated to be slightly higher when the OTRNA Model is used instead of the RNA Model, a phenomenon that is also observed when the distance method is used (data not shown). We would have expected the reverse result, as the OTRNA Model allows for the other transitional intermediate, C-A, whereas the RNA Model does not. The phenomenon may simply be because, when O-T base pairs are included, the relative frequency of G-U pairs is lowered and thus serves to increase the estimate of αd.
Degree of independence and the effective number of sites: From the value of the rate parameters in the model we can obtain an estimate of the effective number of sites Ke, i.e., the length of an equivalent sequence to the one considered if all sites were evolving independently.
DISCUSSION
The models we have proposed allow for instantaneous rates of simultaneous substitution of both members of a base pair. It is often assumed that such rates, describing the probability of two concurrent unlikely events, are small enough to be negligible (Schoniger and von Haeseler 1994; Muse 1995; Rzhetsky 1995). However, analyzing rRNA sequences with our models, we found estimates of the apparent instantaneous double substitution rates relative to the rates of single substitution to be far from negligible. In fact, we found that, on average, the rate of double substitution was at least as large as the rate of single substitution.
We investigated several potential sources of error in estimating these rates, including the possibility that single base substitutions, over long periods of time, along with a low frequency of G-U base pairs, could lead to an overestimate of the rate of double transitions, particularly when the phylogenetic relationship between the sequences is disregarded. From simulation results (Figure 6 and Table 2), using sequences evolved under our model and that of Muse (1995) where instantaneous double substitutions were not allowed, it is clear that the methods are accurate in their estimates, even under the unfavorable conditions we described. Additionally, both likelihood and distance methods of obtaining the estimate of αd/αs with several sets of actual sequence data gave very similar results: αd/αs is much greater than zero.
The OTRNA Model, although more general than the previously proposed RNA Model (Tillier 1994; Tillier and Collins 1995), is still a very simplified description for the evolution of double-stranded RNA sequences. It does allow for all base combinations that could be intermediates between compensatory Watson-Crick substitutions and is therefore more useful for the estimation of the ratio of double vs. single substitution rates. One drawback of the OTRNA Model is that O-T to O-T base-pair substitutions are not considered as changes; however, a site at which O -T to O-T substitutions are frequent would probably be better described with a single-stranded model.
Another simplification of our model is the assumption that substitutions from paired sites to unpaired sites (or to G-U) and vice versa are considered to have the same rate (either αs or γ) in either direction. In contrast, the models of Muse (1995) and Rzhetsky (1995) include the realistic assumption that losing a pairing would occur at a slower rate than gaining one back if the unpaired bases are selectively detrimental. However, their models make the assumption that the simultaneous substitution of both members of a base pair does not occur, which is not necessarily valid according to our analysis.
The present study and those of Muse (1995), Rzhetsky (1995), and Schoniger and von Haeseler (1994) are attempts to deal with the problem of base pairing in RNA sequences that go much further than the first analysis of Wheeler and Honeycutt (1988), who concluded that the pairings should be weighed by half or disregarded altogether. Dixon and Hillis (1993) gave a more sophisticated method for weighing the double-stranded sites that did not use a probability model. In this paper, we have shown how our probability model can also give an estimate of the degree to which the substitution of one member of a base pair is independent of its partner (Equation 4). This independence factor (ki) could be thought of as a weighing factor for the double-stranded sites. We would not recommend using ki as a weighing factor in a phylogenetic analysis, but it can be used to evaluate the degree of constraint in the RNA sequences due to the need to maintain pairing and thus the structure of the RNA. Multiplying the weighing factor by the number of bases in the sequence gives an estimate of the equivalent number of independently evolving sites in the molecule. In a previous paper (Tillier and Collins 1995), we showed that the confidence in the trees obtained in phylogenetic analyses is reduced when a double-stranded model is used, and this is largely due to the reduced number of effective sites.
The models proposed here for the double-stranded regions could be used in conjunction with other models for the single-stranded regions of the RNA in distance and maximum likelihood analyses for phylogenetic purposes. Rzhetsky (1995) and Muse (1995) combined models in this manner, and also included variation in rates at different sites along the molecule.
Rousset et al. (1991) analyzed the Drosophila large subunit rRNA D1 and D2 expansion segments sequences and concluded that A-U to G-C substitutions almost always go through a G-U intermediate. We performed a distance analysis using the OTRNA Model on the D2 segments (obtained from GenBank) and found that αd/αs is indeed low (0.17 SD 1.8), which agrees with the interpretation that the majority of A-U to G-C substitutions in these sequences involves a G-U intermediate. On the other hand, our analysis on the core of SSU rRNA sequences revealed a high αd/αs (approximately ≥1), suggesting that the majority of compensatory substitutions between Watson-Crick base-pairs does not involve a stable G-U intermediate. Our results provide direct support for the suggestion by Rousset et al. that conclusions based on rapidly evolving expansion segments should not be extrapolated to the slowly evolving core segments of rRNA. Although the secondary structure of the expansion segments appears to be conserved in Drosophila species, noncompensatory substitutions may be more tolerated by natural selection and therefore more evolutionarily stable than in the core rRNA. The degree of selective constraint on secondary structure will determine the evolutionary stability of noncompensatory, single substitutions. Indeed, we find that for the Drosophila D2 expansion segments, ki = 0.86, indicating that the members of the base-paired sites in these sequences are on average evolving more independently than in core SSU rRNA sequences (where ki = 0.65). Rousset et al. conclude from their study that a model of compensatory substitution that allows G-U intermediates is correct, but we find that such a model is too restrictive if it does not also allow for double substitutions that do not require any stable intermediate.
The rates estimated in this paper are substitution rates and therefore do not yield information on which, if any, of the many evolutionary forces (mutation, selection or drift) is dominant in bringing about the rapid rates of compensatory base-pair substitutions that are observed. High compensatory substitution rates could possibly be due to an increased mutation rate due to the palindromic nature of the stems in the RNA and, thus, in the coding DNA sequence, and to the phenomenon of templated mutations (see Golding 1987), although it is difficult to envision such a process in the case where paired sites can be separated by several hundred nucleotides. Alternatively, work by Kimura (1985) and more recently by Stephan (1996), using population genetic models, have shown that compensatory mutations can quickly become fixed in a finite population when recombination rates are low, as is the case within genes. A low frequency of deleterious or slightly deleterious intermediates may be present long enough for compensatory mutations to appear without the intermediates themselves ever being fixed. A high rate of substitution on a microevolutionary scale would appear instantaneous on a macroevolutionary scale.
Acknowledgement
We thank two anonymous reviewers for their constructive comments. Parts of this work were supported by a Natural Sciences and Engineering Research Council of Canada (NSERC) postgraduate scholarship to E.T. Support was also provided by an NSERC research grant to R.C. R.C. is a fellow of the Canadian Institute for Advanced Reserach Program in Evolutionary Biology.
Footnotes
Communicating editor: G. Brian Golding
LITERATURE CITED
