


Abstract
Variation in social behavior and plumage in the white-throated sparrow (Zonotrichia albicollis) is linked to an inversion polymorphism on chromosome 2. Here we report the results of our comparative cytogenetic mapping efforts and population genetics studies focused on the genomic characterization of this balanced chromosomal polymorphism. Comparative chromosome painting and cytogenetic mapping of 15 zebra finch BAC clones to the standard (ZAL2) and alternative (ZAL2m) arrangements revealed that this chromosome is orthologous to chicken chromosome 3, and that at a minimum, ZAL2 and ZAL2m differ by a pair of included pericentric inversions that we estimate span at least 98 Mb. Population-based sequencing and genotyping of multiple loci demonstrated that ZAL2m suppresses recombination in the heterokaryotype and is evolving as a rare nonrecombining autosomal segment of the genome. In addition, we estimate that the first inversion within the ZAL2m arrangement originated 2.2 ± 0.3 million years ago. Finally, while previously recognized as a genetic model for the evolution of social behavior, we found that the ZAL2/ZAL2m polymorphism also shares genetic and phenotypic features with the mouse t complex and we further suggest that the ZAL2/ZAL2m polymorphism is a heretofore unrecognized model for the early stages of sex chromosome evolution.
CHROMOSOMAL polymorphisms and their role in adaptive evolution have been of long-standing interest to geneticists. The most intensively studied chromosomal polymorphisms are inversions. Polymorphic inversions were detected in Drosophila in the early 20th century (Krimbas and Powell 1992) and have subsequently been reported in many other species (White 1973). One of the key genetic attributes of an inversion is its ability to suppress recombination between the inverted and noninverted segment in the heterokaryotype. In the case of a pericentric inversion, suppression of recombination occurs due to a physical disruption of the pairing between the inverted and noninverted segments, as well as because single recombinants within the inverted segment result in unbalanced (duplicated and deleted) gametes that in general cannot give rise to viable offspring. As a consequence, gene flow ceases between the inverted and noninverted segments, allowing these regions to become genetically isolated and to diverge from one another. A second consequence of recombination suppression is that the alleles for all the genes contained within the inversion will segregate as a single unit.
Over the past several decades two main hypotheses have been put forward to account for the adaptive value of inversions. First, the position-effect hypothesis posits that an inversion could directly affect genes at or near the inversion breakpoints, for example, by changes in gene expression patterns, leading to the creation of beneficial alleles (Sperlich 1966). Second, due to the suppression of recombination in heterokaryotypes, an inversion can result in an adaptive advantage by maintaining or fostering beneficial epistatic interactions between co-adapted alleles of two or more genes as a gene complex (supergene) (Dobzhansky 1970) or simply by capturing two or more locally adapted alleles (Kirkpatrick and Barton 2006). Moreover, once established, the supergene can increase its fitness by progressively expanding to recruit additional beneficial alleles (Darlington 1939; Mather 1955). For example, the t complex, which is a balanced chromosome polymorphism in the mouse, is composed of a set of adjacent inversions that are hypothesized to have been sequentially added to the complex as a mechanism to recruit new alleles and increase the fitness of that supergene (Hammer et al. 1989).
In addition to recruiting beneficial alleles, the suppression of recombination in the heterokaryotype along with prolonged periods of heterozygosity makes polymorphic inversions prone to the accumulation of deleterious recessive mutations. For example, a number of recessive lethal mutations have been mapped within the t complex (Klein et al. 1984). The most extreme example of prolonged heterozygosity and lack of recombination are the heterogametic Y and W sex chromosomes, which, due to a variety of forces caused by the lack of recombination, will ultimately genetically deteriorate (Charlesworth and Charlesworth 2000). Indeed, inversions that suppress recombination between proto-Y and X chromosomes are implicit in models of how sex chromosomes can evolve from ordinary autosomes (Ohno 1967). Chromosomal inversions therefore have unique and established genetic characteristics that can have a profound influence on the evolutionary process.
The first chromosomal polymorphisms discovered in birds were a pair of putative pericentric inversions on the second and third chromosome in the North American migratory songbird, the white-throated sparrow (Zonotrichia albicollis: order Passeriformes, family Emberizidae) (Thorneycroft 1966). At the time, it was already established that a balanced plumage polymorphism was present in this species, such that approximately one-half the population had a white stripe on their crown, while the other half of the population had a tan stripe (Lowther 1961). It was further noted that sexual selection maintains this polymorphism in the population via a strong disassortative mating preference (Lowther 1961) such that 96% of observed breeding pairs are composed of birds from both morphs (Falls and Kopachena 1994). Thorneycroft (1966, 1975) found that the arrangement of the second chromosome, designated the M (metacentric) and then 2m (referred to here as ZAL2m), was always present in white-striped (WS) individuals and absent in the tan-striped (TS) individuals, thereby demonstrating that the white stripe is inherited as a dominant trait linked to ZAL2m. Thorneycroft's (1975) detailed population-based cytogenetic study also revealed that WS birds were almost exclusively ZAL2/ZAL2m heterozygotes (217/218), whereas only one WS bird was found to be homozygous for ZAL2m. The virtual absence of birds homozygous for ZAL2m is caused at least in part by the low frequency (∼2.5%) of WS × WS breeding pairs (Falls and Kopachena 1994). Alternatively, Thorneycroft (1975) suggested that the lack of ZAL2m homozygotes could also be attributed to the accumulation of one or more recessive lethal mutations on the inverted chromosome. In either case, the disassortative breeding pattern provides the mechanism by which ZAL2m is maintained as a balanced chromosomal polymorphism in this species.
Behavioral studies of the white-throated sparrow have revealed a remarkable correlation between the plumage coloration and distinct reproductive strategies and social behaviors. Both WS males and females sing more than their sex-matched TS counterparts (Falls 1969; Kopachena and Falls 1993a). WS males defend their territories more aggressively than TS males (Kopachena and Falls 1993a; Collins and Houtman 1999) and are more likely to intrude into the territories of other males (Tuttle 2003). WS females are more likely to perform courtship displays, and WS males are more likely to engage in copulation outside the social pair bond (Tuttle 2003). TS birds of both sexes feed young more often during the parental phase of the breeding season than do WS birds (Knapton and Falls 1983; Kopachena and Falls 1993b). WS males and females thus exhibit behavior that is more male like than their sex-matched TS counterparts. Alternative behavioral strategies are sometimes characterized by measurable endocrine and neuroendocrine differences between phenotypes (reviewed in Knapp 2003; Spinney et al. 2006), and such differences have been detected between the morphs (Maney et al. 2005; Spinney et al. 2006; Lake et al. 2008). The neuroendocrine differences between the plumage morphs therefore suggest a robust but complex mechanism underlying polymorphic social behavior in this species and represent a fascinating example of sex-chromosome-independent differentiation of behavior.
As the white-throated sparrow provides a natural genetic model of polymorphic social behavior and a potential rare example of a nonrecombining vertebrate autosomal segment, this species is a compelling target for comprehensive genomic characterization. Here we report the initial modern genomic characterization of ZAL2m, describe the similarities of the ZAL2/ZAL2m balanced polymorphism to the t complex, and discuss the potential of this system as a model for sex chromosome evolution and for dissecting the genetic basis of social behavior.
MATERIALS AND METHODS
Animals:
All procedures involving animals were approved by the Emory University Institutional Animal Care and Use Committee. White-throated sparrows were collected in mist nets on the campus of Emory University in Atlanta during November and December 2005 and 2006. A small blood sample was taken from a wing vein and sex was confirmed by PCR using primers P2 and P8 of Griffiths et al. (1998). Morph was determined according to criteria described in Watt (1986) and Piper and Wiley (1989) and confirmed by PCR using the method described in Michopoulos et al. (2007). The birds were housed in the Emory animal care facility in walk-in flight cages and supplied ad libitum with food and water.
Cell culture:
White-throated sparrow fibroblast cell cultures were established from a tissue homogenate produced by manual and enzymatic digestion using a protocol adapted from Itoh and Arnold (2005). Kidney tissue was washed in 5 ml complete media [MEM (Invitrogen/Gibco, Carlsbad, California) enhanced with 0.6% glucose, 10% heat-inactivated fetal bovine serum (Invitrogen/Gibco), 5000 units/ml penicillin and 5 mg/ml streptomycin (Invitrogen/Gibco), and 10% chicken serum (Sigma-Aldrich, St. Louis)], manually minced, and resuspended in 0.5 ml PBS (Invitrogen/Gibco). Cells were incubated with collagenase B for 15–30 min at 37°. To ensure complete homogenization, the tissue suspension was suctioned through a Pasteur pipette and supplemented with 10 ml of complete media. Cultures were incubated at 37°.
Metaphase chromosome preparations:
When the cultures reached 80% confluency, KaryoMAX colcemid (30 ng) (Invitrogen/Gibco) was added and the cells were incubated overnight at 37° for 12–16 hr. Additional colcemid (0.5 μg) was added, and the cells were further incubated for 3–4 hr. The cells were trypsinized from the surface of the flask using TrypLE Express (Invitrogen/Gibco) for 15 min at 37°. Cells were rinsed with 1.5 ml of media and centrifuged, and the pellet was suspended in KCl:sodium citrate (60:40; 0.075 m:0.27 m) hypotonic solution and incubated for 20 min at 37°. The cells were then treated with 1 ml of methanol:glacial acetic acid (3:1; 100%:17.4 n) fixative, centrifuged, and resuspended in 10 ml fixative. This final step was repeated two times before metaphase slide preparation.
Identification of zebra finch BAC clones:
Zebra finch BAC clones for use in the fluorescence in situ hybridization (FISH) studies are listed in Table 1 and were identified either by direct screening of a zebra finch genomic library or by comparative mapping of zebra finch BAC-end sequences to the chicken genome. Hybridization screening using overgo probes was performed on the TG_Ba zebra finch genomic library (Luo et al. 2006) as described in Thomas et al. (2002). The probes used to screen the library were either “universal” overgo hybridization probes derived from sequences conserved between chicken and humans (Kellner et al. 2005) or species-specific probes designed on the basis of zebra finch whole-genome shotgun sequences generated at the Washington University Genome Sequencing Center and downloaded from the Trace Archive at NCBI (http://www.ncbi.nlm.nih.gov/Traces/trace.cgi?). Zebra finch BAC-end sequences from the TA_Ba and TGMCBa (https://www.genome.clemson.edu/) libraries were downloaded from NCBI and mapped to the chicken genome (galGal3) (Hillier et al. 2004) by MEGABLAST searches. Prior to their use as a probe in the FISH studies, the identity of each BAC clone was confirmed. In the case of the clones isolated by screening the genomic library, complete sequencing and/or secondary hybridization was performed, whereas BAC clones identified by BLAST searches were confirmed by PCR. The overgo probe and PCR primer sequences used to identify and/or confirm the BAC clones are available from the authors upon request.
Zebra finch BAC clones used for cytogenetic mapping
Clone name | Library | Genea | Orthologous position in the chicken genomeb | GenBank accession or trace internal identifier no. |
|---|---|---|---|---|
| 187L05 | TG_Ba | ARHGAP21 | Chromosome 2: 16,718,745–16,861,796 | AC148570.2 |
| 13O3 | TG_Ba | ANKIB1 | Chromosome 2: 22,537,415–22,690,751 | AC148379.2 |
| 156C22 | TGMCBa | C20orf74 | Chromosome 3: 3,687,583–NA | 1290208116 |
| 94A01 | TG_Ba | Chromosome 3: 8,004,343–NA | 908596196 | |
| 77A01 | TG_Ba | Chromosome 3: 19,353,357–NA | 908596257 | |
| 56A01 | TG_Ba | Chromosome 3: 20,528,587–20,641,054 | 908596265 and 908596251 | |
| 300O4 | TG_Ba | T | Chromosome 3: 44,726,054–44,838,315 | AC154073.2 |
| 13A01 | TG_Ba | Chromosome 3: 49,895,964–NA | 908596109 | |
| 21H11 | TGMCBa | Chromosome 3: 61,431,610–61,663,590 | 1277186752 and 1277186958 | |
| 352K13 | TG_Ba | TRMT11 | Chromosome 3: 62,158,404–62,162,644 | NA |
| 91E01 | TGMCBa | DSE | Chromosome 3: 66,430,196–NA | 1277187497 |
| 120H07 | TGMCBa | Chromosome 3: 71,135,240–71,290,704 | 1290207418 and 1290206795 | |
| 64A01 | TG_Ba | Chromosome 3: NA–79,240,792 | CZ550179 | |
| 71A01 | TG_Ba | Chromosome 3: 81,966,117–82,080,690 | 908596235 and 908596264 | |
| 5K13 | TG_Ba | FAM83B | Chromosome 3: 90,507,078–90,508,264 | NA |
| 55A01 | TG_Ba | Chromosome 3: NA–101,927,610 | CZ550161 | |
| 258I11 | TG_Ba | SUPT3H | Chromosome 3: 112,085,047–112,228,350 | AC159936.2 |
NA, not available.
Gene names are listed for BAC clones that fully or partially contained loci included in the population-based sequencing and/or genotyping studies.
The orthologous positions of the zebra finch BAC clones in the chicken genome were based on alignments of zebra finch complete BAC or BAC-end sequences to the chicken genome assembly (galGal3). In the case of clones 352K13 and 5K13, the orthologous position was estimated on the basis of the location of the hybridization probes used to identify those BACs.
FISH analysis:
BAC DNA was isolated from overnight cultures with the appropriate antibiotic using an alkaline lysis procedure or an automated extraction system (Autogen, Holliston, MA). Fluorescently labeled nucleotides [spectrum orange-dUTP, spectrum green-dUTP (Abbott Molecular, Des Plaines, IL) or diethylaminocoumarin-5-dUTP (PerkinElmer Life Sciences, Boston)] were incorporated into the BAC DNA using a standard nick translation or random priming reaction. Chicken chromosome painting probes (Griffin et al. 1999) were kindly provided by H. Tempest and D. K. Griffin and were labeled using 0.5 μl of secondary PCR products and fluorescent nucleotides in a standard random priming reaction. Slides were baked at 73° for proper aging, washed in 2× SSC at 37° for 30 min, and dehydrated sequentially in 70, 80, and 95% ice-cold ethanol. Chromosomes were denatured in 70% formamide/2× SSC at 75° for 30 sec and then dehydrated as before. Prior to hybridization, probes were denatured at 75° for 7 min and reannealed at 45° for 1–10 min. Chromosome spreads were hybridized for 36 hr at 37°. Slides were washed in 0.4× SSC/0.3% NP-40 at 75° for 2 min, washed in 0.2× SSC/0.1% NP-40 at room temperature for 30 sec, and counterstained with DAPI for 3 min. Slides were mounted in VectaShield antifade solution (Vector Laboratories, Burlingame, CA) and analyzed using digital imaging with a CCD camera and software (SmartCapture 2, Digital Scientific, Cambridge, UK).
Genomic DNA:
Genomic DNA used in this study was extracted from blood and/or other tissues. The Z. querula and Z. leucophry tissue samples were kindly provided by The Burke Museum of Natural History and Culture.
DNA sequencing:
PCR primers were designed from zebra finch genomic or cDNA sequence with three or fewer mismatches compared to the orthologous chicken sequence. A complete list of the PCR primers used in this study along with the orthologous positions in the chicken genome and specific annealing temperatures are listed in Table 2. PCR reactions for each locus were performed in a 25-μl reaction volume, including ∼75 ng of genomic DNA, 1.5 units of Taq DNA polymerase (Invitrogen), the manufacturer's buffer (−MgCl2), 20 pmol of each primer, 0.2 mm dNTPs, and 1.5 mm MgCl2. The PCR cycle conditions included an initial denaturing step at 94° for 5 min, followed by 35 cycles of 94° for 30 sec, 55° or 58° for 30 sec, and 72° for 1 min, and ending with a final 7-min extension at 72°. PCR amplicons were treated with shrimp alkaline phosphatase and exonuclease I (USB) and then directly sequenced with the PCR primers or internal primers as needed.
PCR primers used for sequencing and/or genotyping
Gene | Orthologous position in the chicken genomea | Forward primer | Reverse primer | Annealing temperature |
|---|---|---|---|---|
| ARHGAP21 | Chromosome 2: 16,833,935–16,835,090 | AGGCATCACCAAACACTTCTG | CTTTAATTCGGCGACAACTTTC | 58° |
| ANKIB1 | Chromosome 2: NA–22,542,469 | TTCCATTGTCTGTTGCCTAATGb | AGCCTTACTGCTCTTTCACAGC | 58° |
| C20orf74 | Chromosome 3: 3,692,168–3,693,752 | CCTGGGATAGAAGGTAGGAAGAG | AAATCTTCATAGGCCTGGCTTC | 58° |
| THADA | Chromosome 3: 26,317,068–26,318,103 | TAGTTTGGTCATGGTTCCCTTC | TGCATCAGTCTTGTTGTCTTTG | 58° |
| MAP3K4 | Chromosome 3: 47,163,649–47,164,047 | TGCTAAGCTTCCAGTCTCTGTG | GATTTGCAAACTCCTTCTCCTG | 58° |
| ESR1 | Chromosome 3: 51,039,397–51,041,118 | AGCACCTTGAAATCTCTGGAAG | ACTGCAAGGAATGAGATGAAGC | 58° |
| ESR1 | Chromosome 3: 51,041,096–51,041,395 | AGCTTCATCTCATTCCTTGCAG | AAGTTAGCCAGACAATCCTTGC | 55° |
| VIP | Chromosome 3: 51,393,113–51,393,983 | ACTGACAACTACAGCCGCTTTC | CAAGATGTTCTGCTTCATCTCG | 55° |
| REPS1 | Chromosome 3: 56,093,603–56,094,561 | CAGACTTCAGCCAGTTTGAGG | CATCTGCTTTGGCAACTCTAAG | 58° |
| TRMT11 | Chromosome 3: 62,161,143–62,162,631 | TCCTTCAGAAGAGATGGCAAG | GTTCTTCAAAGATGCATAGAGC | 58° |
| DSE | Chromosome 3: 66,486,488–66,486,849 | GAAGGACTACGTAGGGATCGTG | CCTCATCTTCATCTACAGGCAAC | 58° |
| CGA | Chromosome 3: 79,317,477–79,319,113 | CCAGATGGAGAGTTTCTCATGC | GTCTTCTTGGACCTCATTGGAG | 55° |
| FAM83B | Chromosome 3: 90,508,586–90,509,023 | TTCCTTGGCTTCAGTTTCTAGC | GCAAGATTTACCTTTGGTCGTG | 58° |
| SUPT3H | Chromosome 3: 111,942,733–111,943,480 | CAGATATGGCATGACTGAATGG | CTGACAGCAAAGAAAGCATCC | 58° |
NA, not available.
Coordinates are based on the galGal3 assembly of the chicken genome.
Primer sequence from Z. albicollis.
DNA sequence analysis:
Nucleotide polymorphisms were automatically called using SNPdetector (Zhang et al. 2005) and manually reviewed prior to further analyses. Annotation of gene features was lifted from the available information from the chicken genome. Multiple sequence alignments of each loci were carried out with the MUSCLE program (Edgar 2004), followed by manual inspection to check for potential errors. To estimate sequence haplotypes and assign variants to ZAL2 or ZAL2m chromosomes, the genotypes of the variable positions in the six WS and four TS birds were analyzed with the program PHASE version 2.1 using default parameters (Stephens et al. 2001). For loci physically linked to ZAL2 and ZAL2m, a fictitious biallelic position was added in heterozygosis (WS) or homozygosis (TS) to account for the presence of the ZAL2m arrangement. In each case, at least two independent PHASE runs were done, and only positions that could be reliably assigned to a particular haplotype were included in the analysis. Population genetic measures on either raw genotypes or estimated haplotypes were calculated by using the DnaSP version 4.10 software (Rozas et al. 2003), except for the FST values between ZAL2 and ZAL2m arrangements, which were calculated with the Arlequin version 3.01 program (Excoffier et al. 2005). Phylogenetic trees were obtained with the neighbor-joining method based on the Kimura two-parameter distances (Kimura 1980) from 100 or 1000 bootstrap replicates using the PHYLIP software package (http://evolution.genetics.washington.edu/phylip/doc/main.html) (Felsenstein 2004), and similar results were obtained using the UPGMA and maximum-likelihood methods. Branch lengths were calculated using the BASEML module of the PAML program (Yang 1997).
Molecular dating:
DNA sequences of the mitochondrial cytochrome b (CYTB) and cytochrome c oxidase subunit I (COX1) genes were retrieved from GenBank for Junco hyemalis (accession no. DQ432957.1 and AF290161.1), Z. albicollis (accession no. DQ434837 and AF284076.1), Z. querula (accession no. DQ434242.1 and U40173.1), and Z. leucophrys (accession no. DQ434845.1 and AF305744.1), and aligned with ClustalW (Jeanmougin et al. 1998). Pairwise divergence and standard deviations were derived with Kimura's two-parameter model as implemented in MEGA (Kumar et al. 2004) and used to estimate the divergence times between Z. albicollis and the other three species assuming a divergence rate of 0.02 nucleotide substitutions/million years (Klicka and Zink 1997). The resulting dates were similar to that reported previously (Zink et al. 1991). The age of the ZAL2m arrangement was computed as the product of the divergence time between Z. albicollis and J. hyemalis and the ratio of the net number of nucleotide substitutions between ZAL2 and ZAL2m (da) and between Z. albicollis and J. hyemalis (Ka) in the 6434.5 synonymous or noncoding positions sequenced in both species. The net number of nucleotide substitutions between each lineage was calculated by subtracting an approximation of the ancestral intraspecies polymorphism level, represented by the nucleotide diversity between the ZAL2 sequences, from the average number of nucleotide substitutions per site between arrangements (dxy) or the nucleotide divergence between species (K) generated with the DnaSP program (Rozas et al. 2003).
RFLP genotyping:
Genotyping assays for an NdeI restriction fragment length polymorphism (RFLP) at the THADA locus and for a BssSI RFLP at the FAM83B locus were performed as follows. PCR amplicons (5–10 μl of the PCR reaction) from the THADA and FAM83B loci were digested in the presence of NdeI (25–35 units, NEB) or BssSI (2 units, NEB), respectively, for 4.5 hr at 37° in a total reaction volume of 50 μl. The digested products were then subjected to electrophoresis in a 2 or 4% agarose gel to visualize the ZAL2 and ZAL2m alleles. For the THADA locus, the ZAL2 allele was detected by the presence of two bands of ∼1200 and ∼400 bp representing NdeI-digested fragments, while the ZAL2m allele was associated with a single ∼1600-bp undigested fragment. For the FAM83B locus, the ZAL2 allele was represented by two bands of 354 and 81 bp representing BssSI-digested fragments, while the ZAL2m allele was associated with a single 435-bp undigested fragment. The locations of these polymorphisms are annotated in the respective GenBank records. In addition, a simple indel polymorphism at the DSE locus (ZAL2 allele = ∼350 bp, ZAL2m allele = 400 bp) was genotyped by electrophoresis of the PCR products on a 4% agarose gel (see Table 2 for the DSE primer sequences).
RESULTS
Comparative chromosome painting in the white-throated sparrow:
Studies focused on the evolution of avian karyotypes have been advanced by the development and utility of chicken (Gallus gallus) chromosome paints for comparative mapping (ZOO-FISH) in a diverse sampling of birds (Shetty et al. 1999; Guttenbach et al. 2003; Itoh and Arnold 2005; Nanda et al. 2006; Nishida-Umehara et al. 2007). Those efforts and other gene-based comparative mapping studies (Backstrom et al. 2006; Itoh et al. 2006) have demonstrated that conserved synteny among birds is quite extensive with many chicken chromosomes displaying a one-to-one orthologous relationship to chromosomes from other species, including passerines (Guttenbach et al. 2003; Derjusheva et al. 2004; Itoh and Arnold 2005), which diverged from the chicken lineage ∼100 million years ago (MYA) (van Tuinen and Hedges 2001). The development of a comparative map with chicken, which has an assembled and annotated genome (Hillier et al. 2004), can therefore provide a strong basis for predicting the gene content, but not necessarily the gene order, of an orthologous chromosome in another bird. Previous comparative mapping in two songbirds, the chaffinch (Fringilla coelebs) and zebra finch (Taeniopygia guttata), which diverged from the white-throated sparrow within the past ∼20 million years and ∼20–45 MYA, respectively (Barker et al. 2004), identified chicken chromosome 3 (GGA3) as the ortholog of chromosome 2 in those species (Derjusheva et al. 2004; Itoh and Arnold 2005). We therefore hypothesized that the ZAL2 and ZAL2m chromosomes were also orthologous to GGA3. To test this hypothesis, we performed FISH using the GGA3 paint on metaphase spreads from a WS bird with the ZAL2/ZAL2m heterokaryotype (Figure 1A). As predicted, the GGA3 paint identified only ZAL2 and ZAL2m as the orthologous chromosome in the white-throated sparrow. In addition, we performed FISH using chromosome paints for three other macrochromosomes, GGA1, 2, and 4, and were able to definitively exclude those chromosomes as orthologs of ZAL2 and ZAL2m (data not shown). Thus, ZAL2 and ZAL2m are orthologous to GGA3.
Cytogenetic mapping of the ZAL2 and ZAL2m chromosomes. Metaphase chromosome spreads from WS females were used for FISH mapping. Note that the karyotype of the white-throated sparrow, like other birds, is composed of a few large macrochromosomes and numerous microchromosomes. (A) Chicken chromosome 3 painting probe hybridization to ZAL2 and ZAL2m. (B–E) Localization of zebra finch BAC clones orthologous to chicken chromosome 3 on ZAL2 and ZAL2m. The color-coded arrows corresponding to each BAC represent the position of each probe on each chromosome. Note the change in relative order between the alternative arrangements for BACs 64A1, 71A1, and 5K13, and the shift in proximity toward the telomere of the long arm for 21H11, 55A1, and 352K14 on ZAL2m relative to ZAL2.
Cytogenetic mapping of the ZAL2m chromosomal rearrangement:
Having established that ZAL2 and ZAL2m are orthologous to GGA3, we next turned our attention toward characterizing the rearrangement that led to the ZAL2m chromosome. On the basis of the position of the centromere, which is submetacentric on ZAL2 but metacentric on ZAL2m, Thorneycroft (1966, 1975) hypothesized that this chromosomal polymorphism involved a pericentric inversion. To map the putative inversion, we leveraged the assembled chicken genome and the genomic resources available for the zebra finch to identify a set of zebra finch BAC clones orthologous to 15 distinct loci distributed along GGA3 (see Table 1 and materials and methods). This set of zebra finch BAC clones was then systematically mapped to metaphase spreads from WS birds with the ZAL2/ZAL2m heterokaryotype using a combination of single, dual, and tricolored FISH to resolve the order of clones along the individual chromosomes. Representative images of the FISH results are shown in Figure 1, B–E, and a complete summary of the cytogenetic mapping is illustrated in Figure 2.
Summary of the cytogenetic mapping of ZAL2 and ZAL2m and gene flow between the chromosomes. The positions of the zebra finch BAC clones mapped by FISH to the ZAL2 (left) and ZAL2m (right) chromosomes are indicated. In cases where the order of the BAC clones could not be reliably resolved, the clones were grouped together (vertical line) and listed in an arbitrary order. Lines between the chromosomes indicate the relative position of the markers on the two chromosomes. Centromeres are represented by solid circles. The gene names and FST values for loci included in the population genetics studies are listed to the right of ZAL2m in their respective positions along this chromosome. The positions of the genes were directly determined by FISH (*) or inferred on the basis of flanking markers and the orthologous position on GGA3 (†). The subset of the loci that were genotyped in a larger panel of WS and TS birds are denoted by “‡.” The “§” indicates that the VIP genotyping results were previously reported in Michopoulos et al. (2007).
In complete concordance with the results from chicken chromosome painting studies, all 15 zebra finch BAC clones selected on the basis of their orthology to GGA3 mapped to both ZAL2 and ZAL2m. The majority of BAC clones (12/15) were in the same relative order on ZAL2 and ZAL2m and localized to the same arm of both chromosomes. For example, zebra finch BACs 21H11 and 120H07 were localized to the same position relative to the closest flanking marker(s) on the p- and q-arms of both ZAL2 and ZAL2m (Figure 1B and Figure 2). However, the proximity of these BACs to the centromere, or the end of the q-arm, was not equivalent. BACs that mapped to the q-arm on both ZAL2 and ZAL2m were notably shifted toward the telomere on ZAL2m vs. ZAL2. For example, 21H11, 352K14, and 55A1 are clearly more telomeric on ZAL2m vs. ZAL2, but a comparable distance from the centromere on both chromosomes (Figure 1, B, D, and E). On the p-arm, 258I11 and 120H07 mapped very close to the telomere of the p-arm on both chromosomes but were clearly farther from the centromere on ZAL2m vs. ZAL2. These shifts in the position of the mapped BAC clones are consistent with movement of a large segment of the distal region of the q-arm of ZAL2 to the p-arm of ZAL2m. Indeed, the remaining three zebra finch BACs (64A01, 5K13, and 71A1) were the most distal markers on the q-arm of ZAL2, but mapped to the central portion of the p-arm of ZAL2m (Figure 1, C–E). Although the order of these three BACs relative to one another on the q-arm of ZAL2 and the p-arm of ZAL2m could not be unambiguously resolved, this result is consistent with a pericentric inversion. Yet, because these three BACs were flanked by markers that did not change their relative order between ZAL2 and ZAL2m (Figure 1, C–E, and Figure 2), a single pericentric inversion can be excluded as the sole molecular mechanism that gave rise to ZAL2m. Our cytogenetic mapping data are therefore consistent with a pair of inversions leading to the ZAL2/ZAL2m polymorphism (see discussion).
Gene flow between ZAL2 and ZAL2m chromosomes:
In the heterokaryotype, pericentric inversions can act as suppressors of recombination by physically disrupting the pairing of the normal and inverted chromosomes. While our cytogenetic mapping revealed that a large fraction of the loci on ZAL2 and ZAL2m are colinear (Figure 2), the nature of the rearrangement is such that single recombinants along the majority of the chromosome would lead to duplicated/deleted gametes, which would effectively suppress recombination. Thus, to directly measure the pattern of gene flow between the ZAL2 and ZAL2m arrangements, we sequenced 8657 bp corresponding to 10 loci that mapped to these chromosomes (Figure 2) in six WS (obligate ZAL2/ZAL2m) and four TS (obligate ZAL2/ZAL2) individuals. A series of population genetic measures calculated for the 10 loci in WS and TS individuals showed clearly different results for the loci within vs. outside the region rearranged between ZAL2 and ZAL2m (Table 3). Specifically, according to the raw genotype data, the 9 loci within the rearranged region displayed very high heterozygosity values in WS (0.57–1.00) compared to TS birds (0–0.17) and positive Tajima's D values, which are consistent with an excess of nucleotide variants at high frequency (Tajima 1989). Similarly, when the individual haplotypes for these loci were estimated, ZAL2 chromosomes had five times higher nucleotide diversity (π) than the ZAL2m chromosomes, and the FST values between the two chromosomal arrangements ranged from 0.7 to the maximum value of 1, which is indicative of a great degree of genetic differentiation between ZAL2 and ZAL2m (Table 3 and Figure 2).
Population genetic analysis of 12 loci located within and outside the region rearranged between ZAL2 and ZAL2m chromosomes
Locus | C20orf74a | THADAa | MAP3K4a | ESR1a | VIPa | REPS1a | TRMT11a | CGAa | FAM83Ba | Combined results for all loci within the rearrangementb | SUPT3Hc | ARHGAP21d | ANKIB1d |
|---|---|---|---|---|---|---|---|---|---|---|---|---|---|
| Z. albicollis intraspecific data | |||||||||||||
| Total sequence length (noncoding and synonymous positions) | 754 (754) | 1146 (746.6) | 355 (83.8) | 1136 (918.7) | 733 (667.5) | 1243 (1207.2) | 1168 (1157.7) | 1045 (967.3) | 391 (83.4) | 7971 (6586.2) | 686 (607.5) | 774 (647.7) | 801 (801) |
| Segregating sites, S | 9 | 20 | 1 | 11 | 5 | 17 | 14 | 13 | 5 | 95 | 13 | 14 | 9 |
| WS birds average heterozygositye | 0.5741 | 0.7667 | 1.0000 | 0.8485 | 1.0000 | 0.9902 | 0.8929 | 0.6282 | 1.0000 | 0.8246 | 0.1026 | 0.1429 | 0.1667 |
| TS birds average heterozygositye | 0.1111 | 0.0500 | 0 | 0.0227 | 0 | 0 | 0.0357 | 0.1731 | 0 | 0.0526 | 0.1731 | 0.1071 | 0.1944 |
| Nucleotide diversity, πf | 0.0036 | 0.0086 | 0.0053 | 0.0046 | 0.0033 | 0.0063 | 0.0052 | 0.0054 | 0.0159 | 0.0055 | 0.0038 | 0.0030 | 0.0018 |
| Tajima's D | 0.22 | 1.03 | 1.03 | 1.82 | 1.74 | 2.16* | 1.92 | 1.52 | 1.74 | 1.75 | −1.50 | −1.87* | −1.51 |
| Fu and Li's D* | −0.17 | 0.25 | 0.65 | 1.44* | 1.19 | 1.55** | 1.50** | 1.10 | 1.19 | 1.21 | −2.47* | −1.75 | −1.72 |
| Fu and Li's F* | −0.07 | 0.56 | 0.86 | 1.79** | 1.55 | 2.00** | 1.88** | 1.42 | 1.55 | 1.60 | −2.54 | −2.07 | −1.92 |
| ZAL2/2m genetic differentiationg | |||||||||||||
| ZAL2 nucleotide diversity, π2f | 0.0009 | 0.0004 | 0 | 0.0006 | 0 | 0.0001 | 0.0007 | 0.0035 | 0 | 0.0009 | 0.0027 | — | — |
| ZAL2m nucleotide diversity, π2mf | 0 | 0 | 0 | 0.0009 | 0 | 0 | 0 | 0.0003 | 0 | 0.0002 | 0.0033 | — | — |
| Shared polymorphisms | 0 | 0 | 0 | 1 | 0 | 0 | 0 | 0 | 0 | 1 | 3 | — | — |
| Fixed differences between arrangement | 5 | 14 | 1 | 9 | 5 | 16 | 12 | 4 | 5 | 71 | 0 | — | — |
| Average nucleotide substitutions per site, dxyf | 0.0071 | 0.0188 | 0.0119 | 0.0097 | 0.0075 | 0.0140 | 0.0110 | 0.0081 | 0.0360 | 0.0114 | 0.0033 | — | — |
| FST | 0.91*** | 0.97*** | 1*** | 0.94*** | 1*** | 0.99*** | 0.96*** | 0.70*** | 1*** | 0.94*** | 0.11 | — | — |
*P < 0.05, **P < 0.02, ***P < 0.001.
Loci that map within the region rearranged between ZAL2 and ZAL2m.
The results obtained after concatenating the sequences of the nine loci included within the region rearranged between ZAL2 and ZAL2m chromosomes (underlined).
The locus linked to ZAL2 and ZAL2m but outside of the rearranged region.
Loci that map to ZAL1.
Heterozygosity was calculated independently for the WS (ZAL2/ZAL2m heterokaryotypes) and TS (ZAL2/ZAL2 homokaryotypes) groups as the average fraction of heterozygotes per segregating position.
The nucleotide diversity (π) and the average number of nucleotide substitutions per site between arrangements (dxy) were calculated considering only noncoding and synonymous positions.
For the calculation of genetic differentiation measures between ZAL2 and ZAL2m, haplotypes were estimated with the Phase program and only positions that could be reliably assigned to a particular haplotype were included in the analysis.
In contrast, clearly distinct results were observed for the lone gene, SUPT3H, linked to ZAL2 and ZAL2m that maps outside the rearrangement. Specifically, SUPT3H did not have a high level of heterozygosity in WS vs. TS birds; was associated with a negative Tajima's D, which is consistent with an enrichment of low-frequency variants; had comparable levels of nucleotide diversity; and shared polymorphisms between ZAL2 and ZAL2m and an FST value between the arrangements close to zero (Table 3, Figure 2). SUPT3H maps near the telomere of the short arm of ZAL2 and coincides with the location where Thorneycroft (1975) observed the formation of chiasma between ZAL2 and ZAL2m homologs. Thus, both the pattern of gene flow between ZAL2 and ZAL2m that we observed and Thorneycroft's cytological findings are indicative of free recombination between the most telomeric portion of the short arm of ZAL2 and ZAL2m, but almost complete suppression of recombination along the rest of the chromosome. In addition, as an extra control, we sequenced a portion of two loci unlinked to the chromosome 2 rearrangement, ANKIB1 and ARHGAP21, which we had cytogenetically mapped to ZAL1 (data not shown, but the BAC clones used to map these loci are listed in Table 1). As shown in Table 3, the results for both these loci were very similar to those for SUPT3H, further supporting the absence of recombination suppression at this locus.
A limitation of our estimates of gene flow between ZAL2 and ZAL2m is that our sample size of WS and TS individuals is relatively small. Furthermore, we cannot rule out the possibility that some of the 10 birds that were sequenced may be closely related to one another. To better gauge the lack of gene flow between ZAL2 and ZAL2m, we genotyped a larger sample of birds (20 WS and 25 TS) for polymorphisms that were inferred to represent candidate fixed differences between ZAL2 and ZAL2m in the set of 10 sequenced individuals. Polymorphisms that met the above criteria and could be easily typed by PCR were found for FAM83B and THADA, as well as the DSE locus, which was not included among the 10 sequenced genes but for which a simple indel polymorphism was identified. For these three loci, the same genotype pattern was observed: TS birds were always homozygotes for the inferred ZAL2 allele, whereas WS birds were always heterozygotes, indicating that they had one copy of the allele linked to ZAL2 and another linked to ZAL2m. Thus, in this extended sample, we were unable to detect evidence for gene flow in heterokaryotypes at these three loci, as was previously observed for the VIP gene (Michopoulos et al. 2007). These results therefore support the conclusion from the sequencing data that gene flow is very limited between ZAL2 and ZAL2m.
Evolutionary history and age of ZAL2m:
In an attempt to reconstruct the evolutionary history of the ZAL2m rearrangement, we sequenced the nine loci within the rearranged region in three outgroup species: Z. leucophrys, Z. querula, and J. hyemalis. According to our calculation of the divergence times based on nucleotide sequence and restriction site variation data from mitochondrial DNA (see materials and methods), these species diverged from Z. albicollis ∼1.0 ± 0.2 MYA (Z. leucophrys), 1.3 ± 0.3 MYA (Z. querula), and 4.0 ± 0.5 MYA (J. hyemalis). The sequences of these genes were concatenated and used to build a phylogenetic tree of inferred haplotypes from all four species (Figure 3). Surprisingly, while the ZAL2 sequences clustered together and formed a monophyletic clade with the Z. querula and Z. leucophrys sequences, the ZAL2m chromosomes clustered together in their own distinct group. Therefore, a precursor of the ZAL2m arrangement, or the ZAL2m arrangement itself, likely originated prior to the divergence of Z. albicollis, Z. querula, and Z. leucophrys. However, the topologies of the trees constructed for the individual loci also included some instances that supported alternative hypotheses (supplemental Figure 1).
Phylogeny of the loci that map within the region rearranged between the ZAL2 and ZAL2m chromosomes. A neighbor-joining phylogenetic tree was constructed on the basis of 7231 bp of concatenated sequence corresponding to nine loci included within the region rearranged between ZAL2 and ZAL2m chromosomes. These nine loci were sequenced in six WS and four TS birds and in one individual from each of three closely related species: Z. leucophry (ZLE), Z. querula (ZQU), and J. hyemalis (JHY). Bootstrap values of 1000 replicates are indicated for the main nodes. Sequences from each white-throated sparrow are labeled with the bird identification number. For the WS individuals, the sequences of the ZAL2 and ZAL2m chromosomes are labeled as 2 and 2m, respectively. For all other individuals, the estimated haplotypes were arbitrarily labeled A and B. In the cases of ZQU, ZLE, and JHY, nucleotide variants were randomly assigned to a haplotype.
The time point at which gene flow ceased between the ZAL2 and ZAL2m can be estimated by comparing the number of nucleotide substitutions in the noncoding and synonymous positions accumulated between ZAL2 and ZAL2m chromosomes and between Z. albicollis and an outgroup (J. hyemalis) for the loci that map within the rearrangement (see materials and methods). Assuming an ancestral intraspecific polymorphism rate equal to that currently found in the same positions for ZAL2 chromosomes (π2 = 0.0009), the net number of nucleotide substitutions/site between ZAL2 and ZAL2m (da) is 0.0103 and between Z. albicollis and J. hyemalis (Ka) is 0.0191. Consequently, gene flow between ZAL2 and the precursor of the ZAL2m arrangement ceased 2.2 ± 0.3 MYA, in agreement with its origin prior to the divergence of Z. albicollis, Z. querula, and Z. leucophrys. Since then, the ZAL2m precursor, and then ZAL2m itself, were probably maintained as a balanced polymorphism at high frequencies in Z. albicollis, as evidenced by the marginally significant positive values of Tajima's D (D = 1.75, P < 0.10) and Fu and Li's D (D = 1.40, P < 0.10) and F (F = 1.85, P < 0.05) tests using J. hyemalis as an outgroup (Tajima 1989; Fu and Li 1993).
DISCUSSION
Nature of the ZAL2m arrangement:
Conserved synteny extending across entire chromosomes is quite common in birds (Guttenbach et al. 2003). Our comparative mapping results using both chicken chromosome painting probes and zebra finch BAC clones have established that this is also the case for ZAL2 and ZAL2m, which we found to be orthologous to GGA3. All zebra finch BAC clones tested in our study yielded a hybridization signal in the white-throated sparrow and therefore are likely to be highly effective for comparative FISH studies in other members of the family Emberizidae. However, both the order of the 15 loci mapped on ZAL2 and the order of the 15 loci mapped on ZAL2m were distinct from the order of the orthologous loci on GGA3 (compare Figure 2 vs. Table 1). Thus, similar to conclusions of comparative mapping of the Z chromosome between the chicken and other songbirds (Backstrom et al. 2006; Itoh et al. 2006), at least two inversions must have occurred in the chicken or white-throated sparrow lineages to alter the gene order between GGA3 and ZAL2. Future comparative mapping of the white-throated sparrow, chicken, and, when available, the zebra finch genome, should clarify the degree of conserved linkage among these species.
A comparison of the location of 15 cytogenetic markers between ZAL2 and ZAL2m revealed that the relative order of these loci was inconsistent with a single pericentric inversion. One mechanism that could have produced the difference in gene order between ZAL2 and ZAL2m is a single large-scale intrachromosomal transposition of a distal portion of the q-arm of ZAL2 to the p-arm of ZAL2m. Transposition of a chromosomal segment on the order of ∼10 Mb, as far as we are aware, has never been reported. In addition, Thorneycroft (1975) considered this mechanism as a possible basis for the ZAL2m arrangement, but was able to reject this hypothesis on the basis of empirical studies of male meiosis. We therefore propose that the difference that we detected between ZAL2 and ZAL2m is due to a pair of “included” inversions (Figure 4) with each inversion occurring in succession. While Figure 4 illustrates a model in which the larger inversion preceded the internal inversion, our results cannot distinguish the order in which these two inversions occurred. As a result, the segment contained within the internal inversion is in fact colinear between ZAL2 and ZAL2m. Because of the limited number of markers and resolution provided by our study, this model could be an oversimplification of the differences between ZAL2 and ZAL2m. However, on the basis of the conserved synteny with GGA3, we predict that the region within the rearrangement is at least 98 Mb and therefore spans >86% of the chromosome. Interestingly, three of the four inversion breakpoints grossly colocalize to breaks in conserved linkage between ZAL2 and ZAL2m, and GGA3. Future mapping and sequencing efforts performed at a higher resolution will be necessary to identify all the structural differences between the ZAL2 and ZAL2m arrangements.
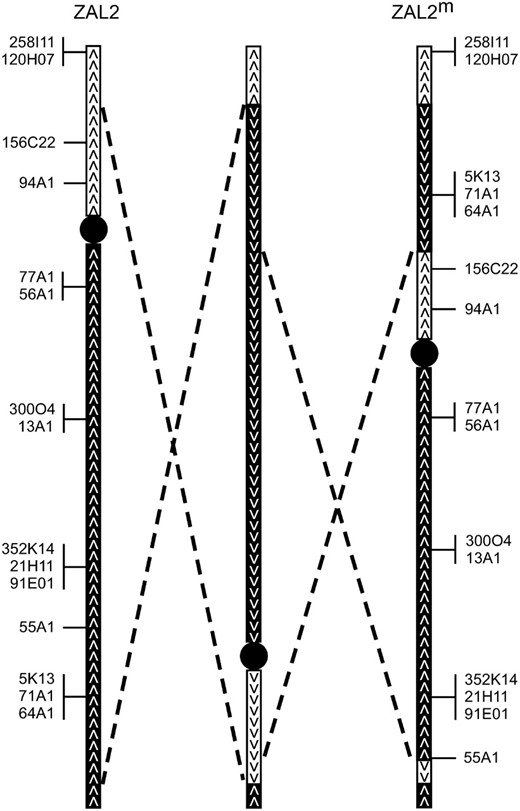
Model for the generation of the ZAL2m rearrangement. A minimum of two pericentric inversions, represented by the pairs of dashed lines, are hypothesized to have led to the ZAL2/ZAL2m polymorphism. ZAL2 (left) and ZAL2m (right) are shown along with a hypothetical intermediate chromosomal arrangement (middle). The depicted movement of a small chromosomal segment present on the short arm of ZAL2 to the long arm of ZAL2m is only predicted by the model and is not based on empirical data. The illustrated order in which the inversions occurred is arbitrary, and a model with the inversions occurring in the reverse order is also possible. Centromeres are represented by solid circles. Open boxes and solid boxes represent the short and long arms of ZAL2 or chromosomal segments originating on those arms, respectively. Arrowheads indicate the orientation of the chromosomal segments.
ZAL2m suppresses recombination in the heterokaryotype:
Our model for the basis of the structural difference between the ZAL2 and ZAL2m arrangements predicts that recombination will be suppressed in the heterokaryotype within the region encompassed by both inversions. DNA sequencing and genotyping of loci within this interval did indeed show the expected signature for a lack of gene flow between ZAL2 and ZAL2m in this region (Figure 2 and Table 3). Thorneycroft (1975) documented chiasma formation between the short arm of ZAL2 and one arm of ZAL2m. Consistent with this observation, sequence analysis of the one locus that mapped to the short arm of ZAL2 near the telomere detected free recombination at that position on the chromosome. We therefore conclude that the ZAL2m rearrangement is a suppressor of recombination and that gene flow between ZAL2 and ZAL2m is likely restricted to a small fraction of the chromosome outside the rearrangement. Additional sequencing and genotyping of more loci and individuals will be needed to fully characterize the pattern of gene flow between the ZAL2 and ZAL2m arrangements.
Origin of ZAL2m:
Our molecular dating results indicate that the first inversion on ZAL2m likely originated ∼2.2 ± 0.3 MYA and would seem to predate the divergence of the white-throated sparrow from Z. leucophrys and Z. querula. However, from comparative studies in other Zonotrichia sparrows it was inferred that ZAL2 was likely the ancestral arrangement and that ZAL2m was not a shared polymorphism, but instead arose exclusively in the white-throated sparrow lineage (Thorneycroft 1975). Although chromosomal polymorphisms have subsequently been detected in another bird in this genus, Z. capensis (Rocha et al. 1990), they are distinct from ZAL2m. The lack of evidence for ZAL2m in other Zonotrichia sparrows may reflect insufficient sampling or that this arrangement was present in an ancestral population but retained only in the white-throated sparrow. Another possibility is that ZAL2m may have been introduced into the white-throated sparrow population by hybridization with another species. Indeed, shared chromosomal polymorphisms are present within the Junco genus (Shields 1973), possibly on chromosome 2 (but see Rocha et al. 1990), and matings between Z. albicollis and J. hyemalis have been reported (Dickerman 1961). However, our sequence analysis showed that the ZAL2 and ZAL2m chromosomes share a much more recent common ancestor with each other than either does with J. hyemalis, making hybridization with that species an unlikely source for ZAL2m.
Comparison of ZAL2m with the t complex:
The best-studied balanced chromosomal polymorphism in vertebrates involves the mouse t complex, the hallmark feature of which is a transmission ratio distortion in males such that >95% of the offspring from +/t males can inherit the t haplotype (Bennett 1975). The ZAL2m polymorphism, in contrast, is transmitted at the expected Mendelian ratios (Thorneycroft 1975). Nonetheless, there are noteworthy similarities between it and the t complex. Below we compare the nature and history of these two balanced chromosomal polymorphisms, their role as suppressors of recombination, the gene content of the rearrangements, and linkage to male aggressive behavior and female mating preference.
The t complex is located at the proximal end of chromosome 17 and includes four nonoverlapping inversions [In(17)1-4], which occurred in a succession of events over the past ∼2 million years (Hammer et al. 1989). The progressive expansion of the t complex over time is likely the result of selection for the acquisition of additional beneficial alleles to the complex (Darlington 1939; Mather 1955; Hammer et al. 1989). Comparisons of t haplotypes from mice collected around the world have revealed extensive allele sharing and little divergence among extant t haplotypes, suggesting that all modern-day t haplotypes arose from a common ancestor <100,000 years ago (Hammer and Silver 1993). Similarly, the ZAL2m arrangement is composed of at least two inversions, the first of which likely arose 2.2 ± 0.3 MYA, and has minimal sequence divergence between sampled ZAL2m chromosomes (Table 3). This observation may simply reflect our small sample size, but could also be consistent with a recent selective sweep and a relatively young age of the ZAL2m alleles. Therefore, both of these balanced polymorphisms involve complex autosomal rearrangements that arose in the past few million years.
A second prominent feature of the t complex is that it is a suppressor of recombination in +/t individuals between the wild-type and t haplotypes (Bennett et al. 1976), although some limited genetic exchange between inverted and wild-type segments has been observed (Herrmann et al. 1987; Hammer et al. 1991). As most t haplotypes contain recessive lethal or semilethal mutations, and because t/t males are sterile, free recombination within t haplotypes is limited to females who are compound heterozygotes for complementing t haplotypes (Silver and Artzt 1981). The t complex has therefore been evolving primarily as a nonrecombining autosomal segment. The paucity of ZAL2m homozygotes (Thorneycroft 1975; Falls and Kopachena 1994) and the lack of gene flow between ZAL2 and ZAL2m chromosomes suggests that the rearranged region of ZAL2m is also evolving primarily, although perhaps not exclusively, as a nonrecombining autosomal segment. Thus, to our knowledge, we have identified only the second example of a nonrecombining autosomal segment in vertebrates.
The t complex spans ∼33 Mb (∼1% of the mouse genome) and contains ∼700 protein-coding genes (mm8, Ensembl release 46). On the basis of our comparative mapping results, we estimate that the ZAL2m rearrangement corresponds to >98 Mb (∼10% of the white-throated sparrow genome) and includes ∼1000 protein-coding genes (galGal3, Ensembl release 46). Strikingly, it appears that there is conserved synteny between the t complex and the ZAL2m rearrangement. Within the ZAL2m rearrangement we predict that there is conserved synteny with two segments of mouse chromosome 17, an ∼12-Mb segment from Snx9 to Pdcd2 and an ∼1.3-Mb segment from Rnf8 to just distal of Dnahc8. Together those regions encompass ∼11 Mb and ∼100 protein-coding genes, including Brachyury (T) (see Table 1 and Figure 4, BAC clone 300O4), that map within the t complex. Segments orthologous to In(17)1 and In(17)2 are predicted to be completely within the ZAL2m rearrangement as well as portions of In(17)3 and In(17)4. Future studies in both mouse and sparrow will be needed to determine if any common genes are involved in the phenotypes linked to the t complex and ZAL2m rearrangement.
Finally, like the ZAL2m polymorphism, variation in social behavior and mate preference has been linked to the t complex. Male +/t mice tend to be more aggressive than their wild-type counterparts (Lenington et al. 1996). Similarly, increased aggression is also linked to the ZAL2m arrangement, although this trait affects both male and female birds (Falls and Kopachena 1994). Female +/t but not +/+ mice likely display a mating preference for +/+ males (Lenington et al. 1988). Likewise, an exceptionally strong disassortative mating pattern is linked to the ZAL2 and ZAL2m arrangements (reviewed in Falls and Kopachena 1994). A simple explanation for this would be a disassortative mating preference; however, intrasexual competition among the females has been put forward to explain this mating pattern (Houtman and Falls 1994). In summary, whether or not all of these commonalities between the t complex and the ZAL2m balanced polymorphism are coincidental or of functional significance, the well-studied t complex should provide a series of valuable guideposts for future studies of ZAL2m.
Is the ZAL2/ZAL2m polymorphism a model for the early stages of sex chromosome evolution?
Sex chromosomes are thought to evolve from a pair of undifferentiated autosomes and represent an extreme example of a balanced chromosomal polymorphism (Ohno 1967; Charlesworth et al. 2005; Graves 2006). The progression from a pair of “ordinary” autosomes to differentiated sex chromosomes begins with the emergence of a sex-determining allele and the suppression of recombination between the proto-Y and X chromosomes by, for example, an inversion (Ohno 1967) across the region containing the sex-determining allele. This is followed by successive rounds of the acquisition of male beneficial alleles on the Y and expansion of the region of suppressed recombination to include those alleles as well (Charlesworth et al. 2005; Graves 2006). The suppression of recombination will lead to the genetic differentiation between the sex chromosomes and ultimately to the degeneration of the Y (Charlesworth and Charlesworth 2000). While the ancient avian and eutherian sex chromosomes can be partitioned into different evolutionary strata on the basis of the time points at which recombination ceased between the X and Y (or Z and W) (Lahn and Page 1999; Ellegren and Carmichael 2001; Handley et al. 2004), empirical studies of young sex chromosomes are needed to elucidate the early stages of this process (Charlesworth et al. 2005). A relatively “young” Y chromosome has been partially characterized by DNA sequencing in stickleback (Peichel et al. 2004), yet other chromosomes mimicking the early steps of sex chromosome evolution will be critical to understanding the early stages of sex chromosome evolution in vertebrates. We propose that the ZAL2/ZAL2m balanced polymorphism is such an example.
From the model of sex chromosome evolution, a proto-Y chromosome is expected to have a number of attributes, many of which are displayed by ZAL2m (Table 4). First, a proto-Y is predicted to contain a sex-determining gene and thus be exclusively passed through the male germline. ZAL2m is not linked to a sex-determining gene, but it has been reported that there is a 2:1 ratio of WS male × TS female vs. TS male × WS female breeding pairs (reviewed in Falls and Kopachena 1994). Thus, ZAL2m is passed through the male germline two-thirds of the time in those sampled populations. Second, a proto-Y will be linked to male beneficial traits and have evolved a mechanism of recombination suppression to maintain the linkage between those alleles with the sex-determining gene. ZAL2m confers a clear male fitness advantage, at least in some habitats, as witnessed by the fact that two-thirds of the observed male breeders are WS (ZAL2/ZAL2m) (Falls and Kopachena 1994). Furthermore, linkage of the alleles underlying this male fitness advantage can be maintained by the suppression of recombination in the ZAL2/ZAL2m heterokaryotype. Finally, a proto-Y will be in a constant state of heterozygosity and therefore evolving at least in part as a nonrecombining segment of the genome. Population-based cytogenetic studies in the white-throated sparrow indicated that ZAL2m is in a near-constant state of heterozygosity (Thorneycroft 1975), and our results revealed a lack of gene flow between ZAL2 and ZAL2m within the rearranged region. Thus, the rearranged region of ZAL2m is likely evolving predominantly as a nonrecombining chromosomal segment. We did not, however, observe any overt signs of genetic degeneration, for example, nonsense mutations, in our limited sequencing results of ZAL2m. Considering all these features and its relatively recent origin of 2.2 ± 0.3 MYA, ZAL2m represents an excellent potential system for empirically studying the standing theoretical predictions related to the early stages of sex chromosome evolution in vertebrates.
Comparison of a proto-Y chromosome with ZAL2m
Attribute | Proto-Y chromosome | ZAL2m |
|---|---|---|
| Sex-determining gene | Yes | No |
| Passed through male germline (%) | 100 | ∼66 |
| Linked to male beneficial traits | Yes | Yes |
| Recombination suppression | Yes | Yes |
| Constant state of heterozygosity | Yes | ∼Yes |
| Nonrecombining segment | Yes | ∼Yes |
Finally, the predominant disassortative mating pattern in the white-throated sparrow consisting of WS males × TS females is already mimicking the heterogametic × homogametic pairs associated with sex chromosomes (i.e., ZAL2/ZAL2m × ZAL2/ZAL2 vs. XY × XX). Although the white-throated sparrow, like other birds, has a ZW sex chromosome system, if the ZAL2/ZAL2m chromosomes or other similar balanced polymorphisms were to evolve into new sex chromosomes, then, in contrast to the standard model, the acquisition of a sex-determining gene would not be the trigger of sex chromosome evolution, but instead would represent an essential step toward reinforcing and perpetuating an already established and dominant disassortative mating preference involving the balanced polymorphism. In other words, such a system may be “primed” to evolve into new sex chromosomes.
ZAL2m as a model for linking genes to behavior:
Dominant traits that dictate social behavior are linked to ZAL2m, making it a potentially highly informative model for correlating genes with the evolution of social behavior. A single allele restricted to the ZAL2m arrangement, for example, a chimeric gene mapping to an inversion breakpoint, could possibly be a genetic basis for the behavioral or plumage polymorphism, and experiments are underway to clone the inversion breakpoints identified thus far. However, since the primary adaptive advantage of inversions is to bind together two or more co-adapted or locally adapted alleles, the genetics underlying these polymorphisms are likely complex. Analogous to the t complex, future population-based studies geared toward identifying distinct ZAL2m haplotypes and rare recombinant chromosomes in conjunction with quantitative behavioral studies on individual birds with these genotypes will be critical for further delimiting the interval(s) containing the causal genetic variants. Of the ∼1000 genes that map within the rearrangement, a number have been directly or indirectly associated with aggressive and/or parental behavior or coat color variation (data not shown). The initial genomic characterization of the ZAL2 and ZAL2m arrangements reported here in conjunction with detailed molecular characterization of the behavioral phenotypes (Maney et al. 2005; Spinney et al. 2006; Lake et al. 2008) should provide a strong foundation for evaluating those and other candidate genes.
Conclusion:
In conclusion, our initial modern genomic analysis of the first chromosomal polymorphism reported in birds demonstrates that the ZAL2m arrangement is composed of at least a pair of included inversions that suppress recombination in the heterokaryotype across ∼10% of the genome. While previously recognized as a potential model for the genetics of social behavior, on the basis of our results we propose that this balanced polymorphism will also be a valuable model for studying the adaptive nature of inversions and the early stages of sex chromosome differentiation. Future large-scale genomic sequencing, genotyping, and gene expression studies focused on the white-throated sparrow and the ZAL2/ZAL2m polymorphism will be needed to fully characterize and exploit this unique model for the genetic basis of social behavior and chromosome evolution.
Footnotes
Footnotes
Communicating editor: T. R. Magnuson
Acknowledgement
The authors thank V. Michopoulos for her work designing and validating PCR primers, J. Hubbard for collecting the birds, The Burke Museum of Natural History and Culture for providing tissue samples, H. G. Tempest and D. K. Griffin for providing the chicken chromosome paints, A. Navarro and A. Ruiz for help with the DNA sequence analysis and interpretation, and L. McGraw, Y. Tao, J. Lucchesi, K. Rudd, and M. Aguadé for comments on the manuscript. M.C. was supported by the Ramón y Cajal Program (Ministerio de Educación y Ciencia, Spain) and J.W.T., D.L.M., and C.L.M. by a grant from the National Institutes of Health (1R21MH082046).
References
Barker, F. K., A. Cibois, P. Schikler, J. Feinstein and J. Cracraft,
Collins, C. E., and A. M. Houtman,
Dickerman, R. W.,
Excoffier, L., G. Laval and S. Schneider,
Falls, J. B.,
Falls, J. B., and J. G. Kopachena,
Hammer, M. F., and L. M. Silver,
Hammer, M. F., J. Schimenti and L. M. Silver,
Houtman, A. M., and J. B. Falls,
Klein, J., P. Sipos and F. Figueroa,
Klicka, J., and R. M. Zink,
Knapton, R. W., and J. B. Falls,
Kopachena, J. G., and J. B. Falls,
Kopachena, J. G., and J. B. Falls,
Krimbas, C. B., and J. R. Powell,
Lenington, S., L. C. Drickamer, A. S. Robinson and M. Erhart,
Lowther, J. K.,
Michopoulos, V., D. L. Maney, C. B. Morehouse and J. W. Thomas,
Nanda, I., E. Karl, V. Volobouev, D. K. Griffin, M. Schartl et al.,
Piper, W. H., and R. H. Wiley,
Rocha, G. T., E. J. De Lucca and E. B. De Souza,
Shields, G. F.,
Tuttle, E. M.,
van Tuinen, M., and S. B. Hedges,
Watt, D. J.,
Yang, Z.,
Zink, R. M., D. L. Dittmann and W. L. Rootes,

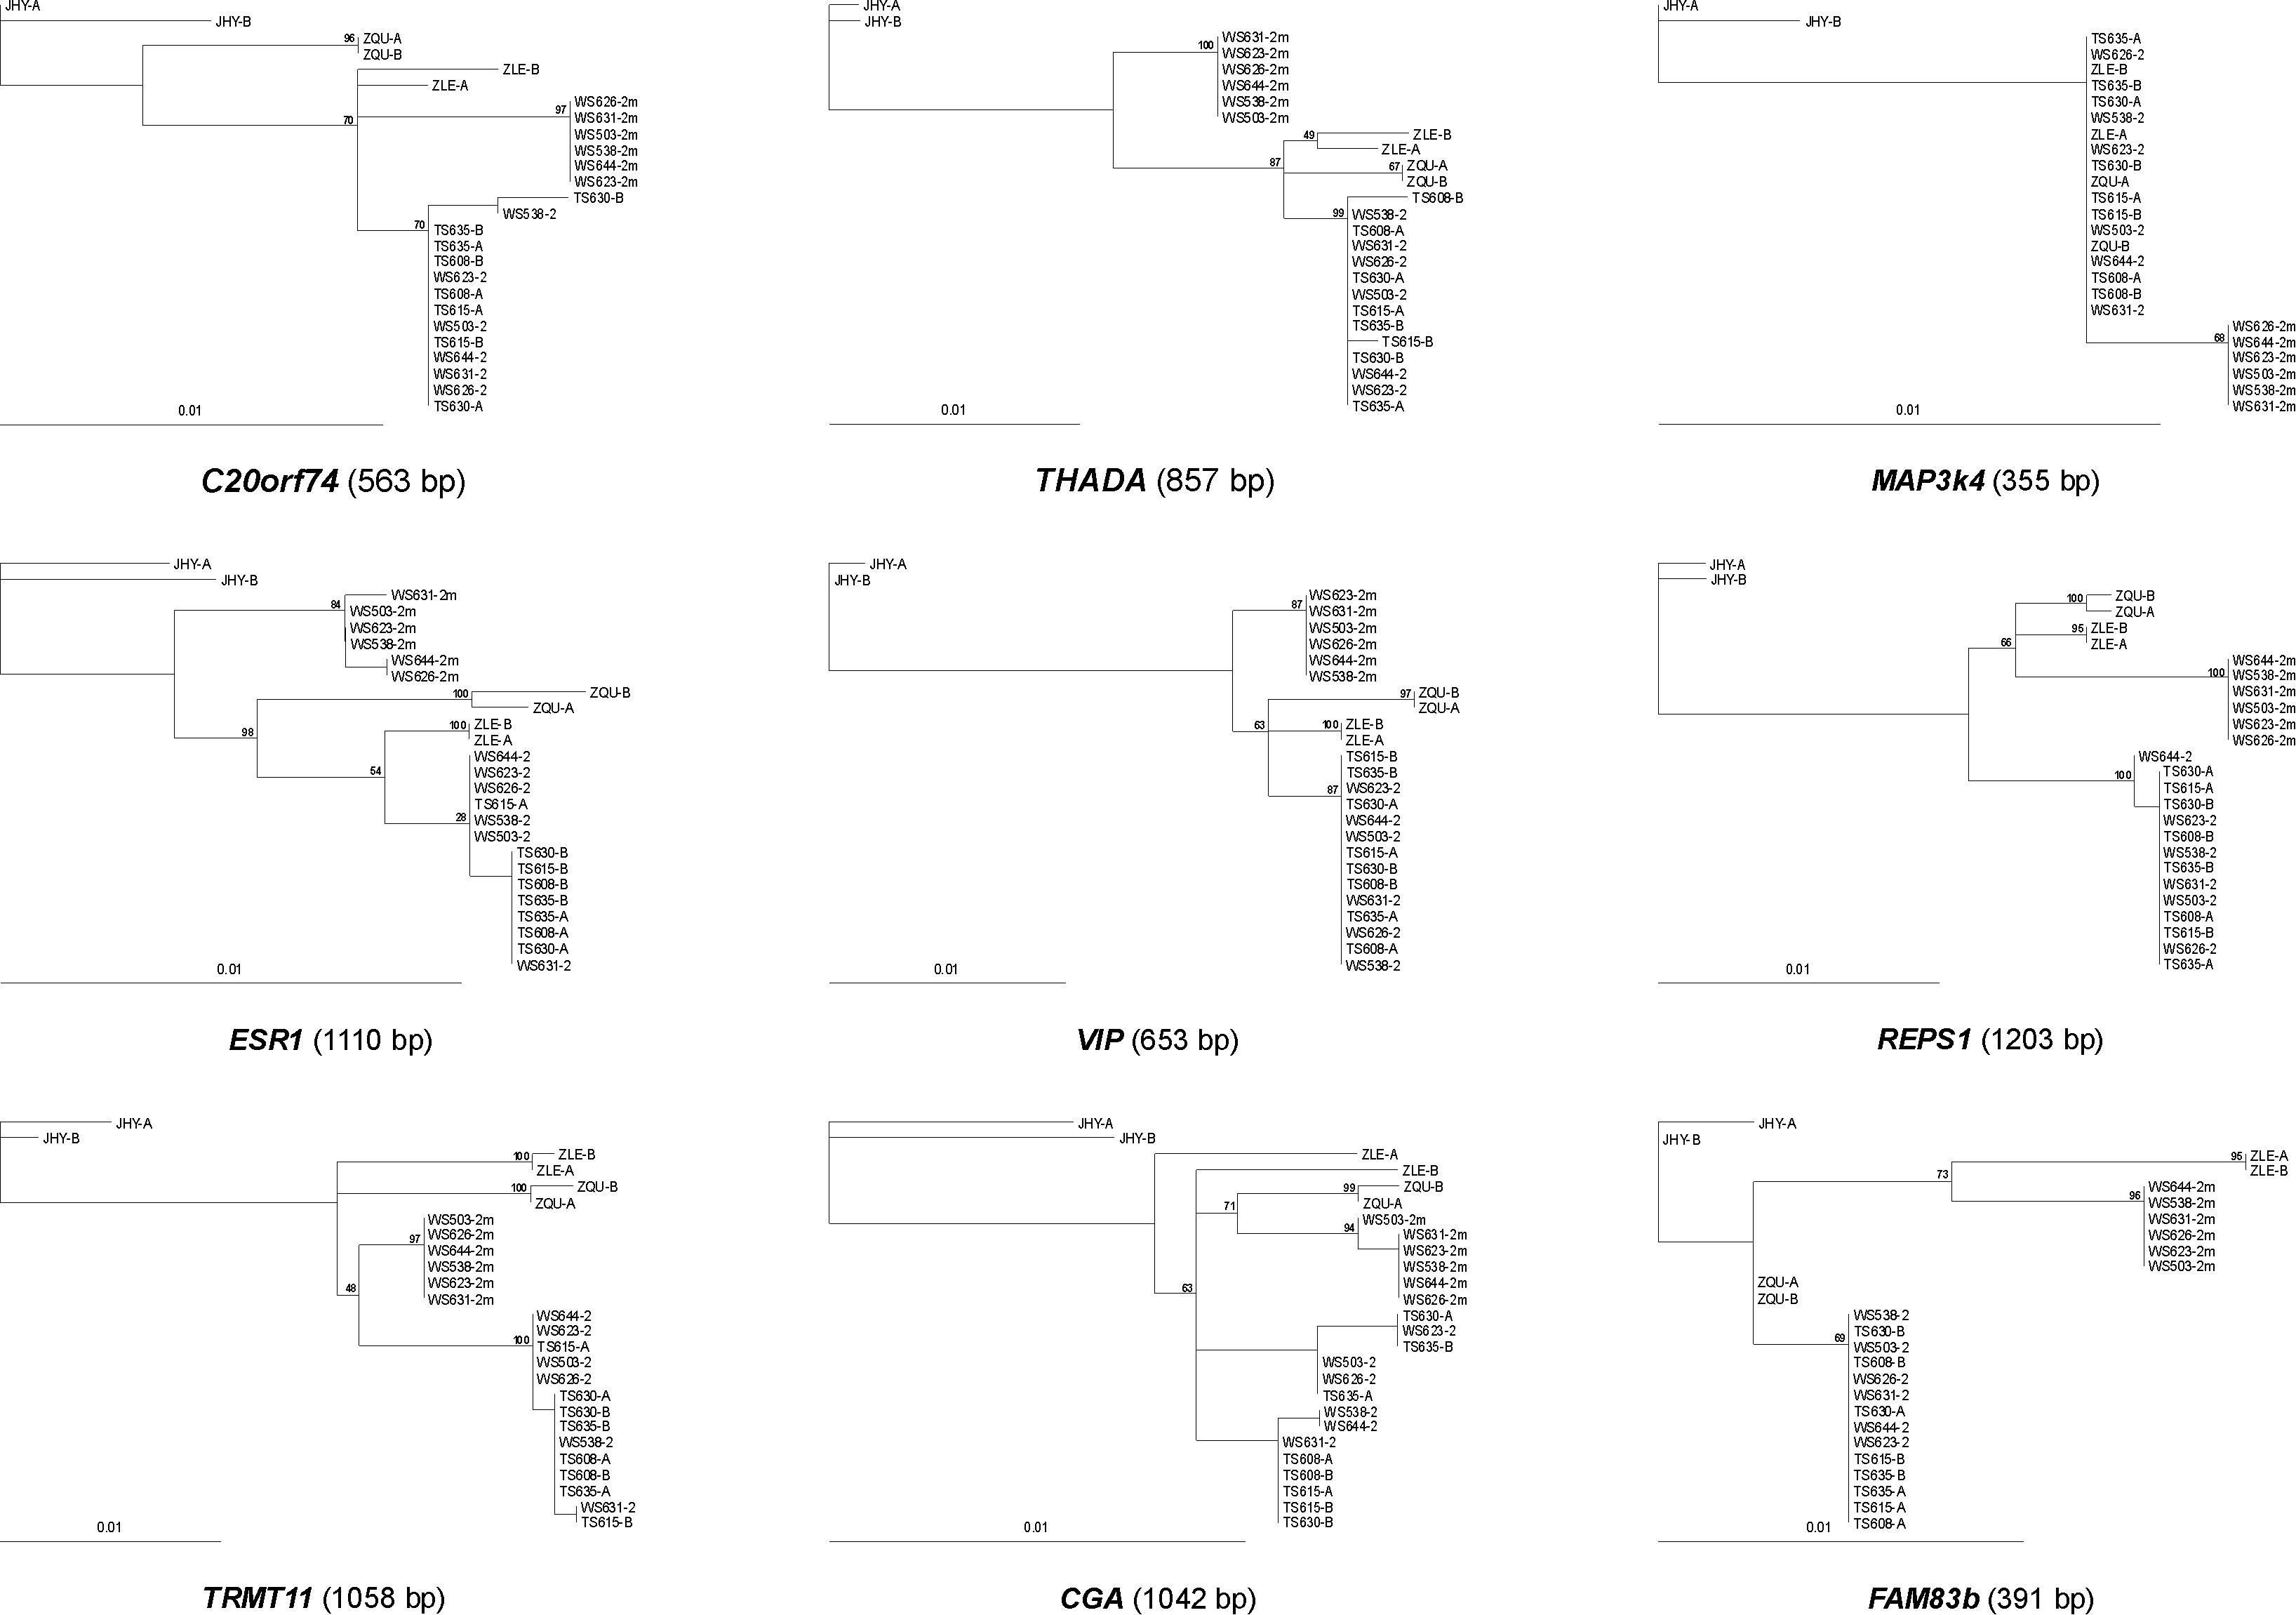