


Abstract
Genetic screens in Drosophila melanogaster and other organisms have been pursued to filter the genome for genetic functions important for memory formation. Such screens have employed primarily chemical or transposon-mediated mutagenesis and have identified numerous mutants including classical memory mutants, dunce and rutabaga. Here, we report the results of a large screen using panneuronal RNAi expression to identify additional genes critical for memory formation. We identified >500 genes that compromise memory when inhibited (low hits), either by disrupting the development and normal function of the adult animal or by participating in the neurophysiological mechanisms underlying memory formation. We also identified >40 genes that enhance memory when inhibited (high hits). The dunce gene was identified as one of the low hits and further experiments were performed to map the effects of the dunce RNAi to the α/β and γ mushroom body neurons. Additional behavioral experiments suggest that dunce knockdown in the mushroom body neurons impairs memory without significantly affecting acquisition. We also characterized one high hit, sickie, to show that RNAi knockdown of this gene enhances memory through effects in dopaminergic neurons without apparent effects on acquisition. These studies further our understanding of two genes involved in memory formation, provide a valuable list of genes that impair memory that may be important for understanding the neurophysiology of memory or neurodevelopmental disorders, and offer a new resource of memory suppressor genes that will aid in understanding restraint mechanisms employed by the brain to optimize resources.
THE fruit fly, Drosophila melanogaster, is an ideal system for studying the genetic basis for memory formation. Flies exhibit robust memory formation in several different learning paradigms, with olfactory classical conditioning being the most intensively studied type of learning to date (Tully and Quinn 1985; Davis 2005; Tomchik and Davis 2013). The arsenal of tools that the researcher can bring to bear on memory formation and other biological problems using Drosophila is unparalleled (Venken et al. 2011). For instance, large collections of mutants exist harboring transposable elements that disrupt gene function (Bellen et al. 2011), or enhancer detector collections that provide a report on the expression pattern of nearby genes, and often disrupt the nearest gene (www.flybase.org), as well as RNAi collections (www.stockcenter.vdrc.at; www.flyrnai.org; www.shigen.nig.ac.jp/fly/nigfly/) that can be expressed using binary gene expression tools, such as the gal4/uas system (Brand and Perrimon 1993). Thousands of gal4 driver lines are available that exhibit tissue-specific expression (www.janelia.org/team-project/fly-light) that afford the ability to drive transgene expression in virtually any group of cell types in the fly. Newer genome engineering techniques, like CRISPR, offer additional future promise for making directed mutations (Jinek et al. 2012; Sternberg et al. 2014). Approaches using the TARGET system, or Gene-Switch, offer the experimenter the ability to express uas-transgenes or uas-RNAi lines in both time and space (McGuire et al. 2004).
The genetic entrée to many biological problems is a large, forward genetic screen. Such screens are invaluable for several reasons. First, they identify the initial set of genes and gene functions involved in the biological process of interest when a saturation screen is completed. Second, they provide numerous genetic resources that are valuable for the study of individual genes, such as recessive, loss-of-function amorphic mutations, and dominant negative or hypermorphic mutations that produce a loss and gain of function, respectively.
Past genetic screens for olfactory memory using Drosophila have identified numerous genes important for the process as well as critical conceptual insights into the biology of memory formation. The initial screens employing chemical mutagenesis identified several mutants including dunce (dnc) and rutabaga (rut), which were subsequently found to encode cAMP phosphodiesterase and Ca++/calmodulin-sensitive adenylyl cyclase, respectively (Dudai et al. 1976; Byers et al. 1981; Livingstone et al. 1984; Chen et al. 1986; Levin et al. 1992; Tomchik and Davis 2013) These and related observations with other organisms identified the critical role of cAMP metabolism in behavioral plasticity. Enhancer detector screens identified genes preferentially expressed in the mushroom bodies, a critical neural focus for olfactory learning (Han et al. 1996, and secondary behavioral screens on these collections pinpointed other important molecules for memory formation including cell adhesion receptors (Grotewiel et al. 1998; Cheng et al. 2001). Drosophila mutants have been identified that perturb different temporal forms of memory, including amnesiac (amn), which has a pronounced impairment of intermediate-term memory (Quinn et al. 1979), and mutants that have specific deficits in protein-synthesis-dependent long-term memory, many of the latter identified through P-factor-mediated mutagenesis (Dubnau et al. 2003).
We report here the results of a large, RNAi screen to identify genes important for memory formation. The RNAi approach is facilitated by existing libraries of transgenes that encode an RNAi molecule against one of the ∼15,000 Drosophila genes. In addition, the RNAi approach facilitates mapping phenotypes to specific populations of neurons using a battery of spatially restricted gal4 drivers, whereas genomic mutations require more difficult and less successful spatial rescue experiments. Our results identify a large collection of RNAi transgenes that impair olfactory memory and >40 RNAi transgenes that enhance memory.
Materials and Methods
Fly husbandry
Flies were raised on standard fly food at room temperature. The uas-RNAi stocks used for the RNAi screen were obtained from the Vienna Drosophila RNAi Center (http://stockcenter.vdrc.at/control/main). We employed the control line (60100) used to construct the uas-RNAi transgenic lines for some behavioral experiments. For the primary screen, secondary screen, and TriKinetics locomotor activity assay, we crossed Nsyb-gal4 virgin females with males from individual uas-RNAi stocks. We conducted the initial screen using an n = 4 across the first 6 mo (1719 lines) and then changed to an n = 3 after pilot experiments showed that this had an insignificant effect on the number of false positives obtained. Other gal4 driver lines used in this study include: TH-gal4, 238y-gal4, c772-gal4, NP2492-gal4, MZ604-gal4, VT64246-gal4, GH146-gal4, c739-gal4, R28-gal4, 1471-gal4, and c305a-gal4.
A recent letter to the editor included data showing that the KK RNAi library used in this study has a nonannotated docking site into which most RNAi integrations occurred (Green et al. 2014). All lines tested in that study (39) had RNAi insertion elements in the nonannotated site. Approximately 25% of the lines (9/39) also had an insertion element into the annotated docking site. Lines that contained insertions in the annotated site also exhibited a collapsed wing phenotype when crossed to the panneuronal gal4 driver, c155-gal4, whereas lines without the insertion in the annotated site exhibited normal wings, even in the presence of the gal4 driver.
We identified many lines with collapsed wings when crossed to Nsyb-gal4 (Supporting Information, Table S2). Using PCR primers designed by Green et al. (2014), we assayed seven lines along with the control line, 60100. The control line had neither site filled, as expected. Lines 100363 and 106641 (Table 2), with phenotypically normal wings, contain a filled nonannotated site and an empty annotated site. Neither of these lines exhibited collapsed wings. Five of the lines did exhibit collapsed wings in the presence of Nsyb-gal4: 108395, previously tested by Green et al. (2014), 110077, 110786, 108196, and 110518. Four of the five lines, 108395, 110077, 110786, and 108196, had integrations at both the annotated and nonannotated sites. One of the five, 110518, showed integration only at the annotated site and curiously, also exhibited collapsed wings.
Behavior
We used 1- to 4-day-old flies for all behavioral experiments. Flies were collected ∼24 hr before experiments and were transferred to fresh food vials ∼15 min before conditioning for equilibration to the experimental room conditions of 25° and ∼70% humidity. Experiments were performed in a dark room under red filtered light. Standard aversive olfactory conditioning experiments were performed as described (Beck et al. 2000). Each experimental group of ∼60 flies was loaded into a training tube where they received the following sequence of stimuli: 30 sec of air, 1 min of an odor paired with 12 pulses of 90 V electric shock (conditioned stimulus, CS+), 30 sec of air, 1 min of a second odor with no electric shock (CS−), and a final 30 sec of air. For conditioning odors, we bubbled fresh air through 3-octanol (OCT) or benzaldehyde (BEN) at concentrations in mineral oil that provided for optimal balance in the half performance index (PI) between odors. Optimal odor concentrations varied across time and between experimenters but were generally between 0.045 and 0.07% for benzaldehyde and between 0.14 and 0.165% for 3-octanol. After conditioning, flies were returned to a food vial to be tested at the 3-hr time point. Flies were allowed a 1-min resting period followed by a 2-min decision period to choose between a T-maze arm exposing the flies to the CS+ odor and an arm exposing the flies to the CS− odor. For all experiments, two groups were trained and tested simultaneously. One group was trained with OCT as the conditioned stimulus paired with electric shock (CS+) and BEN unpaired with electric shock (CS−), while the other group was trained with BEN as CS+ and OCT as CS−. Each group tested provides a half PI: Half PI = [(no. flies in CS− arm) − (no. flies in CS+ arm)]/(no. flies in both arms). A final PI was calculated by averaging the two half PIs. Since the two groups were trained to opposite CS+/CS− odor pairs, this method balances out naive odor biases.
To test for odor avoidance, naive flies were allowed 2 min within the T-maze to choose between an arm with odor and an arm with fresh air. The odor avoidance index was calculated as the [(no. flies in fresh air arm) − (no. flies in odor arm)]/(no. flies in both arms). To test for shock avoidance, naive flies were allowed 2 min within the T-maze to choose between an arm with an electrified copper grid (same as used for conditioning above) and an arm with a nonelectrified copper grid. The side that is electrified was alternated to control for any side-to-side T-maze bias. The shock avoidance index was calculated as the [(no. flies in nonelectrified arm) − (no. flies in electrified arm)]/(no. flies in both arms).
For TriKinetics locomotor activity monitoring, 2- to 3-day-old flies were tested using the TriKinetics DAM5 Activity Monitor (www.trikinetics.com). In each experiment, eight flies of each genotype were randomly selected and placed into individual glass tubes. Eight flies of the control group, 60100, were assayed in parallel with approximately six different experimental groups. Flies selected were of both genders and tested at approximately the same time of day as the 3-hr memory experiments. Flies were raised on a 12:12 light:dark cycle. The flies were monitored for a 10-min period with the number of beam breaks recorded across 30-sec intervals. Activity scores were calculated by averaging the number of beam breaks per 30-sec epoch in the first 2 min. This experimental design was chosen to estimate the locomotor activity of the lines across the 2-min decision period that the flies have during testing in the T-maze after classical olfactory conditioning. The average activity score of each RNAi line tested was compared to the control line using one-way ANOVA followed by Dunnett’s post hoc test.
Statistics
GraphPad Prism was used to analyze most of the data. The TriKinetics data were analyzed using the statistical package, R. PIs among experimenters followed a normal distribution (Figure 1). Therefore, we used a one-tailed Student t-test to compare the performance of an RNAi line to a control group in experiments that employed a control group tested in parallel, namely the characterization experiments of sickie and dunce. Significance was set at α = 0.05. For all comparisons of the effect of genotype on memory retention across selected time points, we performed a two-way ANOVA with both genotype and time as factors. We followed the two-way ANOVA with a Bonferroni post hoc comparison among the relevant groups. Significance was set at α = 0.05.
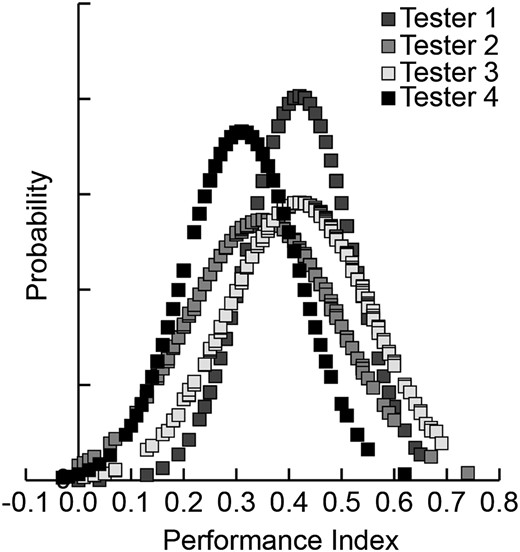
Performance indices for testers. Distribution of performance indices obtained by four testers involved in the screen for the first 200 lines screened by each tester using n = 4 for each line. Differences in the manual procedure and apparatuses (T-mazes, etc.) produce some variability between testers, with the average 3-hr PI ranging from 0.32 to 0.42. PIs for each tester were normally distributed.
Results
We obtained 3655 uas-RNAi lines (Table 1) for our screen from the Vienna Drosophila RNAi Center (http://stockcenter.vdrc.at/control/main) that were preselected for relevance to CNS development and function using bioinformatics criteria. The sources used to obtain this information and the filters used for selection included: (1) FlyBase (http://flybase.org/) listed genes that were selected from a query using gene ontology terms: (a) nervous system development, (b) neurological system process, (c) behavior, (d) neurophysiology defective, (e) neuroanatomy defective, (f) behavior defective, (g) adult brain, and (h) nervous system. (2) FlyAtlas (http://www.flyatlas.org/) listed genes with a preferential expression ratio of >1.5 in the brain and thoracicoabdominal ganglia compared to other nonneuronal tissues. (3) Fly genes whose mammalian orthologs are thought to be involved in neuronal processes from the literature (Cajigas et al. 2012; Hodas et al. 2012).
Outlier selections from primary and secondary screens
| Lines obtained | Lines screened | Primary screen hits | Secondary screen hits |
|---|---|---|---|
| 3655 | 3207 | 964 | 600 |
| Lines obtained | Lines screened | Primary screen hits | Secondary screen hits |
|---|---|---|---|
| 3655 | 3207 | 964 | 600 |
Outliers from the primary and secondary screen of the KK RNAi library were made based on the distribution of performance index scores of the population shown in Figure 1. The average PI of the first 800 lines, 200 tested by each experimenter, was 0.38 with a standard deviation of 0.14. Lines deviating by ∼1 standard deviation from the mean (0.24< and >0.52) were kept as putative hits.
| Lines obtained | Lines screened | Primary screen hits | Secondary screen hits |
|---|---|---|---|
| 3655 | 3207 | 964 | 600 |
| Lines obtained | Lines screened | Primary screen hits | Secondary screen hits |
|---|---|---|---|
| 3655 | 3207 | 964 | 600 |
Outliers from the primary and secondary screen of the KK RNAi library were made based on the distribution of performance index scores of the population shown in Figure 1. The average PI of the first 800 lines, 200 tested by each experimenter, was 0.38 with a standard deviation of 0.14. Lines deviating by ∼1 standard deviation from the mean (0.24< and >0.52) were kept as putative hits.
We used 3-hr memory as the critical time point for screening, since this time point after conditioning allows hits to be identified that affect acquisition (learning), memory stability, memory consolidation, forgetting, and/or retrieval. We anticipated that hits affecting acquisition might alter the processing of the CS signal, the unconditioned stimulus (US) signal, or the integration of the CS and US. Hits that alter memory stability may alter general mechanisms that promote memory stabilization that are not yet well defined, consolidation of memories into a form resistance to experimental insults, or forgetting (Dudai et al. 1976; Tully et al. 1994; Shuai et al. 2010; Berry et al. 2012). Within the first few hours after conditioning, Drosophila olfactory memories are known to consist of anesthesia sensitive memory (ASM), a form disruptable with cold anesthesia, and anesthesia resistant memory (ARM), a consolidated form of memory that is resistant to this treatment (Folkers et al. 1993). Our strategy utilized the CNS-wide gal4 driver, Nsyb-gal4, to identify as many cellular players as possible, anticipating that further studies would identify the cell types in the brain that require the function of any identified gene.
Each individual uas-RNAi line was crossed with Nsyb-gal4 and the F1 progeny collected and tested for 3-hr memory after olfactory classical conditioning. Of the 3655 lines obtained, 3207 produced F1 progeny in sufficient numbers for conditioning and testing (Table 1; Table S1). The screen employed four laboratory testers that produced population PIs that followed a normal distribution (Figure 1). A total of 964 outliers, or hits, were selected from the primary screen using soft floor and ceiling thresholds that approximated ±1 standard deviation from the population mean (Table 1). Thus, lines producing scores above ∼0.52 were kept as high performers, and lines producing scores below ∼0.24 were kept as low performers. The mean 3-hr PI across the complete screen was 0.34. The 964 primary hits were rescreened, again using the population mean as a control. In this secondary screen, 600 hits were confirmed (Table 1). Five hundred and fifty seven of these lines performed with a reduced PI (Table S2). Forty-two lines exhibited an increased PI (Table 2).
Outliers from the secondary screen with an increased PI
| Transformant ID | CG no. | Drosophila gene | Primary | Secondary | Physical abnormality | Mean activity difference | Act. sig. |
|---|---|---|---|---|---|---|---|
| PI and SEM line | PI and SEM line | ||||||
| 100151 | CG10483 | CG10483 | 0.64 ± 0.10 | 0.62 ± 0.03 | — | −11.66 | |
| 100363 | CG42614 | scribble | 0.85 ± 0.04 | 0.63 ± 0.04 | — | 7.40 | |
| 100624 | CG13521 | roundabout | 0.55 ± 0.06 | 0.61 ± 0.06 | — | −3.13 | |
| 100706 | CG1470 | Guanylyl cyclase β-subunit at 100B | 0.62 ± 0.07 | 0.61 ± 0.02 | — | −4.07 | |
| 100721 | CG11326 | Thrombospondin | 0.65 ± 0.07 | 0.53 ± 0.10 | — | 4.62 | |
| 100727 | CG8715 | lingerer | 0.65 ± 0.12 | 0.54 ± 0.03 | — | 29.81 | *** |
| 101189 | CG42244 | Octβ3R | 0.67 ± 0.03 | 0.6 ± 0.08 | — | −0.38 | |
| 102058 | CG1128 | α-Esterase-9 | 0.65 ± 0.04 | 0.60 ± 0.04 | — | 2.12 | |
| 102373 | CG3217 | CKII-α subunit interactor-3 | 0.66 ± 0.12 | 0.60 ± 0.02 | — | 1.53 | |
| 102563 | CR17025 | CR17025 | 0.56 ± 0.10 | 0.70 ± 0.05 | — | 1.65 | |
| 102816 | CG12806 | tipE homolog 1 | 0.63 ± 0.08 | 0.62 ± 0.03 | — | 19.09 | *** |
| 103625 | CG6746 | CG6746 | 0.61 ± 0.07 | 0.53 ± 0.02 | — | −5.76 | |
| 103767 | CG13387 | embargoed | 0.74 ± 0.03 | 0.64 ± 0.07 | — | 15.15 | ** |
| 104255 | CG6800 | N/A | 0.65 ± 0.09 | 0.63 ± 0.06 | — | −3.04 | |
| 104262 | CG6658 | Ugt86Di | 0.63 ± 0.01 | 0.61 ± 0.06 | — | −7.79 | |
| 104763 | CG10251 | portabella | 0.57 ± 0.06 | 0.72 ± 0.02 | — | 5.78 | |
| 104782 | CG8418 | Ras which interacts with calmodulin | 0.68 ± 0.06 | 0.65 ± 0.07 | — | 1.40 | |
| 104796 | CG5036 | CG5036 | 0.60 ± 0.06 | 0.52 ± 0.04 | — | 8.90 | |
| 105374 | CG11734 | HERC2 | 0.62 ± 0.07 | 0.60 ± 0.08 | — | 2.37 | |
| 105624 | CG42783 | atypical protein kinase C | 0.67 ± 0.07 | 0.59 ± 0.07 | — | 4.53 | |
| 105996 | CG14015 | CG14015 | 0.65 ± 0.03 | 0.60 ± 0.09 | — | 2.37 | |
| 106046 | CG3423 | Stromalin | 0.72 ± 0.04 | 0.61 ± 0.02 | — | 4.09 | |
| 106248 | CG10238 | Molybdopterin synthase 2 | 0.66 ± 0.05 | 0.48 ± 0.01 | — | −4.19 | |
| 106255 | CG7125 | Protein Kinase D | 0.65 ± 0.03 | 0.6 ± 0.02 | — | 2.09 | |
| 106555 | CG7442 | CG7442 | 0.74 ± 0.07 | 0.6 ± 0.05 | — | 13.75 | * |
| 106641 | CG8808 | Pyruvate dehydrogenase kinase | 0.59 ± 0.09 | 0.63 ± 0.07 | — | 5.43 | |
| 106642 | CG9375 | Ras oncogene at 85D | 0.56 ± 0.07 | 0.53 ± 0.05 | — | 8.06 | |
| 106805 | CG9044 | CG9044 | 0.58 ± 0.17 | 0.56 ± 0.11 | — | 6.12 | |
| 107037 | CG43720 | sickie | 0.67 ± 0.03 | 0.61 ± 0.06 | — | 6.90 | |
| 107047 | CG6860 | Leucine-rich-repeats and calponin homology domain protein | 0.62 ± 0.04 | 0.58 ± 0.06 | — | 7.18 | |
| 107297 | CG5941 | CG5941 | 0.63 ± 0.07 | 0.64 ± 0.06 | — | 12.78 | |
| 107725 | CG9481 | UDP-glycosyltransferase 37b1 | 0.6 ± 0.06 | 0.5 ± 0.03 | — | −1.88 | |
| 108011 | CG13893 | CG13893 | 0.58 ± 0.11 | 0.6 ± 0.06 | — | −0.16 | |
| 108453 | CG1657 | CG1657 | 0.60 ± 0.02 | 0.67 ± 0.06 | — | 10.90 | |
| 108694 | CG6384 | Centrosomal protein 190kD | 0.58 ± 0.11 | 0.69 ± 0.06 | — | −2.63 | |
| 108836 | CG1989 | Yippee | 0.56 ± 0.09 | 0.55 ± 0.06 | — | 5.93 | |
| 109290 | CG3654 | Jumonji, AT rich interactive domain 2 | 0.61 ± 0.04 | 0.63 ± 0.01 | — | 5.40 | |
| 110045 | CG30443 | Optix-binding protein | 0.65 ± 0.06 | 0.61 ± 0.14 | — | −0.91 | |
| 110197 | CG5429 | Autophagy-specific gene 6 | 0.63 ± 0.07 | 0.54 ± 0.11 | — | −2.79 | |
| 110205 | CG12178 | Na+/H+ hydrogen exchanger 1 | 0.62 ± 0.13 | 0.60 ± 0.08 | — | −4.72 | |
| 110310 | CG11072 | Maternal gene required for meiosis | 0.53 ± 0.02 | 0.58 ± 0.02 | — | 8.84 | |
| 110788 | CG6438 | amontillado | 0.59 ± 0.05 | 0.54 ± 0.09 | — | 2.87 |
The performance index (PI) was calculated as the number of flies avoiding the CS+ minus those avoiding the CS− over the total in both T-maze arms [(CS−) − (CS+)]/[(CS−) + (CS+)]. The primary screen was performed with n = 3 or 4, the secondary screen at a later date with n = 4. Physical abnormalities, such as misshapen wings or lethargic behavior, are noted by (+) in companion Table S2. Mean activity difference for the 2-min window simulating the decision period during testing was calculated from the TriKinetics Monitoring System (mean activity score 60100) − (mean activity score experimental line). The mean activity score for the 60100 control line was 44.43 ± 0.42 (n = 552). Differences in activity (act. sig.) were determined using ANOVA followed by Dunnett’s post hoc test. *P < 0.05, **P < 0.01, ***P < 0.001.
| Transformant ID | CG no. | Drosophila gene | Primary | Secondary | Physical abnormality | Mean activity difference | Act. sig. |
|---|---|---|---|---|---|---|---|
| PI and SEM line | PI and SEM line | ||||||
| 100151 | CG10483 | CG10483 | 0.64 ± 0.10 | 0.62 ± 0.03 | — | −11.66 | |
| 100363 | CG42614 | scribble | 0.85 ± 0.04 | 0.63 ± 0.04 | — | 7.40 | |
| 100624 | CG13521 | roundabout | 0.55 ± 0.06 | 0.61 ± 0.06 | — | −3.13 | |
| 100706 | CG1470 | Guanylyl cyclase β-subunit at 100B | 0.62 ± 0.07 | 0.61 ± 0.02 | — | −4.07 | |
| 100721 | CG11326 | Thrombospondin | 0.65 ± 0.07 | 0.53 ± 0.10 | — | 4.62 | |
| 100727 | CG8715 | lingerer | 0.65 ± 0.12 | 0.54 ± 0.03 | — | 29.81 | *** |
| 101189 | CG42244 | Octβ3R | 0.67 ± 0.03 | 0.6 ± 0.08 | — | −0.38 | |
| 102058 | CG1128 | α-Esterase-9 | 0.65 ± 0.04 | 0.60 ± 0.04 | — | 2.12 | |
| 102373 | CG3217 | CKII-α subunit interactor-3 | 0.66 ± 0.12 | 0.60 ± 0.02 | — | 1.53 | |
| 102563 | CR17025 | CR17025 | 0.56 ± 0.10 | 0.70 ± 0.05 | — | 1.65 | |
| 102816 | CG12806 | tipE homolog 1 | 0.63 ± 0.08 | 0.62 ± 0.03 | — | 19.09 | *** |
| 103625 | CG6746 | CG6746 | 0.61 ± 0.07 | 0.53 ± 0.02 | — | −5.76 | |
| 103767 | CG13387 | embargoed | 0.74 ± 0.03 | 0.64 ± 0.07 | — | 15.15 | ** |
| 104255 | CG6800 | N/A | 0.65 ± 0.09 | 0.63 ± 0.06 | — | −3.04 | |
| 104262 | CG6658 | Ugt86Di | 0.63 ± 0.01 | 0.61 ± 0.06 | — | −7.79 | |
| 104763 | CG10251 | portabella | 0.57 ± 0.06 | 0.72 ± 0.02 | — | 5.78 | |
| 104782 | CG8418 | Ras which interacts with calmodulin | 0.68 ± 0.06 | 0.65 ± 0.07 | — | 1.40 | |
| 104796 | CG5036 | CG5036 | 0.60 ± 0.06 | 0.52 ± 0.04 | — | 8.90 | |
| 105374 | CG11734 | HERC2 | 0.62 ± 0.07 | 0.60 ± 0.08 | — | 2.37 | |
| 105624 | CG42783 | atypical protein kinase C | 0.67 ± 0.07 | 0.59 ± 0.07 | — | 4.53 | |
| 105996 | CG14015 | CG14015 | 0.65 ± 0.03 | 0.60 ± 0.09 | — | 2.37 | |
| 106046 | CG3423 | Stromalin | 0.72 ± 0.04 | 0.61 ± 0.02 | — | 4.09 | |
| 106248 | CG10238 | Molybdopterin synthase 2 | 0.66 ± 0.05 | 0.48 ± 0.01 | — | −4.19 | |
| 106255 | CG7125 | Protein Kinase D | 0.65 ± 0.03 | 0.6 ± 0.02 | — | 2.09 | |
| 106555 | CG7442 | CG7442 | 0.74 ± 0.07 | 0.6 ± 0.05 | — | 13.75 | * |
| 106641 | CG8808 | Pyruvate dehydrogenase kinase | 0.59 ± 0.09 | 0.63 ± 0.07 | — | 5.43 | |
| 106642 | CG9375 | Ras oncogene at 85D | 0.56 ± 0.07 | 0.53 ± 0.05 | — | 8.06 | |
| 106805 | CG9044 | CG9044 | 0.58 ± 0.17 | 0.56 ± 0.11 | — | 6.12 | |
| 107037 | CG43720 | sickie | 0.67 ± 0.03 | 0.61 ± 0.06 | — | 6.90 | |
| 107047 | CG6860 | Leucine-rich-repeats and calponin homology domain protein | 0.62 ± 0.04 | 0.58 ± 0.06 | — | 7.18 | |
| 107297 | CG5941 | CG5941 | 0.63 ± 0.07 | 0.64 ± 0.06 | — | 12.78 | |
| 107725 | CG9481 | UDP-glycosyltransferase 37b1 | 0.6 ± 0.06 | 0.5 ± 0.03 | — | −1.88 | |
| 108011 | CG13893 | CG13893 | 0.58 ± 0.11 | 0.6 ± 0.06 | — | −0.16 | |
| 108453 | CG1657 | CG1657 | 0.60 ± 0.02 | 0.67 ± 0.06 | — | 10.90 | |
| 108694 | CG6384 | Centrosomal protein 190kD | 0.58 ± 0.11 | 0.69 ± 0.06 | — | −2.63 | |
| 108836 | CG1989 | Yippee | 0.56 ± 0.09 | 0.55 ± 0.06 | — | 5.93 | |
| 109290 | CG3654 | Jumonji, AT rich interactive domain 2 | 0.61 ± 0.04 | 0.63 ± 0.01 | — | 5.40 | |
| 110045 | CG30443 | Optix-binding protein | 0.65 ± 0.06 | 0.61 ± 0.14 | — | −0.91 | |
| 110197 | CG5429 | Autophagy-specific gene 6 | 0.63 ± 0.07 | 0.54 ± 0.11 | — | −2.79 | |
| 110205 | CG12178 | Na+/H+ hydrogen exchanger 1 | 0.62 ± 0.13 | 0.60 ± 0.08 | — | −4.72 | |
| 110310 | CG11072 | Maternal gene required for meiosis | 0.53 ± 0.02 | 0.58 ± 0.02 | — | 8.84 | |
| 110788 | CG6438 | amontillado | 0.59 ± 0.05 | 0.54 ± 0.09 | — | 2.87 |
The performance index (PI) was calculated as the number of flies avoiding the CS+ minus those avoiding the CS− over the total in both T-maze arms [(CS−) − (CS+)]/[(CS−) + (CS+)]. The primary screen was performed with n = 3 or 4, the secondary screen at a later date with n = 4. Physical abnormalities, such as misshapen wings or lethargic behavior, are noted by (+) in companion Table S2. Mean activity difference for the 2-min window simulating the decision period during testing was calculated from the TriKinetics Monitoring System (mean activity score 60100) − (mean activity score experimental line). The mean activity score for the 60100 control line was 44.43 ± 0.42 (n = 552). Differences in activity (act. sig.) were determined using ANOVA followed by Dunnett’s post hoc test. *P < 0.05, **P < 0.01, ***P < 0.001.
About half of the lines (264) identified as low performers (Table S2) emerged with physical abnormalities using Nsyb-gal4 as a driver, the most common of which was misshapen wings. In addition, locomotor assays were performed for 362 of the lines and 213 exhibited a significant difference in locomotor activity. These observations suggest that a large fraction of the low performing lines were recovered due to associated developmental defects, rather than specific impairments in the molecular machinery underlying memory formation. This is also suggested by the nature of many of the genes identified. For instance, 18 of the low performing lines expressed RNAi’s to mitochondrial ribosomal proteins, consistent with a general developmental disability due to poor calcium homeostasis or energy supply. The low hit list is also populated with genes with known general developmental roles, such as folded gastrulation, prospero, faint sausage, gooseberry neuro, and others. Many of the low hits with obvious developmental abnormalities may be important for furthering our understanding of intellectual disabilities. The uncharacterized genes (CGXXXX) without obvious developmental issues will be of future importance in dissecting the genetic basis for memory formation.
Importantly, many of the genes already known to function in olfactory memory formation were identified in the RNAi screen, providing internal validation of the effectiveness of the screen (Table 3). A recent review (Tomchik and Davis 2013) listed 30 genes that have been reported to be involved in olfactory memory acquisition, short-term memory, or intermediate-term memory, processes and phases that would have been captured in our 3-hr memory screen. Eight of the 30 identified genes reported in Tomchik and Davis (2013) were recaptured in the RNAi screen, including the classical mutants dunce and rutabaga (Dudai et al. 1976; Tempel et al. 1983; Livingstone et al. 1984; Folkers et al. 1993; Connolly et al. 1996; Moreau-Fauvarque et al. 2002; Ho et al. 2007; Knapek et al. 2010; Madalan et al. 2011). It was not expected that all known genes would be reidentified, since only a fraction of the genome was screened, some RNAi transgenes may not be functional, and the degree of knockdown by RNAi for some involved genes may be too slight to produce a phenotype.
Known memory genes identified from the RNAi screen
| Transformant ID | CG no. | Drosophila gene | Reference |
|---|---|---|---|
| 19124 | CG2204 | G protein oα 47A | Madalan et al. (2011) |
| 100039 | CG17348 | derailed | Moreau-Fauvarque et al. (2002) |
| 101759 | CG9533 | rutabaga | Livingstone et al. (1984) |
| 101811 | CG15720 | radish | Folkers et al. (1993) |
| 104422 | CG42344 | bruchpilot | Knapek et al. (2010) |
| 105485 | CG2835 | G protein sα 60A | Connolly et al. (1996) |
| 107967 | CG32498 | dunce | Dudai et al. (1976) |
| 109637 | CG8318 | Neurofibromin 1 | Ho et al. (2007) |
| 109881 | CG10697 | Dopa decarboxylase | Tempel et al. (1983) |
| 110606 | CG3985 | Synapsin | Knapek et al. (2010) |
The subset of lines from Table S2 representing genes that have already been reported to be involved in memory formation.
| Transformant ID | CG no. | Drosophila gene | Reference |
|---|---|---|---|
| 19124 | CG2204 | G protein oα 47A | Madalan et al. (2011) |
| 100039 | CG17348 | derailed | Moreau-Fauvarque et al. (2002) |
| 101759 | CG9533 | rutabaga | Livingstone et al. (1984) |
| 101811 | CG15720 | radish | Folkers et al. (1993) |
| 104422 | CG42344 | bruchpilot | Knapek et al. (2010) |
| 105485 | CG2835 | G protein sα 60A | Connolly et al. (1996) |
| 107967 | CG32498 | dunce | Dudai et al. (1976) |
| 109637 | CG8318 | Neurofibromin 1 | Ho et al. (2007) |
| 109881 | CG10697 | Dopa decarboxylase | Tempel et al. (1983) |
| 110606 | CG3985 | Synapsin | Knapek et al. (2010) |
The subset of lines from Table S2 representing genes that have already been reported to be involved in memory formation.
Remarkably, the secondary screen identified 42 RNAi transgenes whose expression improved 3-hr olfactory memory! These genes thus belong to the general category of memory suppressor genes, genes whose normal function is to suppress memory, analogous to the normal role for tumor suppressor genes in the suppression of tumor growth (Abel et al. 1998). There are several ways that gene knockdown could enhance memory. It may be that the knockdown increases the salience of the environmental stimuli (odor and shock) used for conditioning. The gene product may function to suppress the integration of the two stimuli, i.e., suppress the process of acquisition. Memory tested at 3 hr also reflects the stability of the memory produced by acquisition, such that processes that increase (for instance, consolidation) or decrease memory stability (i.e., forgetting), would be captured. Nevertheless, given the paucity of memory suppressor genes, this set offers an extremely valuable group for further study.
The dnc gene, the prototypic memory formation gene, was identified among the low hits using RNAi line, uas-RNAi107967. The gene encodes the enzyme cAMP phosphodiesterase (Byers et al. 1981; Chen et al. 1986), is preferentially expressed in the mushroom bodies (Nighorn et al. 1991), and exhibits remarkable gene structure and RNA complexity (Davis and Davidson 1986; Qiu et al. 1991). Surprisingly, although dnc was the first memory gene characterized with beautiful expression in the mushroom bodies, numerous questions remain regarding its function in different types of neurons that can be dissected using an RNAi approach.
We crossed the dncRNAi to a battery of gal4 drivers known to express in different compartments of the brain and measured 3-hr memory to map the spatial requirement for dnc function (Figure 2A). In this experiment, the gal4 > RNAi genotype was compared to gal4 > 60100, 60100 being the host genotype for producing the RNAi transgenics (see Materials and Methods). Expression of the dncRNAi with most drivers was without effect, but a significant impairment in 3-hr memory was observed with Nsyb-gal4, c772-gal4, 238y-gal4, c739-gal4, and 1471-gal4. The c772-gal4 and 238y-gal4 drivers provide strong and preferential expression in the mushroom bodies (Aso et al. 2009). The c739-gal4 driver is specific to α/β-mushroom body neurons; 1471-gal4 is relatively specific to γ-mushroom body neurons. The impairments observed in 3-hr memory when the dncRNAi was driven by mushroom body gal4 drivers are not attributable to impairments in odor or shock sensitivity (Figure 2, B and C). These data map dnc function in memory to both the α/β- and γ-mushroom body neurons.
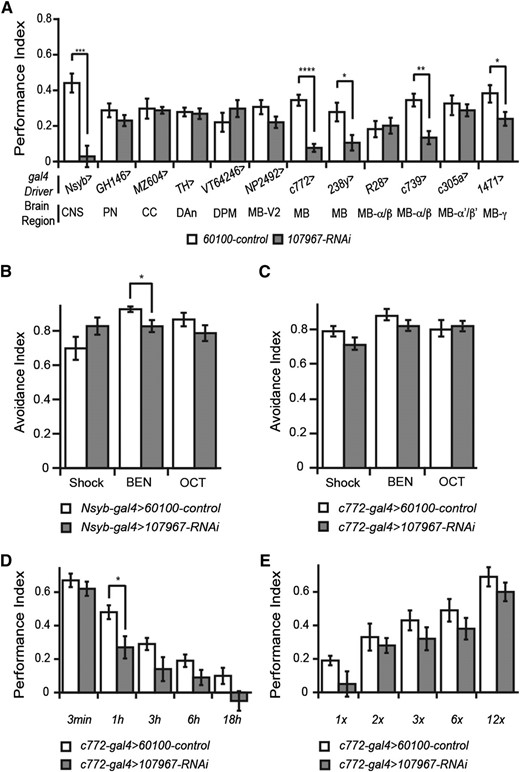
RNAi analysis of dnc function in memory formation. (A) Spatial mapping of the memory impairment produced by expression of dncRNAi-107967. Twelve different gal4 drivers were employed to promote RNAi expression in different sets of brain neurons. The parental line for the RNAi transgenic lines, 60100, was crossed to the same set of gal4 drivers and used as the control. The PIs for the various gal4 driver lines were variable due to genetic background. Comparisons made were therefore between each individual gal4 driver and its paired experimental group. CNS, all neurons; PN, projection neurons; CC, central complex; DAn, dopamine neurons; DPM, dorsal paired medial neurons; MB-V2, mushroom body V2 output neurons; MB, mushroom body neurons; MB-a/b, alpha/beta lobes of the mushroom body; MB-a′/b′, alpha′/beta′ lobes of the mushroom body; MB-g, gamma lobe of the mushroom body. (B) Odor and shock avoidance of the control and RNAi crossed to the panneuronal driver, Nsyb-gal4. The dncRNAi line exhibited a significantly reduced avoidance to benzaldehyde (BEN) compared to the control. No differences were observed with shock or the odorant 3-octanol, OCT. (C) Odor and shock avoidance of the control and RNAi crossed to the mushroom body driver, c772-gal4. No significant differences between the dncRNAi line and control were observed. (D) Performance indices of memory measured at multiple times after conditioning for the dncRNAi line compared to the control. A significant difference was detected at 1 hr after conditioning in this experiment, although trends toward reduced performance were observed at 3 and 6 hr as well. (E) Memory acquisition curve of dncRNAi-107967. Performance indices for acquisition using 1, 2, 3, 6, and 12 shock pulses measured for the dncRNAi line compared to the control. No significant differences were observed between the RNAi line and the control.
We also measured memory in control and experimental flies expressing dncRNAi in the mushroom bodies at various times after conditioning, to probe the kinetics of memory decay (Figure 2D). No significant difference in performance was observed between the two groups at 3 min after conditioning, the earliest time point that can be measured. A significant difference in performance was observed at 1 hr after conditioning and strong trends toward performance impairments were observed in the experimental flies at 3 and 6 hr after conditioning. We also measured the rate of acquisition by varying the number of shock pulses presented to the flies during conditioning (Figure 2E). Interestingly, no significant differences were observed with 1, 2, 3, 6, or 12 shocks between the two groups, suggesting that acquisition processes are not significantly impaired in the dncRNAi knockdown. The conclusions must remain provisional, since RNAi knockdown is seldom complete in its effects, and acquisition experiments do not provide a perfect and uncontaminated measure of acquisition processes. Nevertheless, the results are compatible with the model that dnc provides a function in the mushroom body neurons required for maintaining the stability of memory after conditioning.
Table 2 lists the interesting set of RNAi lines that improve memory when expressed with Nsyb-gal4. The list contains genes with a remarkably diverse set of cellular functions, with no one biochemical pathway or cellular process appearing to dominate memory suppressor functions. We selected one gene, sickie, for further characterization to illustrate an effective path to gain further insights into the mechanisms underlying memory suppressor genes. This gene was selected because of its interesting role in the regulation of the NF-κB signaling pathway and function in immunity (Foley and O’Farrell 2004), offering an entrée to exploring the relationship between innate immunity and memory functions (see Discussion).
We crossed the sickieRNAi to a battery of gal4 drivers to map the spatial effect of the RNAi. None of the gal4 drivers with expression in specific regions or cell types were with effect, except for TH-gal4 (Figure 3A), a tyrosine hydroxylase promoter-based gal4 that drives expression in the vast majority of dopaminergic neurons (Friggi-Grelin et al. 2003; Mao and Davis 2009). Odor and shock avoidance were not significantly different from the control using TH-gal4 (Figure 3C), although the broader expression with Nsyb-gal4 produced impairment in benzaldehyde avoidance (Figure 2B). A second sickie RNAi line was tested and found to enhance 3-hr memory (Figure 3F), dramatically reducing the possibility that the memory enhancement was due to off-target effects.
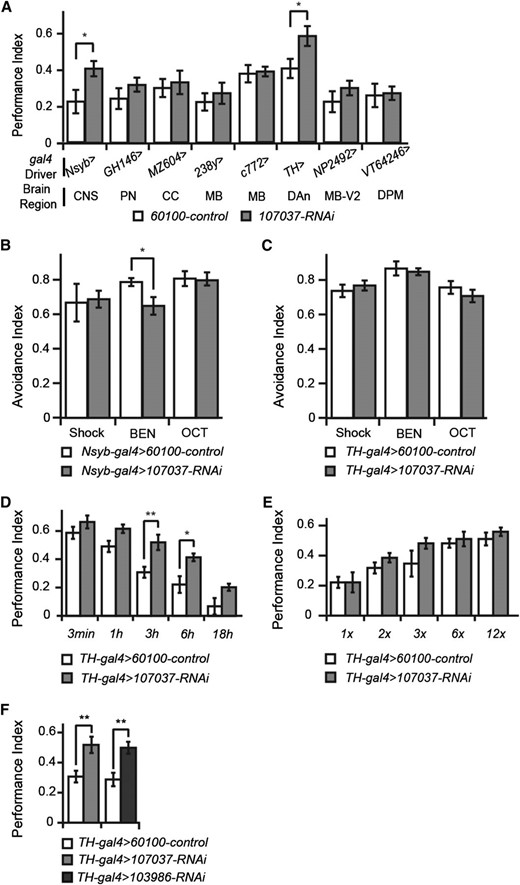
RNAi analysis of sickie function in memory formation. (A) Spatial mapping of the memory enhancement produced by expression of sickieRNAi-107037. Eight different gal4 drivers were employed to promote RNAi expression in different sets of brain neurons. The parental line for the RNAi transgenic lines, 60100, was crossed to the same set of gal4 drivers and used as the control. The PIs for the various gal4 driver lines were variable due to genetic background. Comparisons made were therefore between each individual gal4 driver and its paired experimental group. CNS, all neurons; PN, projection neurons; CC, central complex; MB, mushroom body neurons; DAn, dopamine neurons; MB-V2, mushroom body V2 output neurons; DPM, dorsal paired medial neurons. (B) Odor and shock avoidance of the control and RNAi crossed to the panneuronal driver, Nsyb-gal4. The sickieRNAi line exhibited a significantly reduced avoidance to benzaldehyde (BEN) compared to the control. No differences were observed with shock or the odorant 3-octanol, OCT. (C) Odor and shock avoidance of the control and RNAi crossed to the mushroom body driver, TH-gal4. No significant differences between the sickieRNAi line and control were observed. (D) Performance indices of memory measured at multiple times after conditioning for the sickieRNAi line compared to the control. A significant difference was detected at 3 hr and 6 hr after conditioning in this experiment, although trends toward enhanced performance were observed at 18 hr as well. (E) Memory acquisition curve of sickieRNAi-107037. Performance indices for acquisition using 1, 2, 3, 6, and 12 shock pulses measured for the sickieRNAi line compared to the control. No significant differences were observed between the RNAi line and the control. (F) Comparison of performance indices of memory of additional RNAi constructs for sickie. SickieRNAi-107037 and sickieRNAi-103986 both demonstrated significantly enhanced memory compared to the control.
An acquisition profile constructed using varying shock numbers during training revealed no difference between the control group and the sickieRNAi knockdown (Figure 3E). A memory curve constructed after the normal 12-shock learning paradigm revealed significantly enhanced performance at 3 and 6 hr after conditioning, although no significant difference was observed at 3 min after training (Figure 3D), confirming the results of the 12-shock portion of the acquisition profile (Figure 3E). The combined data suggest that sickie knockdown has no effect on the acquisition of information, but is involved in subsequent memory stability. Since dopaminergic neurons have been proposed to chronically release dopamine after learning to promote forgetting (Berry et al. 2012), an attractive working hypothesis is that sickie RNAi reduces the dopaminergic forgetting signal.
Discussion
The results of the large RNAi screen for memory genes reported here offer a valuable resource for the future study of three different classes of genes that alter memory formation: (1) genes that are required for normal development of the nervous system and produce a memory impairment when their expression is reduced, (2) genes that encode products that have a role in the neural physiology of memory formation and impair memory when their expression is reduced, and (3) genes that normally function as memory suppressor genes.
The delineation of genes with developmental roles from those that impair memory formation through neurophysiological mechanisms requires further experimentation using TARGET or Gene-Switch strategies to map the RNAi effects to the temporal domain of development or adulthood (McGuire et al. 2004). Nevertheless, the identification of both classes is extremely valuable: genes with specific developmental roles for nervous system that alter memory processing when defective may provide insights into the developmental routines required for constructing portions of the nervous system necessary for olfactory memory. In this sense, some of these may offer models for human intellectual disabilities (IDs). For instance, several genes representing the low hits show high similarities to mammalian genes that cause ID, such as armadillo (β-catenin), little imaginal discs (lysine-specific demethylase 5c), Klp31E (kinesin-like protein KIF4A), and mushroom bodies tiny (serine/threonine-protein kinase PAK 3). β-Catenin is critical for embryonic and craniofacial development through the WNT signaling pathway and serves as an intracellular anchor for the cadherin family of cell adhesion receptors. Two recent studies found that dominant β-catenin mutations resulted in syndromic intellectual disability (Dubruc et al. 2014; Tucci et al. 2014). Lysine-specific demethylase 5c (also known as JARID1C) is an X-linked intellectual disability gene and participates in neural development by regulating chromatin remodeling (Jensen et al. 2005; Najmabadi et al. 2011). KIF4A was identified as an intellectual disability factor through next-generation sequencing of families segregating intellectual disability (Willemsen et al. 2014). PAK3, too, is an X-linked intellectual disability gene (Magini et al. 2014). Those genes identified that underlie the neurophysiology of memory formation provide a resource for dissecting memory mechanisms, as well as perhaps providing insights into the genetics of neuropsychiatric disorders (McDonald et al. 2012), since most neuropsychiatric disorders alter memory processing. For instance, 18 of the Drosophila genes listed in Table 2 and Table S2 are homologs of the 351 putative, schizophrenia-associated genes linked to the known 108 human schizophrenia-associated loci mapped from genome-wide association studies (Schizophrenia Working Group of the Psychiatric Genomics Consortium 2014). Furthermore, the novel genes identified (CGXXXX) offer a very exciting resource, given their unrecognized character and involvement in memory processing.
Lee (2014) provided a list of 26 genes whose classical or conditional knockout in the mouse enhances memory. Remarkably, there is no overlap between this list of memory suppressor genes in the mouse and those in Drosophila (Table 2). However, studies using the mouse have generally employed behavioral tests that quantify long-term memory, such as contextual fear conditioning or water maze learning. Our studies employed a single olfactory training session that generates short- and intermediate-term memory, but not protein synthesis-dependent, long-term memory. In addition, the failure to find overlap despite the general conservation in cellular mechanisms for learning and memory (Davis 2005) is likely also due to the fact that saturation screens have not been completed. We screened ∼25% of the Drosophila genome using an RNAi approach; memory suppressor genes in the mouse have been identified through candidate gene approaches rather than forward genetic screens.
Our screen led us to further dissect dnc, the first memory mutant isolated in any organism (Dudai et al. 1976). Our results indicate that the dnc gene product, cAMP phosphodiesterase, is required in the mushroom body neurons for normal memory. This coincides with its preferential expression in these neurons (Nighorn et al. 1991). In addition, our results are consistent with the hypothesis that dnc functions within these neurons for memory stability, rather than in acquisition processes, per se. Prior studies have assigned to dnc a function in acquisition, based on poor mutant performance immediately after conditioning (Dudai et al. 1976; Tully and Quinn 1985). However, this mutant phenotype may be due to a requirement for dnc function in another node of the olfactory nervous system, a hypothesis consistent with data claiming poor immediate performance with loss of function in the antennal lobe (Scheunemann et al. 2012). Nevertheless, a caveat to our provisional conclusion that dnc mediates memory stability through roles in the mushroom body neurons is that RNAi expression is likely to produce a partial loss of function (Figure 2E). A complete loss of function in the mushroom bodies might produce impairments during acquisition tests, as well as subsequent memory tests.
We also performed a partial characterization of one new memory suppressor gene, sickie. Sickie was identified originally in an RNAi screen for immune system molecules that regulate the activation of the NF-κB family member Relish by the caspase-8 homolog Dredd (Foley and O’Farrell 2004). Sickie gene function is required for the translocation of Relish from the cytoplasm to the nucleus in response to the detection of gram-negative bacteria. If the many signaling molecules involved in the immune deficiency pathway (Foley and O’Farrell 2004) are conserved in general function in dopaminergic neurons for normal memory functions, then one might have expected these to also have been identified from our RNAi screen (Figure 3A). The fact that they were not may indicate that sickie has a unique function in dopaminergic neurons, or that our partial loss-of-function screen of only a portion of the genome simply failed to identify the other players. Structural analysis of the predicted sickie amino acid sequence indicates a relationship with the AAA+ ATPase family of proteins.
Acknowledgments
We acknowledge the Vienna Drosophila RNAi Center for furnishing all the RNAi lines. This research was supported by National Institutes of Health 2R37NS19904 and 1RC4AA020461 to R.L.D.
Footnotes
Supporting information is available online at http://www.genetics.org/lookup/suppl/doi:10.1534/genetics.114.173575/-/DC1.
Communicating editor: M. Wolfner
